
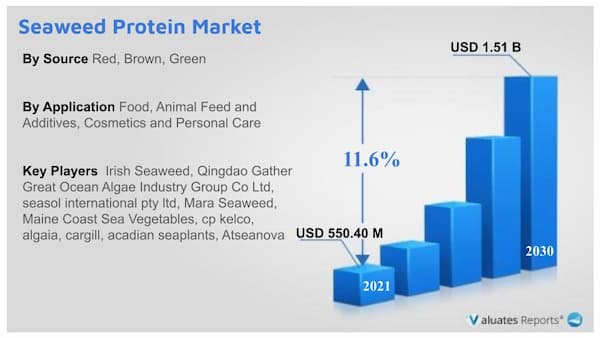
The global seaweed protein industry was valued at $550.40 million in 2021, and is projected to reach $1.51 billion by 2030, growing at a CAGR of 11.6% from 2022 to 2030. The global seaweed protein market size is increasing, owing to rising demand for plant-based foods. Seaweeds are healthy as they are rich in minerals, vitamins, and micronutrients, all of which aid in the promotion of good health. As a result, the global seaweed protein demand is estimated to increase during the forecast period. The need for healthy plant-based products is majorly driving the global expansion of plant-based protein supplements and is anticipated to drive the seaweed protein market growth.
Seaweed farming is considerably expensive than land farming, which could hamper the global seaweed protein market revenue growth. Furthermore, due to presence of harmful minerals, excessive consumption of seaweed might create health concerns. Most of the seaweed contains high levels of iodine that may affect the human body, if consumed excessive seaweed products over an extended period. People can suffer due to high levels of iodine as some are more vulnerable to its effects, which can include hyperthyroidism. This condition may cause drastic weight change or swelling and tightness around the neck.
Popularity of seaweed protein as a plant-based protein in food products is rising as it has a number of benefits. Seaweed protein is rich in nutrients which is anticipated to generate excellent opportunities for the key players operating in the market. Seaweed farming's high expenses, on the other hand, are expected to hamper the market revenue growth. Seaweed output has increased year after year as customers seek a better lifestyle, resulting in higher demand for seaweeds. Seaweeds are pure, safe, secure, high-quality, and nutritious based. the aforementioned factors are anticipated to propel the market over the forecast period.
Some of the leading market players are CP Kelco, Cargill, Incorporated, Qingdao Gather Great Ocean Algae Industry Group CO. LTD, Mara Seaweed, ASL, Irish Seaweeds, AtSeaNova, ALGAIA, Seasol, and Maine Coast Sea Vegetables.
The seaweed protein market is segmented on the basis of type, application, and region. By type, the market is sub-segmented into red, brown, and green. By application, the market is classified into food, animal feed & additives, cosmetics & personal care, and others. By region, the market is analyzed across North America, Europe, Asia-Pacific, and LAMEA.
By type, the red sub-segment dominated the market in 2021. Red seaweed has the highest protein content. Also, red seaweed has higher level of minerals, vitamins, trace elements, and essential fatty acids. Red seaweed is commonly used as a raw ingredient in Asian cuisines, salads, and soups. Furthermore, in nations such as Korea, the U.K., and Japan, several well-known red seaweeds with high nutritional content, such as gim seaweed, dulse seaweed, and nori/porphyra seaweed, are commonly consumed.
By application, the food sub-segment dominated the market 2021. This increase in the market can be attributed to the use of seaweed in the food industry, as red and brown seaweeds can be used to make three different types of hydrocolloids, which are non-crystalline substances that thicken (viscous) solutions when dissolved in water, such as carrageenan, agar, and alginate. Hydrocolloids are primarily utilized in the food industry to emulsify, gel, preserve, and thicken foods and beverages. All of these factors are projected to drive the seaweed protein market share in food applications and accelerate market expansion.
By region, North America is projected to remain the fastest-growing sub-segment during the forecast period. Plant-based products are in high demand in the North America region. The U.S. has a monopoly in the seaweed market in the region. The market for seaweed protein in North America is predicted to grow at a CAGR of 12.9%, creating $432.4 million in sales. Seaweeds are rich in minerals, vitamins, and micronutrients, all of which contribute to good health which is attracting the U.S. population. In addition, major players are seeking for strategic alliances and collaborations to help them increase their product reach in the global market. In April 2020, Acadian, a Canadian food supply chain company, announced that its seaweed extract products can help farmers boost plant productivity. As a result of these factors, the demand for seaweed protein is expected to rise in the next years.
| Report Metric | Details |
| Report Name | Global Seaweed Protein Market |
| Base Year | 2021 |
| Forecasted years | 2022-2030 |
| By Company | Irish Seaweed, Qingdao Gather Great Ocean Algae Industry Group Co Ltd, seasol international pty ltd, Mara Seaweed, Maine Coast Sea Vegetables, cp kelco, algaia, cargill, acadian seaplants, Atseanova |
| Segment by Type |
|
| Segment by Application |
|
| Consumption by Region |
|
| Forecast units | USD million in value |
| Report coverage | Revenue and volume forecast, company share, competitive landscape, growth factors and trends |
LIST OF TABLES
TABLE 1. GLOBAL SEAWEED PROTEIN MARKET, BY SOURCE, 2021-2030 ($MILLION)
TABLE 2. SEAWEED PROTEIN MARKET SIZE, FOR RED, BY REGION, 2021-2030 ($MILLION)
TABLE 3. SEAWEED PROTEIN MARKET FOR RED, BY COUNTRY, 2021-2030 ($MILLION)
TABLE 4. SEAWEED PROTEIN MARKET SIZE, FOR BROWN, BY REGION, 2021-2030 ($MILLION)
TABLE 5. SEAWEED PROTEIN MARKET FOR BROWN, BY COUNTRY, 2021-2030 ($MILLION)
TABLE 6. SEAWEED PROTEIN MARKET SIZE, FOR GREEN, BY REGION, 2021-2030 ($MILLION)
TABLE 7. SEAWEED PROTEIN MARKET FOR GREEN, BY COUNTRY, 2021-2030 ($MILLION)
TABLE 8. GLOBAL SEAWEED PROTEIN MARKET, BY APPLICATION, 2021-2030 ($MILLION)
TABLE 9. SEAWEED PROTEIN MARKET SIZE, FOR FOOD, BY REGION, 2021-2030 ($MILLION)
TABLE 10. SEAWEED PROTEIN MARKET FOR FOOD, BY COUNTRY, 2021-2030 ($MILLION)
TABLE 11. SEAWEED PROTEIN MARKET SIZE, FOR ANIMAL FEED AND ADDITIVES, BY REGION, 2021-2030 ($MILLION)
TABLE 12. SEAWEED PROTEIN MARKET FOR ANIMAL FEED AND ADDITIVES, BY COUNTRY, 2021-2030 ($MILLION)
TABLE 13. SEAWEED PROTEIN MARKET SIZE, FOR COSMETICS AND PERSONAL CARE, BY REGION, 2021-2030 ($MILLION)
TABLE 14. SEAWEED PROTEIN MARKET FOR COSMETICS AND PERSONAL CARE, BY COUNTRY, 2021-2030 ($MILLION)
TABLE 15. SEAWEED PROTEIN MARKET SIZE, FOR OTHERS, BY REGION, 2021-2030 ($MILLION)
TABLE 16. SEAWEED PROTEIN MARKET FOR OTHERS, BY COUNTRY, 2021-2030 ($MILLION)
TABLE 17. SEAWEED PROTEIN MARKET, BY REGION, 2021-2030 ($MILLION)
TABLE 18. NORTH AMERICA SEAWEED PROTEIN MARKET, BY SOURCE, 2021-2030 ($MILLION)
TABLE 19. NORTH AMERICA SEAWEED PROTEIN MARKET, BY APPLICATION, 2021-2030 ($MILLION)
TABLE 20. NORTH AMERICA SEAWEED PROTEIN MARKET, BY COUNTRY, 2021-2030 ($MILLION)
TABLE 21. U.S. SEAWEED PROTEIN MARKET, BY SOURCE, 2021-2030 ($MILLION)
TABLE 22. U.S. SEAWEED PROTEIN MARKET, BY APPLICATION, 2021-2030 ($MILLION)
TABLE 23. CANADA SEAWEED PROTEIN MARKET, BY SOURCE, 2021-2030 ($MILLION)
TABLE 24. CANADA SEAWEED PROTEIN MARKET, BY APPLICATION, 2021-2030 ($MILLION)
TABLE 25. MEXICO SEAWEED PROTEIN MARKET, BY SOURCE, 2021-2030 ($MILLION)
TABLE 26. MEXICO SEAWEED PROTEIN MARKET, BY APPLICATION, 2021-2030 ($MILLION)
TABLE 27. EUROPE SEAWEED PROTEIN MARKET, BY SOURCE, 2021-2030 ($MILLION)
TABLE 28. EUROPE SEAWEED PROTEIN MARKET, BY APPLICATION, 2021-2030 ($MILLION)
TABLE 29. EUROPE SEAWEED PROTEIN MARKET, BY COUNTRY, 2021-2030 ($MILLION)
TABLE 30. GERMANY SEAWEED PROTEIN MARKET, BY SOURCE, 2021-2030 ($MILLION)
TABLE 31. GERMANY SEAWEED PROTEIN MARKET, BY APPLICATION, 2021-2030 ($MILLION)
TABLE 32. UNITED KINGDOM SEAWEED PROTEIN MARKET, BY SOURCE, 2021-2030 ($MILLION)
TABLE 33. UNITED KINGDOM SEAWEED PROTEIN MARKET, BY APPLICATION, 2021-2030 ($MILLION)
TABLE 34. FRANCE SEAWEED PROTEIN MARKET, BY SOURCE, 2021-2030 ($MILLION)
TABLE 35. FRANCE SEAWEED PROTEIN MARKET, BY APPLICATION, 2021-2030 ($MILLION)
TABLE 36. SPAIN SEAWEED PROTEIN MARKET, BY SOURCE, 2021-2030 ($MILLION)
TABLE 37. SPAIN SEAWEED PROTEIN MARKET, BY APPLICATION, 2021-2030 ($MILLION)
TABLE 38. ITALY SEAWEED PROTEIN MARKET, BY SOURCE, 2021-2030 ($MILLION)
TABLE 39. ITALY SEAWEED PROTEIN MARKET, BY APPLICATION, 2021-2030 ($MILLION)
TABLE 40. REST OF EUROPE SEAWEED PROTEIN MARKET, BY SOURCE, 2021-2030 ($MILLION)
TABLE 41. REST OF EUROPE SEAWEED PROTEIN MARKET, BY APPLICATION, 2021-2030 ($MILLION)
TABLE 42. ASIA-PACIFIC SEAWEED PROTEIN MARKET, BY SOURCE, 2021-2030 ($MILLION)
TABLE 43. ASIA-PACIFIC SEAWEED PROTEIN MARKET, BY APPLICATION, 2021-2030 ($MILLION)
TABLE 44. ASIA-PACIFIC SEAWEED PROTEIN MARKET, BY COUNTRY, 2021-2030 ($MILLION)
TABLE 45. CHINA SEAWEED PROTEIN MARKET, BY SOURCE, 2021-2030 ($MILLION)
TABLE 46. CHINA SEAWEED PROTEIN MARKET, BY APPLICATION, 2021-2030 ($MILLION)
TABLE 47. JAPAN SEAWEED PROTEIN MARKET, BY SOURCE, 2021-2030 ($MILLION)
TABLE 48. JAPAN SEAWEED PROTEIN MARKET, BY APPLICATION, 2021-2030 ($MILLION)
TABLE 49. INDIA SEAWEED PROTEIN MARKET, BY SOURCE, 2021-2030 ($MILLION)
TABLE 50. INDIA SEAWEED PROTEIN MARKET, BY APPLICATION, 2021-2030 ($MILLION)
TABLE 51. SOUTH KOREA SEAWEED PROTEIN MARKET, BY SOURCE, 2021-2030 ($MILLION)
TABLE 52. SOUTH KOREA SEAWEED PROTEIN MARKET, BY APPLICATION, 2021-2030 ($MILLION)
TABLE 53. AUSTRALIA SEAWEED PROTEIN MARKET, BY SOURCE, 2021-2030 ($MILLION)
TABLE 54. AUSTRALIA SEAWEED PROTEIN MARKET, BY APPLICATION, 2021-2030 ($MILLION)
TABLE 55. REST OF ASIA-PACIFIC SEAWEED PROTEIN MARKET, BY SOURCE, 2021-2030 ($MILLION)
TABLE 56. REST OF ASIA-PACIFIC SEAWEED PROTEIN MARKET, BY APPLICATION, 2021-2030 ($MILLION)
TABLE 57. LAMEA SEAWEED PROTEIN MARKET, BY SOURCE, 2021-2030 ($MILLION)
TABLE 58. LAMEA SEAWEED PROTEIN MARKET, BY APPLICATION, 2021-2030 ($MILLION)
TABLE 59. LAMEA SEAWEED PROTEIN MARKET, BY COUNTRY, 2021-2030 ($MILLION)
TABLE 60. BRAZIL SEAWEED PROTEIN MARKET, BY SOURCE, 2021-2030 ($MILLION)
TABLE 61. BRAZIL SEAWEED PROTEIN MARKET, BY APPLICATION, 2021-2030 ($MILLION)
TABLE 62. SAUDI ARABIA SEAWEED PROTEIN MARKET, BY SOURCE, 2021-2030 ($MILLION)
TABLE 63. SAUDI ARABIA SEAWEED PROTEIN MARKET, BY APPLICATION, 2021-2030 ($MILLION)
TABLE 64. UNITED ARAB EMIRATES SEAWEED PROTEIN MARKET, BY SOURCE, 2021-2030 ($MILLION)
TABLE 65. UNITED ARAB EMIRATES SEAWEED PROTEIN MARKET, BY APPLICATION, 2021-2030 ($MILLION)
TABLE 66. SOUTH AFRICA SEAWEED PROTEIN MARKET, BY SOURCE, 2021-2030 ($MILLION)
TABLE 67. SOUTH AFRICA SEAWEED PROTEIN MARKET, BY APPLICATION, 2021-2030 ($MILLION)
TABLE 68. REST OF LAMEA SEAWEED PROTEIN MARKET, BY SOURCE, 2021-2030 ($MILLION)
TABLE 69. REST OF LAMEA SEAWEED PROTEIN MARKET, BY APPLICATION, 2021-2030 ($MILLION)
TABLE 70.CP KELCO: COMPANY SNAPSHOT
TABLE 71.CP KELCO: OPERATING SEGMENTS
TABLE 72.CP KELCO: PRODUCT PORTFOLIO
TABLE 73.CP KELCO: NET SALES,
TABLE 74.CP KELCO: KEY STRATERGIES
TABLE 75.CARGILL: COMPANY SNAPSHOT
TABLE 76.CARGILL: OPERATING SEGMENTS
TABLE 77.CARGILL: PRODUCT PORTFOLIO
TABLE 78.CARGILL: NET SALES,
TABLE 79.CARGILL: KEY STRATERGIES
TABLE 80.QINGDAO GATHER GREAT OCEAN ALGAE INDUSTRY GROUP CO LTD: COMPANY SNAPSHOT
TABLE 81.QINGDAO GATHER GREAT OCEAN ALGAE INDUSTRY GROUP CO LTD: OPERATING SEGMENTS
TABLE 82.QINGDAO GATHER GREAT OCEAN ALGAE INDUSTRY GROUP CO LTD: PRODUCT PORTFOLIO
TABLE 83.QINGDAO GATHER GREAT OCEAN ALGAE INDUSTRY GROUP CO LTD: NET SALES,
TABLE 84.QINGDAO GATHER GREAT OCEAN ALGAE INDUSTRY GROUP CO LTD: KEY STRATERGIES
TABLE 85.MARA SEAWEED: COMPANY SNAPSHOT
TABLE 86.MARA SEAWEED: OPERATING SEGMENTS
TABLE 87.MARA SEAWEED: PRODUCT PORTFOLIO
TABLE 88.MARA SEAWEED: NET SALES,
TABLE 89.MARA SEAWEED: KEY STRATERGIES
TABLE 90.ACADIAN SEAPLANTS: COMPANY SNAPSHOT
TABLE 91.ACADIAN SEAPLANTS: OPERATING SEGMENTS
TABLE 92.ACADIAN SEAPLANTS: PRODUCT PORTFOLIO
TABLE 93.ACADIAN SEAPLANTS: NET SALES,
TABLE 94.ACADIAN SEAPLANTS: KEY STRATERGIES
TABLE 95.IRISH SEAWEED: COMPANY SNAPSHOT
TABLE 96.IRISH SEAWEED: OPERATING SEGMENTS
TABLE 97.IRISH SEAWEED: PRODUCT PORTFOLIO
TABLE 98.IRISH SEAWEED: NET SALES,
TABLE 99.IRISH SEAWEED: KEY STRATERGIES
TABLE 100.ATSEANOVA: COMPANY SNAPSHOT
TABLE 101.ATSEANOVA: OPERATING SEGMENTS
TABLE 102.ATSEANOVA: PRODUCT PORTFOLIO
TABLE 103.ATSEANOVA: NET SALES,
TABLE 104.ATSEANOVA: KEY STRATERGIES
TABLE 105.ALGAIA: COMPANY SNAPSHOT
TABLE 106.ALGAIA: OPERATING SEGMENTS
TABLE 107.ALGAIA: PRODUCT PORTFOLIO
TABLE 108.ALGAIA: NET SALES,
TABLE 109.ALGAIA: KEY STRATERGIES
TABLE 110.SEASOL INTERNATIONAL PTY LTD: COMPANY SNAPSHOT
TABLE 111.SEASOL INTERNATIONAL PTY LTD: OPERATING SEGMENTS
TABLE 112.SEASOL INTERNATIONAL PTY LTD: PRODUCT PORTFOLIO
TABLE 113.SEASOL INTERNATIONAL PTY LTD: NET SALES,
TABLE 114.SEASOL INTERNATIONAL PTY LTD: KEY STRATERGIES
TABLE 115.MAINE COAST SEA VEGETABLES: COMPANY SNAPSHOT
TABLE 116.MAINE COAST SEA VEGETABLES: OPERATING SEGMENTS
TABLE 117.MAINE COAST SEA VEGETABLES: PRODUCT PORTFOLIO
TABLE 118.MAINE COAST SEA VEGETABLES: NET SALES,
TABLE 119.MAINE COAST SEA VEGETABLES: KEY STRATERGIES
LIST OF FIGURES
FIGURE 1.SEAWEED PROTEIN MARKET SEGMENTATION
FIGURE 2.SEAWEED PROTEIN MARKET,2021-2030
FIGURE 3.SEAWEED PROTEIN MARKET,2021-2030
FIGURE 4. TOP INVESTMENT POCKETS, BY REGION
FIGURE 5.PORTER FIVE-1
FIGURE 6.PORTER FIVE-2
FIGURE 7.PORTER FIVE-3
FIGURE 8.PORTER FIVE-4
FIGURE 9.PORTER FIVE-5
FIGURE 10.TOP PLAYER POSITIONING
FIGURE 11.SEAWEED PROTEIN MARKET:DRIVERS, RESTRAINTS AND OPPORTUNITIES
FIGURE 12.VALUE CHAIN ANALYSIS
FIGURE 13.MARKET SHARE ANALYSIS
FIGURE 14.KEY REGULATION ANALYSIS
FIGURE 15.PATENT ANALYSIS BY COMPANY
FIGURE 16.PATENT ANALYSIS BY COUNTRY
FIGURE 17.REGULATORY GUIDELINES
FIGURE 18.SEAWEED PROTEIN MARKET,BY SOURCE,2021(%)
FIGURE 19.COMPARATIVE SHARE ANALYSIS OF RED SEAWEED PROTEIN MARKET,2021-2030(%)
FIGURE 20.COMPARATIVE SHARE ANALYSIS OF BROWN SEAWEED PROTEIN MARKET,2021-2030(%)
FIGURE 21.COMPARATIVE SHARE ANALYSIS OF GREEN SEAWEED PROTEIN MARKET,2021-2030(%)
FIGURE 22.SEAWEED PROTEIN MARKET,BY APPLICATION,2021(%)
FIGURE 23.COMPARATIVE SHARE ANALYSIS OF FOOD SEAWEED PROTEIN MARKET,2021-2030(%)
FIGURE 24.COMPARATIVE SHARE ANALYSIS OF ANIMAL FEED AND ADDITIVES SEAWEED PROTEIN MARKET,2021-2030(%)
FIGURE 25.COMPARATIVE SHARE ANALYSIS OF COSMETICS AND PERSONAL CARE SEAWEED PROTEIN MARKET,2021-2030(%)
FIGURE 26.COMPARATIVE SHARE ANALYSIS OF OTHERS SEAWEED PROTEIN MARKET,2021-2030(%)
FIGURE 27.SEAWEED PROTEIN MARKET BY REGION,2021
FIGURE 28.U.S. SEAWEED PROTEIN MARKET,2021-2030($MILLION)
FIGURE 29.CANADA SEAWEED PROTEIN MARKET,2021-2030($MILLION)
FIGURE 30.MEXICO SEAWEED PROTEIN MARKET,2021-2030($MILLION)
FIGURE 31.GERMANY SEAWEED PROTEIN MARKET,2021-2030($MILLION)
FIGURE 32.UNITED KINGDOM SEAWEED PROTEIN MARKET,2021-2030($MILLION)
FIGURE 33.FRANCE SEAWEED PROTEIN MARKET,2021-2030($MILLION)
FIGURE 34.SPAIN SEAWEED PROTEIN MARKET,2021-2030($MILLION)
FIGURE 35.ITALY SEAWEED PROTEIN MARKET,2021-2030($MILLION)
FIGURE 36.REST OF EUROPE SEAWEED PROTEIN MARKET,2021-2030($MILLION)
FIGURE 37.CHINA SEAWEED PROTEIN MARKET,2021-2030($MILLION)
FIGURE 38.JAPAN SEAWEED PROTEIN MARKET,2021-2030($MILLION)
FIGURE 39.INDIA SEAWEED PROTEIN MARKET,2021-2030($MILLION)
FIGURE 40.SOUTH KOREA SEAWEED PROTEIN MARKET,2021-2030($MILLION)
FIGURE 41.AUSTRALIA SEAWEED PROTEIN MARKET,2021-2030($MILLION)
FIGURE 42.REST OF ASIA-PACIFIC SEAWEED PROTEIN MARKET,2021-2030($MILLION)
FIGURE 43.BRAZIL SEAWEED PROTEIN MARKET,2021-2030($MILLION)
FIGURE 44.SAUDI ARABIA SEAWEED PROTEIN MARKET,2021-2030($MILLION)
FIGURE 45.UNITED ARAB EMIRATES SEAWEED PROTEIN MARKET,2021-2030($MILLION)
FIGURE 46.SOUTH AFRICA SEAWEED PROTEIN MARKET,2021-2030($MILLION)
FIGURE 47.REST OF LAMEA SEAWEED PROTEIN MARKET,2021-2030($MILLION)
FIGURE 48. TOP WINNING STRATEGIES, BY YEAR
FIGURE 49. TOP WINNING STRATEGIES, BY DEVELOPMENT
FIGURE 50. TOP WINNING STRATEGIES, BY COMPANY
FIGURE 51.PRODUCT MAPPING OF TOP 10 PLAYERS
FIGURE 52.COMPETITIVE DASHBOARD
FIGURE 53.COMPETITIVE HEATMAP OF TOP 10 KEY PLAYERS
FIGURE 54.CP KELCO.: NET SALES ,($MILLION)
FIGURE 55.CARGILL.: NET SALES ,($MILLION)
FIGURE 56.QINGDAO GATHER GREAT OCEAN ALGAE INDUSTRY GROUP CO LTD.: NET SALES ,($MILLION)
FIGURE 57.MARA SEAWEED.: NET SALES ,($MILLION)
FIGURE 58.ACADIAN SEAPLANTS.: NET SALES ,($MILLION)
FIGURE 59.IRISH SEAWEED.: NET SALES ,($MILLION)
FIGURE 60.ATSEANOVA.: NET SALES ,($MILLION)
FIGURE 61.ALGAIA.: NET SALES ,($MILLION)
FIGURE 62.SEASOL INTERNATIONAL PTY LTD.: NET SALES ,($MILLION)
FIGURE 63.MAINE COAST SEA VEGETABLES.: NET SALES ,($MILLION)
$5769
$10995
HAVE A QUERY?
OUR CUSTOMER
