
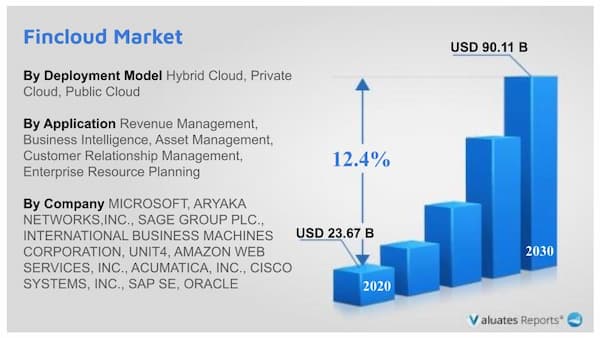
The global finance cloud market was valued at USD 23.67 Billion in 2020, and is projected to reach USD 90.11 Billion by 2030, growing at a CAGR of 12.4% from 2021 to 2030. Cloud is a network where programs run and can be accessed by many devices or servers at a time. It is a modern and a suite of powerful software options to manage the company’s finances. Moreover, it uses different finance management tools to prepare budgets, send out invoices, account all the expenses, approve purchase requests, and handle payments. The finance cloud software helps companies to keep real-time track of expenses, assets, sales, and purchases.
Rise in need for operational efficiency & transparency in business processes and surge in demand for cloud among financial companies act as the key driving forces of the global finance cloud market. In addition, the demand for cloud solutions among small & medium-sized enterprises continue to rise, as they offer various functional benefits such as eliminations of having regular upgrades, cost cutting, and business flexibility. These factors, as a result, notably contribute toward the growth of the global market. However, concerns associated with data security & protection and higher investment & maintenance costs are some of the factors that limit the finance cloud market growth.
On the contrary, developing economies offer significant opportunities for finance cloud companies to expand & develop their offerings, especially among the emerging economies such as India, Singapore, Australia, China, and South Korea. In addition, these countries are on the verge of development and lack in financial resources, therefore, need cost-efficient solutions is expected to offer remunerative opportunities for the expansion of the market. Moreover, banks, financial institutions, and other financing firms are rapidly switching toward digitalized business operations, thus, adoption & implementation of cloud has increased tremendously, which is anticipated to open new avenues for the market in the coming years.
The report focuses on growth prospects, restraints, and trends of the finance cloud market analysis. The study provides Porter’s five forces analysis to understand the impact of various factors such as bargaining power of suppliers, competitive intensity of competitors, threat of new entrants, threat of substitutes, and bargaining power of buyers on the finance cloud market.
The finance cloud market is segmented into component, enterprise size, deployment model, application, and region. By component, the market is bifurcated into solution and service. The solutions segment is further segmented into financial forecasting, financial reporting & analysis, security, governance, risk & compliance, and others. Based on Enterprise Size, the market is divided into large enterprises and small & medium enterprises (SMEs). Depending on deployment model, it is segregated into public cloud, private cloud, and hybrid cloud. The applications covered in the study include revenue management, business intelligence, asset management, customer relationship management, enterprise resource planning, and others. Region wise, the market is analyzed across North America, Europe, Asia-Pacific, and LAMEA.
The report analyses top finance cloud companies operating in the market such as Amazon Web Services, Inc., Acumatica, Inc., ARYAKA NETWORKS,INC., Cisco Systems, Inc., International Business Machines Corporation, Microsoft, Oracle, SAP SE, Unit4, and Sage Group plc. These players have adopted various strategies to increase their market penetration and strengthen their position in the finance cloud industry.
Top Impacting Factors
Rise in Need For Operational Efficiency & Transparency in Business Processes
Traditionally, most of the businesses invest time and effort in communicating business information and making decisions. Organizations aiming at becoming successful continuously seek for systems that will help them serve their clients and increase their profit margin. Presently, cloud solutions have become strategic platforms, providing a solid foundation and information backbone for financial companies. Several financial institutions are using a hybrid mix of public and private cloud for handling back-office functions and core business processes such as payments and credit risk management. Companies are adopting cloud solutions to improve efficiency and ensure a better information integration. Financial companies need to access all relevant information quickly to take a necessary business action, owing to increased competition and rapid changes in business environment. Cloud solutions therefore enhance efficiency and transparency in business operations, which, as a result is significantly fueling the market growth.
Higher Investment & Maintenance Costs
The initial investment to acquire and implement cloud system is substantial. The global software vendors such as Microsoft, SAP, Oracle, and IBM Corp. charge high cost for their solutions. In addition, these software vendors charge high fees for maintenance and support function. The total annual cost of maintaining and updating the cloud system includes internal cost (user training, salaries for IT, and project management), external costs (IT vendors and contractors), and maintenance & support fee paid annually to cloud vendors.
Moreover, software providers charge higher prices, which limits the adoption of cloud solutions, as financial companies are not ready to spend more on cloud. Furthermore, several financial companies are not showing willingness for upgrade and renewals due to high cost of these services, which significantly hampers the growth of the market.
Rise in Cloud Adoption in Developing Regions
The developing economies such as India, China, Brazil, and African economies exhibit high potential for the growth of the cloud computing services market. For instance, ITRS Group Ltd., which provides monitoring and analytics software, projected that by 2022, 86% of the financial services industry in Asia-Pacific are expected to adopt public cloud. These countries are on the verge of development and lack in financial resources, therefore, need cost-efficient solutions, thereby boosting the demand for cloud technology saving their IT expenditures. The struggle among financial companies in developing countries to gain a competitive edge is acting as a potential growth opportunity for the finance cloud market.
Key Players:
| Report Metric | Details |
| Report Name | Findcloud Market |
| Accounted market size in 2020 | US$ 23.67 Billion |
| Forecasted market size in 2030 | US$ 90.11 Billion |
| CAGR | 12.4% |
| Base Year | 2020 |
| Forecasted years | 2021 - 2030 |
| Segment by Component |
|
| Segment by Enterprise Size |
|
| Segment by Deployment Model |
|
| Segment by Application |
|
| By Region |
|
| By Company | MICROSOFT, ARYAKA NETWORKS,INC., SAGE GROUP PLC., INTERNATIONAL BUSINESS MACHINES CORPORATION, UNIT4, AMAZON WEB SERVICES, INC., ACUMATICA, INC., CISCO SYSTEMS, INC., SAP SE, ORACLE |
| Forecast units | USD million in value |
| Report coverage | Revenue and volume forecast, company share, competitive landscape, growth factors and trends |
Chapter 1 : INTRODUCTION
1.1.Report description
1.2.Key benefits for stakeholders
1.3.Key market segments
1.4.Research methodology
1.4.1.Secondary research
1.4.2.Primary research
1.4.3.Analyst tools and models
Chapter 2 : EXECUTIVE SUMMARY
2.1.Key findings
2.1.1.Top impacting factors
2.1.2.Top investment pockets
2.2.CXO perspective
Chapter 3 : MARKET OVERVIEW
3.1.Market definition and scope
3.2.Key forces shaping global finance cloud market
3.3.Case studies
3.3.1.Case study 01
3.3.2.Case study 02
3.4.Impact of government regulations on the global finance cloud market
3.5.Market dynamics
3.5.1.Drivers
3.5.1.1.Rapid adoption of cloud in SMEs
3.5.1.2.Rise in need for operational efficiency & transparency in business processes
3.5.1.3.Surge in demand for cloud among financial companies
3.5.2.Restraints
3.5.2.1.Concerns associated with data security & protection
3.5.2.2.Higher investment & maintenance costs
3.5.3.Opportunities
3.5.3.1.Rise in cloud adoption in developing regions
3.5.3.2.Technological advancement in cloud
3.6.COVID-19 impact analysis on finance cloud market
3.6.1.Impact on finance cloud market size
3.6.2.Change in organizations/firms’ trends, preferences, and budget impact due to COVID-19
3.6.3.Framework for market challenges faced by finance cloud providers
3.6.4.Economic impact on finance cloud providers
3.6.5.Key player strategies to tackle negative impact on the industry
3.6.6.Opportunity analysis for finance cloud providers
Chapter 4 : FINANCE CLOUD MARKET, BY COMPONENT
4.1.Overview
4.2.Solution
4.2.1.Key market trends, growth factors, and opportunities
4.2.2.Market size and forecast, by region
4.2.3.Market analysis, by country
4.2.4.Finance cloud solutions market, by application
4.2.4.1.Financial forecasting
4.2.4.1.1.Market size and forecast, by region
4.2.4.1.2.Market analysis, by country
4.2.4.2.Financial reporting & analysis
4.2.4.2.1.Market size and forecast, by region
4.2.4.2.2.Market analysis, by country
4.2.4.3.Security
4.2.4.3.1.Market size and forecast, by region
4.2.4.3.2.Market analysis, by country
4.2.4.4.Governance, risk, & compliance (eGRC)
4.2.4.4.1.Market size and forecast, by region
4.2.4.4.2.Market analysis, by country
4.2.4.4.2.1.Finance eGRC Solutions Market, by application
4.2.4.4.2.2.Policy management
4.2.4.4.2.3.Market size and forecast, by region
4.2.4.4.2.4.Market analysis, by country
4.2.4.4.2.5.Compliance management
4.2.4.4.2.6.Market size and forecast, by region
4.2.4.4.2.7.Market analysis, by country
4.2.4.4.2.8.Audit management
4.2.4.4.2.9.Market size and forecast, by region
4.2.4.4.2.10.Market analysis, by country
4.2.4.4.2.11.Incident & risk management
4.2.4.4.2.12.Market size and forecast, by region
4.2.4.4.2.13.Market analysis, by country
4.2.4.4.2.14.Others
4.2.4.4.2.15.Market size and forecast, by region
4.2.4.4.2.16.Market analysis, by country
4.2.4.5.Others
4.2.4.5.1.Market size and forecast, by region
4.2.4.5.2.Market analysis, by country
4.3.Service
4.3.1.Key market trends, growth factors, and opportunities
4.3.2.Market size and forecast, by region
4.3.3.Market analysis, by country
Chapter 5 : FINANCE CLOUD MARKET, BY DEPLOYMENT MODEL
5.1.Overview
5.2.Private
5.2.1.Key market trends, growth factors, and opportunities
5.2.2.Market size and forecast, by region
5.2.3.Market analysis, by country
5.3.Public
5.3.1.Key market trends, growth factors, and opportunities
5.3.2.Market size and forecast, by region
5.3.3.Market analysis, by country
5.4.Hybrid
5.4.1.Key market trends, growth factors, and opportunities
5.4.2.Market size and forecast, by region
5.4.3.Market analysis, by country
Chapter 6 : FINANCE CLOUD MARKET, BY ENTERPRISE SIZE
6.1.Overview
6.2.Large enterprises
6.2.1.Market size and forecast, by region
6.2.2.Market size and forecast, by region
6.2.3.Market analysis, by country
6.3.Small & medium enterprises (SMEs)
6.3.1.Market size and forecast, by region
6.3.2.Market size and forecast, by region
6.3.3.Market analysis, by country
Chapter 7 : FINANCE CLOUD MARKET, BY APPLICATION
7.1.Overview
7.2.Revenue management
7.2.1.Market size and forecast, by region
7.2.2.Market size and forecast, by region
7.2.3.Market analysis, by country
7.3.Business intelligence
7.3.1.Market size and forecast, by region
7.3.2.Market size and forecast, by region
7.3.3.Market analysis, by country
7.4.Asset management
7.4.1.Market size and forecast, by region
7.4.2.Market size and forecast, by region
7.4.3.Market analysis, by country
7.5.Customer relationship management
7.5.1.Market size and forecast, by region
7.5.2.Market size and forecast, by region
7.5.3.Market analysis, by country
7.6.Enterprise resource planning
7.6.1.Market size and forecast, by region
7.6.2.Market size and forecast, by region
7.6.3.Market analysis, by country
7.7.Others
7.7.1.Market size and forecast, by region
7.7.2.Market size and forecast, by region
7.7.3.Market analysis, by country
Chapter 8 FINANCE CLOUD MARKET, BY REGION
8.1.Overview
8.1.1.Market size and forecast
8.2.North America
8.2.1.Key market trends, growth factors, and opportunities
8.2.2.Market size and forecast, by component
8.2.3.Market size and forecast, for finance cloud solutions, by application
8.2.4.Market size and forecast for finance eGRC solutions, by application
8.2.5.Market size and forecast, by deployment model
8.2.6.Market size and forecast, by enterprise size
8.2.7.Market size and forecast, by application
8.2.8.Market analysis, by country
8.2.8.1.U.S.
8.2.8.1.1.Market size and forecast, by component
8.2.8.1.2.Market size and forecast, for finance cloud solutions, by application
8.2.8.1.3.Market size and forecast, for finance eGRC solutions, by application
8.2.8.1.4.Market size and forecast, by deployment model
8.2.8.1.5.Market size and forecast, by enterprise size
8.2.8.1.6.Market size and forecast, by application
8.2.8.2.Canada
8.2.8.2.1.Market size and forecast, by component
8.2.8.2.2.Market size and forecast, for finance cloud solutions, by application
8.2.8.2.3.Market size and forecast, for finance eGRC solutions, by application
8.2.8.2.4.Market size and forecast, by deployment model
8.2.8.2.5.Market size and forecast, by enterprise size
8.2.8.2.6.Market size and forecast, by application
8.3.Europe
8.3.1.Key market trends, growth factors, and opportunities
8.3.2.Market size and forecast, by component
8.3.3.Market size and forecast for finance cloud solutions, by application
8.3.4.Market size and forecast, for finance eGRC solutions, by application
8.3.5.Market size and forecast, by deployment model
8.3.6.Market size and forecast, by enterprise size
8.3.7.Market size and forecast, by application
8.3.8.Market analysis, by country
8.3.8.1.UK
8.3.8.1.1.Market size and forecast, by component
8.3.8.1.2.Market size and forecast, for finance cloud solutions, by application
8.3.8.1.3.Market size and forecast, for finance eGRC solutions, by application
8.3.8.1.4.Market size and forecast, by deployment model
8.3.8.1.5.Market size and forecast, by enterprise size
8.3.8.1.6.Market size and forecast, by application
8.3.8.2.Germany
8.3.8.2.1.Market size and forecast, by component
8.3.8.2.2.Market size and forecast, for finance cloud solutions, by application
8.3.8.2.3.Market size and forecast, for finance eGRC solutions, by application
8.3.8.2.4.Market size and forecast, by deployment model
8.3.8.2.5.Market size and forecast, by enterprise size
8.3.8.2.6.Market size and forecast, by application
8.3.8.3.France
8.3.8.3.1.Market size and forecast, by component
8.3.8.3.2.Market size and forecast, for finance cloud solutions, by application
8.3.8.3.3.Market size and forecast, for finance eGRC solutions, by application
8.3.8.3.4.Market size and forecast, by deployment model
8.3.8.3.5.Market size and forecast, by enterprise size
8.3.8.3.6.Market size and forecast, by application
8.3.8.4.Italy
8.3.8.4.1.Market size and forecast, by component
8.3.8.4.2.Market size and forecast, for finance cloud solutions, by application
8.3.8.4.3.Market size and forecast, for finance eGRC solutions, by application
8.3.8.4.4.Market size and forecast, by deployment model
8.3.8.4.5.Market size and forecast, by enterprise size
8.3.8.4.6.Market size and forecast, by application
8.3.8.5.Spain
8.3.8.5.1.Market size and forecast, by component
8.3.8.5.2.Market size and forecast, for finance cloud solutions, by application
8.3.8.5.3.Market size and forecast, for finance eGRC solutions, by application
8.3.8.5.4.Market size and forecast, by deployment model
8.3.8.5.5.Market size and forecast, by enterprise size
8.3.8.5.6.Market size and forecast, by application
8.3.8.6.The Netherlands
8.3.8.6.1.Market size and forecast, by component
8.3.8.6.2.Market size and forecast, for finance cloud solutions, by application
8.3.8.6.3.Market size and forecast, for finance eGRC solutions, by application
8.3.8.6.4.Market size and forecast, by deployment model
8.3.8.6.5.Market size and forecast, by enterprise size
8.3.8.6.6.Market size and forecast, by application
8.3.8.7.Rest of Europe
8.3.8.7.1.Market size and forecast, by component
8.3.8.7.2.Market size and forecast, for finance cloud solutions, by application
8.3.8.7.3.Market size and forecast, for finance eGRC solutions, by application
8.3.8.7.4.Market size and forecast, by deployment model
8.3.8.7.5.Market size and forecast, by enterprise size
8.3.8.7.6.Market size and forecast, by application
8.4.Asia-Pacific
8.4.1.Key market trends, growth factors, and opportunities
8.4.2.Market size and forecast, by component
8.4.3.Market size and forecast, for finance cloud solutions, by application
8.4.4.Market size and forecast, for finance eGRC solutions, by application
8.4.5.Market size and forecast, by deployment model
8.4.6.Market size and forecast, by enterprise size
8.4.7.Market size and forecast, by application
8.4.8.Market analysis, by country
8.4.8.1.China
8.4.8.1.1.Market size and forecast, by component
8.4.8.1.2.Market size and forecast, for finance cloud solutions, by application
8.4.8.1.3.Market size and forecast, for finance eGRC solutions, by application
8.4.8.1.4.Market size and forecast, by deployment model
8.4.8.1.5.Market size and forecast, by enterprise size
8.4.8.1.6.Market size and forecast, by application
8.4.8.2.Japan
8.4.8.2.1.Market size and forecast, by component
8.4.8.2.2.Market size and forecast, for finance cloud solutions, by application
8.4.8.2.3.Market size and forecast, for finance eGRC solutions, by application
8.4.8.2.4.Market size and forecast, by deployment model
8.4.8.2.5.Market size and forecast, by enterprise size
8.4.8.2.6.Market size and forecast, by application
8.4.8.3.India
8.4.8.3.1.Market size and forecast, by component
8.4.8.3.2.Market size and forecast, for finance cloud solutions, by application
8.4.8.3.3.Market size and forecast, for finance eGRC solutions, by application
8.4.8.3.4.Market size and forecast, by deployment model
8.4.8.3.5.Market size and forecast, by enterprise size
8.4.8.3.6.Market size and forecast, by application
8.4.8.4.Australia
8.4.8.4.1.Market size and forecast, by component
8.4.8.4.2.Market size and forecast, for finance cloud solutions, by application
8.4.8.4.3.Market size and forecast, for finance eGRC solutions, by application
8.4.8.4.4.Market size and forecast, by deployment model
8.4.8.4.5.Market size and forecast, by enterprise size
8.4.8.4.6.Market size and forecast, by application
8.4.8.5.South Korea
8.4.8.5.1.Market size and forecast, by component
8.4.8.5.2.Market size and forecast, for finance cloud solutions, by application
8.4.8.5.3.Market size and forecast, for finance eGRC solutions, by application
8.4.8.5.4.Market size and forecast, by deployment model
8.4.8.5.5.Market size and forecast, by enterprise size
8.4.8.5.6.Market size and forecast, by application
8.4.8.6.Singapore
8.4.8.6.1.Market size and forecast, by component
8.4.8.6.2.Market size and forecast, for finance cloud solutions, by application
8.4.8.6.3.Market size and forecast, for finance eGRC solutions, by application
8.4.8.6.4.Market size and forecast, by deployment model
8.4.8.6.5.Market size and forecast, by enterprise size
8.4.8.6.6.Market size and forecast, by application
8.4.8.7.Rest of Asia-Pacific
8.4.8.7.1.Market size and forecast, by component
8.4.8.7.2.Market size and forecast, for finance cloud solutions, by application
8.4.8.7.3.Market size and forecast, for finance eGRC solutions, by application
8.4.8.7.4.Market size and forecast, by deployment model
8.4.8.7.5.Market size and forecast, by enterprise size
8.4.8.7.6.Market size and forecast, by application
8.5.LAMEA
8.5.1.Key market trends, growth factors, and opportunities
8.5.2.Market size and forecast, by component
8.5.3.Market size and forecast, for finance cloud solutions, by application
8.5.4.Market size and forecast, for finance eGRC solutions, by application
8.5.5.Market size and forecast, by deployment model
8.5.6.Market size and forecast, by enterprise size
8.5.7.Market size and forecast, by application
8.5.8.Market analysis, by country
8.5.8.1.Latin America
8.5.8.1.1.Market size and forecast, by component
8.5.8.1.2.Market size and forecast, for finance cloud solutions, by application
8.5.8.1.3.Market size and forecast, for finance eGRC solutions, by application
8.5.8.1.4.Market size and forecast, by deployment model
8.5.8.1.5.Market size and forecast, by enterprise size
8.5.8.1.6.Market size and forecast, by application
8.5.8.2.Middle East
8.5.8.2.1.Market size and forecast, by component
8.5.8.2.2.Market size and forecast, for finance cloud solutions, by application
8.5.8.2.3.Market size and forecast, for finance eGRC solutions, by application
8.5.8.2.4.Market size and forecast, by deployment model
8.5.8.2.5.Market size and forecast, by enterprise size
8.5.8.2.6.Market size and forecast, by application
8.5.8.3.Africa
8.5.8.3.1.Market size and forecast, by component
8.5.8.3.2.Market size and forecast, for finance cloud solutions, by application
8.5.8.3.3.Market size and forecast, for finance eGRC solutions, by application
8.5.8.3.4.Market size and forecast, by deployment model
8.5.8.3.5.Market size and forecast, by enterprise size
8.5.8.3.6.Market size and forecast, by application
Chapter 9 : COMPETITIVE LANDSCAPE
9.1.Introduction
9.1.1.Market player positioning, 2020
9.2.Competitive dashboard
9.2.1.Top winning strategies
Chapter 10 : COMPANY PROFILES
10.1.AMAZON WEB SERVICES, INC.
10.1.1.Company overview
10.1.2.Company snapshot
10.1.3.Operating business segments
10.1.4.Product portfolio
10.1.5.Business performance
10.1.6.Key strategic moves and developments
10.2.ACUMATICA, INC.
10.2.1.Company overview
10.2.2.Company snapshot
10.2.3.Product portfolio
10.2.4.Key strategic moves and developments
10.3.ARYAKA NETWORKS,INC.
10.3.1.Company overview
10.3.2.Company snapshot
10.3.3.Product portfolio
10.4.CISCO SYSTEMS, INC.
10.4.1.Company overview
10.4.2.Company snapshot
10.4.3.Operating business segments
10.4.4.Product portfolio
10.4.5.Business performance
10.5.INTERNATIONAL BUSINESS MACHINES CORPORATION
10.5.1.Company overview
10.5.2.Company snapshot
10.5.3.Operating business segments
10.5.4.Product portfolio
10.5.5.Business performance
10.5.6.Key strategic moves and developments
10.6.MICROSOFT
10.6.1.Company overview
10.6.2.Company snapshot
10.6.3.Operating business segments
10.6.4.Product portfolio
10.6.5.Business performance
10.6.6.Key strategic moves and developments
10.7.ORACLE
10.7.1.Company overview
10.7.2.Company snapshot
10.7.3.Operating business segments
10.7.4.Product portfolio
10.7.5.Business performance
10.7.6.Key strategic moves and developments
10.8.SAP SE
10.8.1.Company overview
10.8.2.Company snapshot
10.8.3.Operating business segments
10.8.4.Product portfolio
10.8.5.Business performance
10.8.6.Key strategic moves and developments
10.9.UNIT4
10.9.1.Company overview
10.9.2.Company snapshot
10.9.3.Product portfolio
10.10.SAGE GROUP PLC.
10.10.1.Company overview
10.10.2.Company snapshot
10.10.3.Product portfolio
10.10.4.Business performance
List of Tables
TABLE 01.GLOBAL FINANCE CLOUD MARKET, BY COMPONENT, 2020-2030 ($MILLION)
TABLE 02.FINANCE CLOUD MARKET REVENUE FOR SOLUTION, BY REGION, 2020-2030 ($MILLION)
TABLE 03.FINANCE CLOUD SOLUTIONS MARKET, BY APPLICATION, 2020-2030 ($MILLION)
TABLE 04.FINANCE CLOUD SOLUTIONS MARKET FOR FINANCIAL FORECASTING, BY REGION, 2020–2030 ($MILLION)
TABLE 05.FINANCE CLOUD SOLUTIONS MARKET FOR FINANCIAL REPORTING & ANALYSIS, BY REGION, 2020–2030 ($MILLION)
TABLE 06.FINANCE CLOUD SOLUTIONS MARKET FOR SECURITY, BY REGION, 2020–2030 ($MILLION)
TABLE 07.FINANCE CLOUD SOLUTIONS MARKET FOR GOVERNANCE, RISK, & COMPLIANCE (EGRC), BY REGION, 2020–2030 ($MILLION)
TABLE 08.FINANCE EGRC SOLUTIONS MARKET, BY APPLICATION, 2020-2030 ($MILLION)
TABLE 09.FINANCE EGRC SOLUTIONS MARKET FOR POLICY MANAGEMENT, BY REGION, 2020–2030 ($MILLION)
TABLE 10.FINANCE EGRC SOLUTIONS MARKET FOR COMPLIANCE MANAGEMENT, BY REGION, 2020–2030 ($MILLION)
TABLE 11.FINANCE EGRC SOLUTIONS MARKET FOR AUDIT MANAGEMENT, BY REGION, 2020–2030 ($MILLION)
TABLE 12.FINANCE EGRC SOLUTIONS MARKET FOR INCIDENT & RISK MANAGEMENT, BY REGION, 2020–2030 ($MILLION)
TABLE 13.FINANCE EGRC SOLUTIONS MARKET FOR OTHERS, BY REGION, 2020–2030 ($MILLION)
TABLE 14.FINANCE CLOUD SOLUTIONS MARKET FOR OTHERS, BY REGION, 2020–2030 ($MILLION)
TABLE 15.FINANCE CLOUD MARKET FOR SERVICE, BY REGION, 2020-2030 ($MILLION)
TABLE 16.GLOBAL FINANCE CLOUD MARKET, BY DEPLOYMENT MODEL, 2020-2030 ($MILLION)
TABLE 17.FINANCE CLOUD MARKET REVENUE FOR PRIVATE, BY REGION, 2020-2030 ($MILLION)
TABLE 18.FINANCE CLOUD MARKET FOR PUBLIC, BY REGION, 2020-2030 ($MILLION)
TABLE 19.FINANCE CLOUD MARKET FOR HYBRID, BY REGION, 2020-2030 ($MILLION)
TABLE 20.GLOBAL FINANCE CLOUD MARKET REVENUE, BY ENTERPRISE SIZE, 2020-2030 ($MILLION)
TABLE 21.FINANCE CLOUD MARKET FOR LARGE ENTERPRISES, BY REGION, 2020-2030 ($MILLION)
TABLE 22.FINANCE CLOUD MARKET FOR SMALL & MEDIUM ENTERPRISES (SMES), BY REGION, 2020-2030 ($MILLION)
TABLE 23.GLOBAL FINANCE CLOUD MARKET REVENUE, BY APPLICATION, 2020-2030 ($MILLION)
TABLE 24.FINANCE CLOUD MARKET FOR REVENUE MANAGEMENT, BY REGION, 2020-2030 ($MILLION)
TABLE 25.FINANCE CLOUD MARKET FOR BUSINESS INTELLIGENCE, BY REGION, 2020-2030 ($MILLION)
TABLE 26.FINANCE CLOUD MARKET FOR ASSET MANAGEMENT, BY REGION, 2020-2030 ($MILLION)
TABLE 27.FINANCE CLOUD MARKET FOR CUSTOMER RELATIONSHIP MANAGEMENT, BY REGION, 2020-2030 ($MILLION)
TABLE 28.FINANCE CLOUD MARKET FOR ENTERPRISE RESOURCE PLANNING, BY REGION, 2020-2030 ($MILLION)
TABLE 29.FINANCE CLOUD MARKET FOR OTHERS, BY REGION, 2020-2030 ($MILLION)
TABLE 30.FINANCE CLOUD MARKET, BY REGION, 2020-2030 ($MILLION)
TABLE 31.NORTH AMERICA FINANCE CLOUD MARKET REVENUE, BY COMPONENT, 2020–2030 ($MILLION)
TABLE 32.NORTH AMERICA FINANCE CLOUD SOLUTIONS MARKET, BY APPLICATION, 2020–2030 ($MILLION)
TABLE 33.NORTH AMERICA FINANCE EGRC SOLUTIONS MARKET, BY APPLICATION, 2020–2030 ($MILLION)
TABLE 34.NORTH AMERICA FINANCE CLOUD MARKET REVENUE, BY DEPLOYMENT MODEL, 2020–2030 ($MILLION)
TABLE 35.NORTH AMERICA FINANCE CLOUD MARKET REVENUE, BY ENTERPRISE SIZE, 2020–2030 ($MILLION)
TABLE 36.NORTH AMERICA FINANCE CLOUD MARKET REVENUE, BY APPLICATION, 2020–2030 ($MILLION)
TABLE 37.NORTH AMERICA FINANCE CLOUD MARKET REVENUE, BY COUNTRY, 2020–2030 ($MILLION)
TABLE 38.U.S. FINANCE CLOUD MARKET REVENUE, BY COMPONENT, 2020–2030 ($MILLION)
TABLE 39.U.S. FINANCE CLOUD SOLUTIONS MARKET, BY APPLICATION, 2020–2030 ($MILLION)
TABLE 40.U.S. FINANCE EGRC SOLUTIONS MARKET, BY APPLICATION, 2020–2030 ($MILLION)
TABLE 41.U.S. FINANCE CLOUD MARKET REVENUE, BY DEPLOYMENT MODEL, 2020–2030 ($MILLION)
TABLE 42.U.S. FINANCE CLOUD MARKET REVENUE, BY ENTERPRISE SIZE, 2020–2030 ($MILLION)
TABLE 43.U.S. FINANCE CLOUD MARKET REVENUE, BY APPLICATION, 2020–2030 ($MILLION)
TABLE 44.CANADA FINANCE CLOUD MARKET REVENUE, BY COMPONENT, 2020–2030 ($MILLION)
TABLE 45.CANADA FINANCE CLOUD SOLUTIONS MARKET, BY APPLICATION, 2020–2030 ($MILLION)
TABLE 46.CANADA FINANCE EGRC SOLUTIONS MARKET, BY APPLICATION, 2020–2030 ($MILLION)
TABLE 47.CANADA FINANCE CLOUD MARKET REVENUE, BY DEPLOYMENT MODEL, 2020–2030 ($MILLION)
TABLE 48.CANADA FINANCE CLOUD MARKET REVENUE, BY ENTERPRISE SIZE, 2020–2030 ($MILLION)
TABLE 49.CANADA FINANCE CLOUD MARKET REVENUE, BY APPLICATION, 2020–2030 ($MILLION)
TABLE 50.EUROPE FINANCE CLOUD MARKET REVENUE, BY COMPONENT, 2020–2030 ($MILLION)
TABLE 51.EUROPE FINANCE CLOUD SOLUTIONS MARKET, BY APPLICATION, 2020–2030 ($MILLION)
TABLE 52.EUROPE FINANCE EGRC SOLUTIONS MARKET, BY APPLICATION, 2020–2030 ($MILLION)
TABLE 53.EUROPE FINANCE CLOUD MARKET REVENUE, BY DEPLOYMENT MODEL, 2020–2030 ($MILLION)
TABLE 54.EUROPE FINANCE CLOUD MARKET REVENUE, BY ENTERPRISE SIZE, 2020–2030 ($MILLION)
TABLE 55.EUROPE FINANCE CLOUD MARKET REVENUE, BY APPLICATION, 2020–2030 ($MILLION)
TABLE 56.EUROPE FINANCE CLOUD MARKET REVENUE, BY COUNTRY, 2020–2030 ($MILLION)
TABLE 57.UK FINANCE CLOUD MARKET REVENUE, BY COMPONENT, 2020–2030 ($MILLION)
TABLE 58.UK FINANCE CLOUD SOLUTIONS MARKET, BY APPLICATION, 2020–2030 ($MILLION)
TABLE 59.UK FINANCE EGRC SOLUTIONS MARKET, BY APPLICATION, 2020–2030 ($MILLION)
TABLE 60.UK FINANCE CLOUD MARKET REVENUE, BY DEPLOYMENT MODEL, 2020–2030 ($MILLION)
TABLE 61.UK FINANCE CLOUD MARKET REVENUE, BY ENTERPRISE SIZE, 2020–2030 ($MILLION)
TABLE 62.UK FINANCE CLOUD MARKET REVENUE, BY APPLICATION, 2020–2030 ($MILLION)
TABLE 63.GERMANY FINANCE CLOUD MARKET REVENUE, BY COMPONENT, 2020–2030 ($MILLION)
TABLE 64.GERMANY FINANCE CLOUD SOLUTIONS MARKET, BY APPLICATION, 2020–2030 ($MILLION)
TABLE 65.GERMANY FINANCE EGRC SOLUTIONS MARKET, BY APPLICATION, 2020–2030 ($MILLION)
TABLE 66.GERMANY FINANCE CLOUD MARKET REVENUE, BY DEPLOYMENT MODEL, 2020–2030 ($MILLION)
TABLE 67.GERMANY FINANCE CLOUD MARKET REVENUE, BY ENTERPRISE SIZE, 2020–2030 ($MILLION)
TABLE 68.GERMANY FINANCE CLOUD MARKET REVENUE, BY APPLICATION, 2020–2030 ($MILLION)
TABLE 69.FRANCE FINANCE CLOUD MARKET REVENUE, BY COMPONENT, 2020–2030 ($MILLION)
TABLE 70.FRANCE FINANCE CLOUD SOLUTIONS MARKET, BY APPLICATION, 2020–2030 ($MILLION)
TABLE 71.FRANCE FINANCE EGRC SOLUTIONS MARKET, BY APPLICATION, 2020–2030 ($MILLION)
TABLE 72.FRANCE FINANCE CLOUD MARKET REVENUE, BY DEPLOYMENT MODEL, 2020–2030 ($MILLION)
TABLE 73.FRANCE FINANCE CLOUD MARKET REVENUE, BY ENTERPRISE SIZE, 2020–2030 ($MILLION)
TABLE 74.FRANCE FINANCE CLOUD MARKET REVENUE, BY APPLICATION, 2020–2030 ($MILLION)
TABLE 75.ITALY FINANCE CLOUD MARKET REVENUE, BY COMPONENT, 2020–2030 ($MILLION)
TABLE 76.ITALY FINANCE CLOUD SOLUTIONS MARKET, BY APPLICATION, 2020–2030 ($MILLION)
TABLE 77.ITALY FINANCE EGRC SOLUTIONS MARKET, BY APPLICATION, 2020–2030 ($MILLION)
TABLE 78.ITALY FINANCE CLOUD MARKET REVENUE, BY DEPLOYMENT MODEL, 2020–2030 ($MILLION)
TABLE 79.ITALY FINANCE CLOUD MARKET REVENUE, BY ENTERPRISE SIZE, 2020–2030 ($MILLION)
TABLE 80.ITALY FINANCE CLOUD MARKET REVENUE, BY APPLICATION, 2020–2030 ($MILLION)
TABLE 81.SPAIN FINANCE CLOUD MARKET REVENUE, BY COMPONENT, 2020–2030 ($MILLION)
TABLE 82.SPAIN FINANCE CLOUD SOLUTIONS MARKET, BY APPLICATION, 2020–2030 ($MILLION)
TABLE 83.SPAIN FINANCE EGRC SOLUTIONS MARKET, BY APPLICATION, 2020–2030 ($MILLION)
TABLE 84.SPAIN FINANCE CLOUD MARKET REVENUE, BY DEPLOYMENT MODEL, 2020–2030 ($MILLION)
TABLE 85.SPAIN FINANCE CLOUD MARKET REVENUE, BY ENTERPRISE SIZE, 2020–2030 ($MILLION)
TABLE 86.SPAIN FINANCE CLOUD MARKET REVENUE, BY APPLICATION, 2020–2030 ($MILLION)
TABLE 87.THE NETHERLANDS FINANCE CLOUD MARKET REVENUE, BY COMPONENT, 2020–2030 ($MILLION)
TABLE 88.THE NETHERLANDS FINANCE CLOUD SOLUTIONS MARKET, BY APPLICATION, 2020–2030 ($MILLION)
TABLE 89.THE NETHERLANDS FINANCE EGRC SOLUTIONS MARKET, BY APPLICATION, 2020–2030 ($MILLION)
TABLE 90.THE NETHERLANDS FINANCE CLOUD MARKET REVENUE, BY DEPLOYMENT MODEL, 2020–2030 ($MILLION)
TABLE 91.THE NETHERLANDS FINANCE CLOUD MARKET REVENUE, BY ENTERPRISE SIZE, 2020–2030 ($MILLION)
TABLE 92.THE NETHERLANDS FINANCE CLOUD MARKET REVENUE, BY APPLICATION, 2020–2030 ($MILLION)
TABLE 93.REST OF EUROPE FINANCE CLOUD MARKET REVENUE, BY COMPONENT, 2020–2030 ($MILLION)
TABLE 94.REST OF EUROPE FINANCE CLOUD SOLUTIONS MARKET, BY APPLICATION, 2020–2030 ($MILLION)
TABLE 95.REST OF EUROPE FINANCE EGRC SOLUTIONS MARKET, BY APPLICATION, 2020–2030 ($MILLION)
TABLE 96.REST OF EUROPE FINANCE CLOUD MARKET REVENUE, BY DEPLOYMENT MODEL, 2020–2030 ($MILLION)
TABLE 97.REST OF EUROPE FINANCE CLOUD MARKET REVENUE, BY ENTERPRISE SIZE, 2020–2030 ($MILLION)
TABLE 98.REST OF EUROPE FINANCE CLOUD MARKET REVENUE, BY APPLICATION, 2020–2030 ($MILLION)
TABLE 99.ASIA-PACIFIC FINANCE CLOUD MARKET REVENUE, BY COMPONENT, 2020–2030 ($MILLION)
TABLE 100.ASIA-PACIFIC FINANCE CLOUD SOLUTIONS MARKET, BY APPLICATION, 2020–2030 ($MILLION)
TABLE 101.ASIA-PACIFIC FINANCE EGRC SOLUTIONS MARKET, BY APPLICATION, 2020–2030 ($MILLION)
TABLE 102.ASIA-PACIFIC FINANCE CLOUD MARKET REVENUE, BY DEPLOYMENT MODEL, 2020–2030 ($MILLION)
TABLE 103.ASIA-PACIFIC FINANCE CLOUD MARKET REVENUE, BY ENTERPRISE SIZE, 2020–2030 ($MILLION)
TABLE 104.ASIA-PACIFIC FINANCE CLOUD MARKET REVENUE, BY APPLICATION, 2020–2030 ($MILLION)
TABLE 105.ASIA-PACIFIC FINANCE CLOUD MARKET REVENUE, BY COUNTRY, 2020–2030 ($MILLION)
TABLE 106.CHINA FINANCE CLOUD MARKET REVENUE, BY COMPONENT, 2020–2030 ($MILLION)
TABLE 107.CHINA FINANCE CLOUD SOLUTIONS MARKET, BY APPLICATION, 2020–2030 ($MILLION)
TABLE 108.CHINA FINANCE EGRC SOLUTIONS MARKET, BY APPLICATION, 2020–2030 ($MILLION)
TABLE 109.CHINA FINANCE CLOUD MARKET REVENUE, BY DEPLOYMENT MODEL, 2020–2030 ($MILLION)
TABLE 110.CHINA FINANCE CLOUD MARKET REVENUE, BY ENTERPRISE SIZE, 2020–2030 ($MILLION)
TABLE 111.CHINA FINANCE CLOUD MARKET REVENUE, BY APPLICATION, 2020–2030 ($MILLION)
TABLE 112.JAPAN FINANCE CLOUD MARKET REVENUE, BY COMPONENT, 2020–2030 ($MILLION)
TABLE 113.JAPAN FINANCE CLOUD SOLUTIONS MARKET, BY APPLICATION, 2020–2030 ($MILLION)
TABLE 114.JAPAN FINANCE EGRC SOLUTIONS MARKET, BY APPLICATION, 2020–2030 ($MILLION)
TABLE 115.JAPAN FINANCE CLOUD MARKET REVENUE, BY DEPLOYMENT MODEL, 2020–2030 ($MILLION)
TABLE 116.JAPAN FINANCE CLOUD MARKET REVENUE, BY ENTERPRISE SIZE, 2020–2030 ($MILLION)
TABLE 117.JAPAN FINANCE CLOUD MARKET REVENUE, BY APPLICATION, 2020–2030 ($MILLION)
TABLE 118.INDIA FINANCE CLOUD MARKET REVENUE, BY COMPONENT, 2020–2030 ($MILLION)
TABLE 119.INDIA FINANCE CLOUD SOLUTIONS MARKET, BY APPLICATION, 2020–2030 ($MILLION)
TABLE 120.INDIA FINANCE EGRC SOLUTIONS MARKET, BY APPLICATION, 2020–2030 ($MILLION)
TABLE 121.INDIA FINANCE CLOUD MARKET REVENUE, BY DEPLOYMENT MODEL, 2020–2030 ($MILLION)
TABLE 122.INDIA FINANCE CLOUD MARKET REVENUE, BY ENTERPRISE SIZE, 2020–2030 ($MILLION)
TABLE 123.INDIA FINANCE CLOUD MARKET REVENUE, BY APPLICATION, 2020–2030 ($MILLION)
TABLE 124.AUSTRALIA FINANCE CLOUD MARKET REVENUE, BY COMPONENT, 2020–2030 ($MILLION)
TABLE 125.AUSTRALIA FINANCE CLOUD SOLUTIONS MARKET, BY APPLICATION, 2020–2030 ($MILLION)
TABLE 126.AUSTRALIA FINANCE EGRC SOLUTIONS MARKET, BY APPLICATION, 2020–2030 ($MILLION)
TABLE 127.AUSTRALIA FINANCE CLOUD MARKET REVENUE, BY DEPLOYMENT MODEL, 2020–2030 ($MILLION)
TABLE 128.AUSTRALIA FINANCE CLOUD MARKET REVENUE, BY ENTERPRISE SIZE, 2020–2030 ($MILLION)
TABLE 129.AUSTRALIA FINANCE CLOUD MARKET REVENUE, BY APPLICATION, 2020–2030 ($MILLION)
TABLE 130.SOUTH KOREA FINANCE CLOUD MARKET REVENUE, BY COMPONENT, 2020–2030 ($MILLION)
TABLE 131.SOUTH KOREA FINANCE CLOUD SOLUTIONS MARKET, BY APPLICATION, 2020–2030 ($MILLION)
TABLE 132.SOUTH KOREA FINANCE EGRC SOLUTIONS MARKET, BY APPLICATION, 2020–2030 ($MILLION)
TABLE 133.SOUTH KOREA FINANCE CLOUD MARKET REVENUE, BY DEPLOYMENT MODEL, 2020–2030 ($MILLION)
TABLE 134.SOUTH KOREA FINANCE CLOUD MARKET REVENUE, BY ENTERPRISE SIZE, 2020–2030 ($MILLION)
TABLE 135.SOUTH KOREA FINANCE CLOUD MARKET REVENUE, BY APPLICATION, 2020–2030 ($MILLION)
TABLE 136.SINGAPORE FINANCE CLOUD MARKET REVENUE, BY COMPONENT, 2020–2030 ($MILLION)
TABLE 137.SINGAPORE FINANCE CLOUD SOLUTIONS MARKET, BY APPLICATION, 2020–2030 ($MILLION)
TABLE 138.SINGAPORE FINANCE EGRC SOLUTIONS MARKET, BY APPLICATION, 2020–2030 ($MILLION)
TABLE 139.SINGAPORE FINANCE CLOUD MARKET REVENUE, BY DEPLOYMENT MODEL, 2020–2030 ($MILLION)
TABLE 140.SINGAPORE FINANCE CLOUD MARKET REVENUE, BY ENTERPRISE SIZE, 2020–2030 ($MILLION)
TABLE 141.SINGAPORE FINANCE CLOUD MARKET REVENUE, BY APPLICATION, 2020–2030 ($MILLION)
TABLE 142.REST OF ASIA-PACIFIC FINANCE CLOUD MARKET REVENUE, BY COMPONENT, 2020–2030 ($MILLION)
TABLE 143.REST OF ASIA-PACIFIC FINANCE CLOUD SOLUTIONS MARKET, BY APPLICATION, 2020–2030 ($MILLION)
TABLE 144.REST OF ASIA-PACIFIC FINANCE EGRC SOLUTIONS MARKET, BY APPLICATION, 2020–2030 ($MILLION)
TABLE 145.REST OF ASIA-PACIFIC FINANCE CLOUD MARKET REVENUE, BY DEPLOYMENT MODEL, 2020–2030 ($MILLION)
TABLE 146.REST OF ASIA-PACIFIC FINANCE CLOUD MARKET REVENUE, BY ENTERPRISE SIZE, 2020–2030 ($MILLION)
TABLE 147.REST OF ASIA-PACIFIC FINANCE CLOUD MARKET REVENUE, BY APPLICATION, 2020–2030 ($MILLION)
TABLE 148.LAMEA FINANCE CLOUD MARKET REVENUE, BY COMPONENT, 2020–2030 ($MILLION)
TABLE 149.LAMEA FINANCE CLOUD SOLUTIONS MARKET, BY APPLICATION, 2020–2030 ($MILLION)
TABLE 150.LAMEA FINANCE EGRC SOLUTIONS MARKET, BY APPLICATION, 2020–2030 ($MILLION)
TABLE 151.LAMEA FINANCE CLOUD MARKET REVENUE, BY DEPLOYMENT MODEL, 2020–2030 ($MILLION)
TABLE 152.LAMEA FINANCE CLOUD MARKET REVENUE, BY ENTERPRISE SIZE, 2020–2030 ($MILLION)
TABLE 153.LAMEA FINANCE CLOUD MARKET REVENUE, BY APPLICATION, 2020–2030 ($MILLION)
TABLE 154.LAMEA FINANCE CLOUD MARKET REVENUE, BY COUNTRY, 2020–2030 ($MILLION)
TABLE 155.LATIN AMERICA FINANCE CLOUD MARKET REVENUE, BY COMPONENT, 2020–2030 ($MILLION)
TABLE 156.LATIN AMERICA FINANCE CLOUD SOLUTIONS MARKET, BY APPLICATION, 2020–2030 ($MILLION)
TABLE 157.LATIN AMERICA FINANCE EGRC SOLUTIONS MARKET, BY APPLICATION, 2020–2030 ($MILLION)
TABLE 158.LATIN AMERICA FINANCE CLOUD MARKET REVENUE, BY DEPLOYMENT MODEL, 2020–2030 ($MILLION)
TABLE 159.LATIN AMERICA FINANCE CLOUD MARKET REVENUE, BY ENTERPRISE SIZE, 2020–2030 ($MILLION)
TABLE 160.LATIN AMERICA FINANCE CLOUD MARKET REVENUE, BY APPLICATION, 2020–2030 ($MILLION)
TABLE 161.MIDDLE EAST FINANCE CLOUD MARKET REVENUE, BY COMPONENT, 2020–2030 ($MILLION)
TABLE 162.MIDDLE EAST FINANCE CLOUD SOLUTIONS MARKET, BY APPLICATION, 2020–2030 ($MILLION)
TABLE 163.MIDDLE EAST FINANCE EGRC SOLUTIONS MARKET, BY APPLICATION, 2020–2030 ($MILLION)
TABLE 164.MIDDLE EAST FINANCE CLOUD MARKET REVENUE, BY DEPLOYMENT MODEL, 2020–2030 ($MILLION)
TABLE 165.MIDDLE EAST FINANCE CLOUD MARKET REVENUE, BY ENTERPRISE SIZE, 2020–2030 ($MILLION)
TABLE 166.MIDDLE EAST FINANCE CLOUD MARKET REVENUE, BY APPLICATION, 2020–2030 ($MILLION)
TABLE 167.AFRICA FINANCE CLOUD MARKET REVENUE, BY COMPONENT, 2020–2030 ($MILLION)
TABLE 168.AFRICA FINANCE CLOUD SOLUTIONS MARKET, BY APPLICATION, 2020–2030 ($MILLION)
TABLE 169.AFRICA FINANCE EGRC SOLUTIONS MARKET, BY APPLICATION, 2020–2030 ($MILLION)
TABLE 170.AFRICA FINANCE CLOUD MARKET REVENUE, BY DEPLOYMENT MODEL, 2020–2030 ($MILLION)
TABLE 171.AFRICA FINANCE CLOUD MARKET REVENUE, BY ENTERPRISE SIZE, 2020–2030 ($MILLION)
TABLE 172.AFRICA FINANCE CLOUD MARKET REVENUE, BY APPLICATION, 2020–2030 ($MILLION)
TABLE 173.AMAZON WEB SERVICES, INC.: COMPANY SNAPSHOT
TABLE 174.AMAZON WEB SERVICES, INC.: OPERATING SEGMENTS
TABLE 175.AMAZON WEB SERVICES, INC.: PRODUCT PORTFOLIO
TABLE 176.ACUMATICA, INC.: COMPANY SNAPSHOT
TABLE 177.ACUMATICA, INC.: PRODUCT PORTFOLIO
TABLE 178.ARYAKA NETWORKS,INC.: COMPANY SNAPSHOT
TABLE 179.ARYAKA NETWORKS,INC.: PRODUCT PORTFOLIO
TABLE 183.INTERNATIONAL BUSINESS MACHINES CORPORATION: COMPANY SNAPSHOT
TABLE 184.INTERNATIONAL BUSINESS MACHINES CORPORATION: OPERATING SEGMENTS
TABLE 185.INTERNATIONAL BUSINESS MACHINES CORPORATION: PRODUCT PORTFOLIO
TABLE 186.MICROSOFT: COMPANY SNAPSHOT
TABLE 187.MICROSOFT: OPERATING SEGMENTS
TABLE 188.MICROSOFT: PRODUCT PORTFOLIO
TABLE 189.ORACLE: COMPANY SNAPSHOT
TABLE 190.ORACLE: OPERATING SEGMENTS
TABLE 191.ORACLE: PRODUCT PORTFOLIO
TABLE 192.SAP SE: COMPANY SNAPSHOT
TABLE 193.SAP SE: OPERATING SEGMENTS
TABLE 194.SAP SE: PRODUCT PORTFOLIO
TABLE 195.UNIT4: COMPANY SNAPSHOT
TABLE 196.UNIT4: PRODUCT PORTFOLIO
TABLE 197.SAGE GROUP PLC: COMPANY SNAPSHOT
TABLE 198.SAGE GROUP PLC: PRODUCT PORTFOLIO
List of Figures
FIGURE 01.KEY MARKET SEGMENTS
FIGURE 02.GLOBAL FINANCE CLOUD MARKET SNAPSHOT, BY SEGMENTATION, 2021–2030
FIGURE 03.FINANCE CLOUD MARKET SNAPSHOT, BY REGION, 2021–2030
FIGURE 04.FINANCE CLOUD MARKET: TOP IMPACTING FACTOR
FIGURE 05.TOP INVESTMENT POCKETS
FIGURE 06.MODERATELY HIGH BARGAINING POWER OF SUPPLIERS
FIGURE 07.MODERATE BARGAINING POWER OF BUYER
FIGURE 08.LOW-TO-HIGH THREAT OF SUBSTITUTES
FIGURE 09.MODERATE-TO-HIGH THREAT OF NEW ENTRANTS
FIGURE 10.HIGH COMPETITIVE RIVALRY
FIGURE 11.IMPACT OF GOVERNMENT REGULATIONS ON FINANCE CLOUD MARKET
FIGURE 12.MARKET DYNAMICS: FINANCE CLOUD MARKET
FIGURE 13.GLOBAL FINANCE CLOUD MARKET, BY COMPONENT, 2020-2030
FIGURE 14.COMPARATIVE COUNTRY ANALYSIS OF FINANCE CLOUD MARKET FOR SOLUTION, 2020 & 2030 (%)
FIGURE 15.FINANCE CLOUD SOLUTIONS MARKET, BY APPLICATION, 2020-2030
FIGURE 16.COMPARATIVE SHARE ANALYSIS OF FINANCE CLOUD SOLUTIONS MARKET FOR FINANCIAL FORECASTING, BY COUNTRY, 2020 & 2030(%)
FIGURE 17.COMPARATIVE SHARE ANALYSIS OF FINANCE CLOUD SOLUTIONS MARKET FOR FINANCIAL REPORTING & ANALYSIS, BY COUNTRY, 2020 & 2030(%)
FIGURE 18.COMPARATIVE SHARE ANALYSIS OF FINANCE CLOUD SOLUTIONS MARKET FOR SECURITY, BY COUNTRY, 2020 & 2030(%)
FIGURE 19.COMPARATIVE SHARE ANALYSIS OF FINANCE CLOUD SOLUTIONS MARKET FOR GOVERNANCE, RISK, & COMPLIANCE (EGRC), BY COUNTRY, 2020 & 2030(%)
FIGURE 20.FINANCE EGRC SOLUTIONS MARKET, BY APPLICATION, 2020-2030
FIGURE 21.COMPARATIVE SHARE ANALYSIS OF FINANCE EGRC SOLUTIONS MARKET FOR POLICY MANAGEMENT, BY COUNTRY, 2020 & 2030(%)
FIGURE 22.COMPARATIVE SHARE ANALYSIS OF FINANCE EGRC SOLUTIONS MARKET FOR COMPLIANCE MANAGEMENT, BY COUNTRY, 2020 & 2030(%)
FIGURE 23.COMPARATIVE SHARE ANALYSIS OF FINANCE EGRC SOLUTIONS MARKET FOR AUDIT MANAGEMENT, BY COUNTRY, 2020 & 2030(%)
FIGURE 24.COMPARATIVE SHARE ANALYSIS OF FINANCE EGRC SOLUTIONS MARKET FOR INCIDENT & RISK MANAGEMENT, BY COUNTRY, 2020 & 2030(%)
FIGURE 25.COMPARATIVE SHARE ANALYSIS OF FINANCE EGRC SOLUTIONS MARKET FOR OTHERS, BY COUNTRY, 2020 & 2030(%)
FIGURE 26.COMPARATIVE SHARE ANALYSIS OF FINANCE CLOUD SOLUTIONS MARKET FOR OTHERS, BY COUNTRY, 2020 & 2030(%)
FIGURE 27.COMPARATIVE COUNTRY ANALYSIS OF FINANCE CLOUD MARKET FOR SERVICE, 2020 & 2030 (%)
FIGURE 28.GLOBAL FINANCE CLOUD MARKET, BY DEPLOYMENT MODEL, 2020-2030
FIGURE 29.COMPARATIVE COUNTRY ANALYSIS OF FINANCE CLOUD MARKET FOR PRIVATE, 2020 & 2030 (%)
FIGURE 30.COMPARATIVE COUNTRY ANALYSIS OF FINANCE CLOUD MARKET FOR PUBLIC, 2020 & 2030 (%)
FIGURE 31.COMPARATIVE COUNTRY ANALYSIS OF FINANCE CLOUD MARKET FOR HYBRID, 2020 & 2030 (%)
FIGURE 32.GLOBAL FINANCE CLOUD MARKET, BY ENTERPRISE SIZE, 2020-2030
FIGURE 33.COMPARATIVE COUNTRY ANALYSIS OF FINANCE CLOUD MARKET FOR LARGE ENTERPRISES, 2020 & 2030 (%)
FIGURE 34.COMPARATIVE ANALYSIS OF FINANCE CLOUD MARKET FOR SMALL & MEDIUM ENTERPRISES (SMES), 2020 & 2030 (%)
FIGURE 35.GLOBAL FINANCE CLOUD MARKET, BY APPLICATION, 2020-2030
FIGURE 36.COMPARATIVE COUNTRY ANALYSIS OF FINANCE CLOUD MARKET FOR REVENUE MANAGEMENT, 2020 & 2030 (%)
FIGURE 37.COMPARATIVE ANALYSIS OF FINANCE CLOUD MARKET FOR BUSINESS INTELLIGENCE, 2020 & 2030 (%)
FIGURE 38.COMPARATIVE ANALYSIS OF FINANCE CLOUD MARKET FOR ASSET MANAGEMENT, 2020 & 2030 (%)
FIGURE 39.COMPARATIVE COUNTRY ANALYSIS OF FINANCE CLOUD MARKET FOR CUSTOMER RELATIONSHIP MANAGEMENT, 2020 & 2030 (%)
FIGURE 40.COMPARATIVE COUNTRY ANALYSIS OF FINANCE CLOUD MARKET FOR ENTERPRISE RESOURCE PLANNING, 2020 & 2030 (%)
FIGURE 41.COMPARATIVE COUNTRY ANALYSIS OF FINANCE CLOUD MARKET FOR OTHERS, 2020 & 2030 (%)
FIGURE 42.U.S. FINANCE CLOUD MARKET REVENUE, 2020–2030 ($MILLION)
FIGURE 43.CANADA FINANCE CLOUD MARKET REVENUE, 2020–2030 ($MILLION)
FIGURE 44.UK FINANCE CLOUD MARKET REVENUE, 2020–2030 ($MILLION)
FIGURE 45.GERMANY FINANCE CLOUD MARKET REVENUE, 2020–2030 ($MILLION)
FIGURE 46.FRANCE FINANCE CLOUD MARKET REVENUE, 2020–2030 ($MILLION)
FIGURE 47.ITALY FINANCE CLOUD MARKET REVENUE, 2020–2030 ($MILLION)
FIGURE 48.SPAIN FINANCE CLOUD MARKET REVENUE, 2020–2030 ($MILLION)
FIGURE 49.THE NETHERLANDS FINANCE CLOUD MARKET REVENUE, 2020–2030 ($MILLION)
FIGURE 50.REST OF EUROPE FINANCE CLOUD MARKET REVENUE, 2020–2030 ($MILLION)
FIGURE 51.CHINA FINANCE CLOUD MARKET REVENUE, 2020–2030 ($MILLION)
FIGURE 52.JAPAN FINANCE CLOUD MARKET REVENUE, 2020–2030 ($MILLION)
FIGURE 53.INDIA FINANCE CLOUD MARKET REVENUE, 2020–2030 ($MILLION)
FIGURE 54.AUSTRALIA FINANCE CLOUD MARKET REVENUE, 2020–2030 ($MILLION)
FIGURE 55.SOUTH KOREA FINANCE CLOUD MARKET REVENUE, 2020–2030 ($MILLION)
FIGURE 56.SINGAPORE FINANCE CLOUD MARKET REVENUE, 2020–2030 ($MILLION)
FIGURE 57.REST OF ASIA-PACIFIC FINANCE CLOUD MARKET REVENUE, 2020–2030 ($MILLION)
FIGURE 58.LATIN AMERICA FINANCE CLOUD MARKET REVENUE, 2020–2030 ($MILLION)
FIGURE 59.MIDDLE EAST FINANCE CLOUD MARKET REVENUE, 2020–2030 ($MILLION)
FIGURE 60.AFRICA FINANCE CLOUD MARKET REVENUE, 2020–2030 ($MILLION)
FIGURE 61.MARKET PLAYER POSITIONING, 2020
FIGURE 62.COMPETITIVE DASHBOARD
FIGURE 63.COMPETITIVE DASHBOARD
FIGURE 64.COMPETITIVE HEATMAP OF KEY PLAYERS
FIGURE 65.TOP WINNING STRATEGIES, BY YEAR, 2019–2021
FIGURE 66.TOP WINNING STRATEGIES, BY DEVELOPMENT, 2019–2021
FIGURE 67.TOP WINNING STRATEGIES, BY COMPANY, 2019–2021
FIGURE 68.AMAZON WEB SERVICES, INC.: REVENUE, 2018-2020 ($MILLION)
FIGURE 69.AMAZON WEB SERVICES, INC.: REVENUE SHARE BY SEGMENT, 2020 (%)
FIGURE 70.AMAZON WEB SERVICES, INC.: REVENUE SHARE BY REGION, 2020 (%)
FIGURE 74.INTERNATIONAL BUSINESS MACHINES CORPORATION: NET SALES, 2018–2020 ($MILLION)
FIGURE 75.INTERNATIONAL BUSINESS MACHINES CORPORATION: REVENUE SHARE, BY SEGMENT (2020)
FIGURE 76.INTERNATIONAL BUSINESS MACHINES CORPORATION: REVENUE SHARE, BY REGION (2020)
FIGURE 77.MICROSOFT: REVENUE, 2018–2020 ($MILLION)
FIGURE 78.MICROSOFT: REVENUE SHARE, BY SEGMENT, 2020 (%)
FIGURE 79.MICROSOFT: REVENUE SHARE, BY REGION, 2020 (%)
FIGURE 80.ORACLE: NET REVENUE, 2018–2020 ($MILLION)
FIGURE 81.ORACLE: REVENUE SHARE, BY SEGMENT, 2020 (%)
FIGURE 82.ORACLE: REVENUE SHARE, BY REGION, 2020 (%)
FIGURE 83.SAP SE: REVENUE, 2018–2020 ($MILLION)
FIGURE 84.SAP SE: REVENUE SHARE, BY SEGMENT, 2020 (%)
FIGURE 85.SAP SE: REVENUE SHARE, BY REGION, 2020 (%)
FIGURE 86.SAGE GROUP PLC: REVENUE, 2018–2020 ($MILLION)
FIGURE 87.SAGE GROUP PLC: REVENUE SHARE BY REGION, 2020 (%)
$5770
$10665
HAVE A QUERY?
OUR CUSTOMER
