
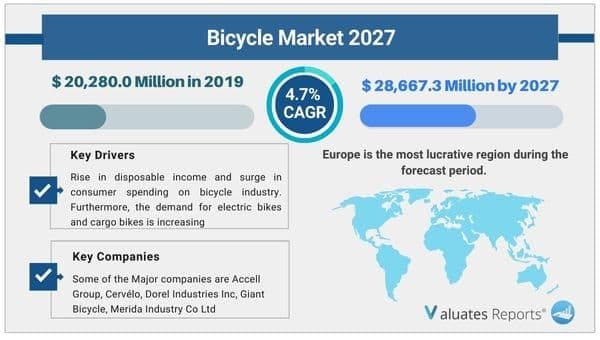
The global bicycle market size was valued at USD 20,280.0 Million in 2019. According to the bicycle market analysis the market is estimated to reach USD 28,667.3 Million by 2027. The bicycle market forecasted a growing CAGR of 4.8% from 2021 to 2027.
A bicycle is an eco-friendly mode of transportation, which is available in a rage of varieties such as cargo bikes, electric bikes, and mountain bikes. Bicycle is simple to operate and is considered as one of the safest modes for travelling. Furthermore, major bicycle associations include Go Out and Tour Somewhere, Easy Rider Bike Club, and Road Soldiers Cycling Club share a major motive to increase the interest of customers toward cycling. Thus, they are involved in hosting various sports tournaments, fun activities, bike rallies, and competitions, which motivates customers for bicycle use. Moreover, the trend in bicycle sports is gaining traction in in Europe and North America. This is attributed to the fact that majority of the tournaments such as Tour de France and LoToJa are held in these regions.
The bicycle market growth is majorly driven by rise in disposable income and surge in consumer spending on bicycle industry. Furthermore, in developed countries, the demand for electric bikes and cargo bikes is increasing significantly, as electric bikes are safe, easy to operate, and are low in maintenance. In addition, these bikes do not require a driving license, enable customers of various age groups drive these bikes, thereby fueling their demand, globally. However, cycling in unfavorable weather conditions is unsafe, which limits the use of bicycles. In addition, low durability of batteries in electric bikes limits the growth of the market.
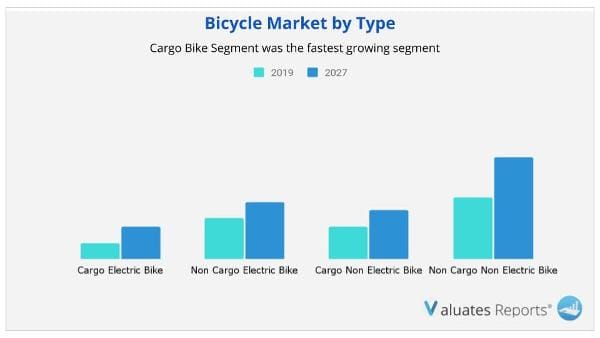
The outbreak of COVID-19 pandemic did not affect the bicycle market. The market instead witnessed notable growth during this global health crisis. This is attributed to rise in health consciousness among consumers and preference for bicycles as economical means of exercising and travelling short distances. Furthermore, implementation of stringent norms such as social distancing during the pandemic have enforced individuals to avoid gathering in gyms and travel thorough public transports, which, in turn, boosted the demand for bicycles. In addition, as bicycle saves fuel cost and the time spent in traffic, individuals prefer bicycle while going to office. Cargo Electric bike segment was the fastest growing segment.
Moreover, various bicycle sports events such as Tour de France, Vuelta a España, UCI Road World Championships, and Paris-Roubaix are increasingly being organized at a global level. These sports events motive athletes and regular citizens to adopt cycling. This notably contributes toward the growth of the global market.
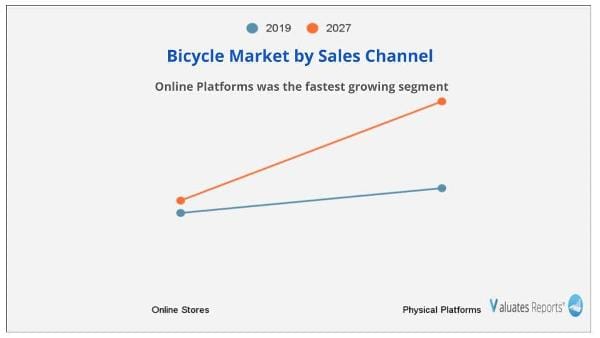
The bicycle market is segmented into type, sales channel, end user, and region. Depending on type, the market is categorized into cargo electric bike, non-cargo electric bike, cargo nonelectric bike, and non-cargo nonelectric bike. On the basis of sales channel, it is bifurcated into online platforms and physical stores. By end user, it is segregated into men, women, and kids. Region wise, it is analyzed across North America (U.S., Mexico, and Canada), Europe (Germany, UK, France, Italy, Spain, Russia, Netherlands, Sweden, and rest of Europe), Asia-Pacific (China, India, Japan, Australia, South Korea, Malaysia, Indonesia, and rest of Asia-Pacific), and LAMEA (Latin America, the Middle East, and Africa). Online platforms was the fastest growing segment.
On the basis of end user, the kids segment is the major revenue contributor. Depending on the interests and trends among kids, manufacturers are launching bicycles with innovative ideas to attract them. For instance, manufacturers launch bikes with stickers of famous cartoon characters and movies.
Along with innovation in the kids segment, manufacturers are covering the adult customer segment. They are upgrading and are focusing on technological advancements in bicycles such as integration of Bluetooth, GPS, more durable batteries, improvement in gear-shifting functionality, balancing ventilation, and aerodynamics. These technological advancements improve the driving experience of users. Kids was the fastest growing segment.
By type, the electric bikes segment dominated the market. This is attributed to the fact that the demand for electric bikes is increasing in major countries such as Japan, China, the U.S. and the Netherland. This is attributed to the fact that electric bikes make it easier to carry weight and travel around. As a result, the postal services are adopting electric bikes as a means of travelling. Moreover, these bicycles help to reach the destination on time and saves fuel cost and addition carriage of weight. Thus, this bicycle market trends leads to the increase in the expansion of bicycle market in these countries.
Furthermore, to promote bicycle market share, governments of various countries are launching bike voucher scheme. In this scheme, the user is offered voucher up to £50 for repairing of the bike. In addition, the voucher can be used for opening a bicycle repair business. By this scheme, the accessibility of bicycle becomes easier to customers, which further promotes the growth of the global bicycle market. Europe was the dominant regional segment.
|
Report Metric |
Details |
|
Report Name |
Bicycle Market |
|
Market size value in 2019 |
USD 20,280.0 Million |
|
Revenue forecast in 2027 |
USD 28,667.3 Million |
|
Growth Rate |
CAGR 4.8% |
|
Base year considered |
2019 |
|
Forecast Period |
2020-2027 |
|
By Type |
Cargo Electric Bike, Non-cargo Electric bike, Cargo Nonelectric Bike, and Non-cargo Nonelectric Bike |
|
By End User |
Men, Women, and Kids |
|
Report Coverage |
Revenue & volume forecast, company share, competitive landscape, growth factors, and trends |
|
Segments Covered |
By Type, Application, and Region |
|
Geographic Regions Covered |
North America, Europe, Asia Pacific, Latin America, Middle East & Africa |
Ans. The global bicycle market size was valued at USD 20,280.0 Million in 2019. According to the bicycle market analysis the market is estimated to reach USD 28,667.3 Million by 2027. The bicycle market forecasted a growing CAGR of 4.8% from 2021 to 2027.
Ans. Some of the Major companies are Accell Group, Cervélo, Dorel Industries Inc, Giant Bicycle, Merida Industry Co Ltd, Olympus Bikes
Ans. Yes, the report includes a COVID-19 impact analysis. Also, it is further extended into every individual segment of the report.
CHAPTER 1:INTRODUCTION
1.1.Report description
1.2.Key benefits to stakeholders
1.3.Key market Segments
1.4.Research Methodology
1.4.1.Primary Research
1.4.2.Secondary Research
1.4.3.Analyst tools and models
CHAPTER 2:EXECUTIVE SUMMARY
2.1.Key findings of the study
2.2.CXO perspective
CHAPTER 3:MARKET OVERVIEW
3.1.Market definition and scope
3.2.Porter’s five forces analysis
3.2.1.Bargaining power of suppliers
3.2.2.Bargaining power of buyers
3.2.3.Threat of substitution
3.2.4.Threat of new entrants
3.2.5.Intensity of competitive rivalry
3.3.Market dynamics
3.3.1.Drivers
3.3.1.1.Covid-19 and bicycle market growth
3.3.1.2.Low maintenance cost of bicycles
3.3.1.3.Health benefits associated with bicycles
3.3.2.Restraints
3.3.2.1.Low demand for electric bikes in developing countries
3.3.2.2.Limited use of bicycle during unfavorable climate
3.3.3.Opportunities
3.3.3.1.Increase in adoption of outdoor sports
3.3.3.2.Technological advancements and manufacturing designs
CHAPTER 4:BICYCLE MARKET, BY TYPE
4.1.Overview
4.2.Cargo electric bike
4.2.1.Key market trends, growth factors, and opportunities
4.2.2.Market size and forecast, by type
4.2.3.Market analysis, by country
4.3.Non-cargo electric bike
4.3.1.Key market trends, growth factors, and opportunities
4.3.2.Market size and forecast, by type
4.3.3.Market analysis, by country
4.4.Cargo nonelectric bike
4.4.1.Key market trends, growth factors, and opportunities
4.4.2.Market size and forecast, by type
4.4.3.Market analysis, by country
4.5.Non-cargo nonelectric bike
4.5.1.Key market trends, growth factors, and opportunities
4.5.2.Market size and forecast, by type
4.5.3.Market analysis, by country
CHAPTER 5:BICYCLE MARKET, BY SALES CHANNEL
5.1.Overview
5.2.Online
5.2.1.Key market trends, growth factors, and opportunities
5.2.2.Market size and forecast, by sales channel
5.2.3.Market analysis, by country
5.3.Physical stores
5.3.1.Key market trends, growth factors, and opportunities
5.3.2.Market size and forecast, by pricing
5.3.3.Market analysis, by country
CHAPTER 6:BICYCLE MARKET, BY END USER
6.1.Overview
6.2.Men
6.2.1.Key market trends, growth factors, and opportunities
6.2.2.Market size and forecast, by sales channel
6.2.3.Market analysis, by country
6.3.Women
6.3.1.Key market trends, growth factors, and opportunities
6.3.2.Market size and forecast, by sales channel
6.3.3.Market analysis, by country
6.4.Kids
6.4.1.Key market trends, growth factors, and opportunities
6.4.2.Market size and forecast, by sales channel
6.4.3.Market analysis, by country
CHAPTER 7:BICYCLE MARKET, BY REGION
7.1.Overview
7.2.North America
7.2.1.Overview
7.2.2.Key market trends, growth factors, and opportunities
7.2.3.Market size and forecast, by type
7.2.4.Market size and forecast, by sales channel
7.2.5.Market size and forecast, by end user
7.2.6.Market size and forecast, by country
7.2.6.1.U.S.
7.2.6.1.1.Market size and forecast, by type
7.2.6.1.2.Market size and forecast, by sales channel
7.2.6.1.3.Market size and forecast, by end user
7.2.6.2.Canada
7.2.6.2.1.Market size and forecast, by type
7.2.6.2.2.Market size and forecast, by sales channel
7.2.6.2.3.Market size and forecast, by end user
7.2.6.3.Mexico
7.2.6.3.1.Market size and forecast, by type
7.2.6.3.2.Market size and forecast, by sales channel
7.2.6.3.3.Market size and forecast, by end user
7.3.Europe
7.3.1.Key market trends, growth factors, and opportunities
7.3.2.Market size and forecast, by type
7.3.3.Market size and forecast, by sales channel
7.3.4.Market size and forecast, by end user
7.3.5.Market size and forecast, by country
7.3.5.1.Germany
7.3.5.1.1.Market size and forecast, by type
7.3.5.1.2.Market size and forecast, by sales channel
7.3.5.1.3.Market size and forecast, by end user
7.3.5.2.UK
7.3.5.2.1.Market size and forecast, by type
7.3.5.2.2.Market size and forecast, by sales channel
7.3.5.2.3.Market size and forecast, by end user
7.3.5.3.France
7.3.5.3.1.Market size and forecast, by type
7.3.5.3.2.Market size and forecast, by sales channel
7.3.5.3.3.Market size and forecast, by end user
7.3.5.4.Italy
7.3.5.4.1.Market size and forecast, by type
7.3.5.4.2.Market size and forecast, by sales channel
7.3.5.4.3.Market size and forecast, by end user
7.3.5.5.Spain
7.3.5.5.1.Market size and forecast, by type
7.3.5.5.2.Market size and forecast, by sales channel
7.3.5.5.3.Market size and forecast, by end user
7.3.5.6.Russia
7.3.5.6.1.Market size and forecast, by type
7.3.5.6.2.Market size and forecast, by sales channel
7.3.5.6.3.Market size and forecast, by end user
7.3.5.7.Netherlands
7.3.5.7.1.Market size and forecast, by type
7.3.5.7.2.Market size and forecast, by sales channel
7.3.5.7.3.Market size and forecast, by end user
7.3.5.8.Sweden
7.3.5.8.1.Market size and forecast, by type
7.3.5.8.2.Market size and forecast, by sales channel
7.3.5.8.3.Market size and forecast, by end user
7.3.5.9.Rest of Europe
7.3.5.9.1.Market size and forecast, by type
7.3.5.9.2.Market size and forecast, by sales channel
7.3.5.9.3.Market size and forecast, by end user
7.4.Asia-Pacific
7.4.1.Key market trends, growth factors, and opportunities
7.4.2.Market size and forecast, by type
7.4.3.Market size and forecast, by sales channel
7.4.4.Market size and forecast, by end user
7.4.5.Market size and forecast, by country
7.4.5.1.China
7.4.5.1.1.Market size and forecast, by type
7.4.5.1.2.Market size and forecast, by sales channel
7.4.5.1.3.Market size and forecast, by end user
7.4.5.2.India
7.4.5.2.1.Market size and forecast, by type
7.4.5.2.2.Market size and forecast, by sales channel
7.4.5.2.3.Market size and forecast, by end user
7.4.5.3.Japan
7.4.5.3.1.Market size and forecast, by type
7.4.5.3.2.Market size and forecast, by sales channel
7.4.5.3.3.Market size and forecast, by end user
7.4.5.4.Australia
7.4.5.4.1.Market size and forecast, by type
7.4.5.4.2.Market size and forecast, by sales channel
7.4.5.4.3.Market size and forecast, by end user
7.4.5.5.South Korea
7.4.5.5.1.Market size and forecast, by type
7.4.5.5.2.Market size and forecast, by sales channel
7.4.5.5.3.Market size and forecast, by end user
7.4.5.6.Malaysia
7.4.5.6.1.Market size and forecast, by type
7.4.5.6.2.Market size and forecast, by sales channel
7.4.5.6.3.Market size and forecast, by end user
7.4.5.7.Indonesia
7.4.5.7.1.Market size and forecast, by type
7.4.5.7.2.Market size and forecast, by sales channel
7.4.5.7.3.Market size and forecast, by end user
7.4.5.8.Rest of Asia-Pacific
7.4.5.8.1.Market size and forecast, by type
7.4.5.8.2.Market size and forecast, by sales channel
7.4.5.8.3.Market size and forecast, by end user
7.5.LAMEA
7.5.1.Key market trends, growth factors, and opportunities
7.5.2.Market size and forecast, by type
7.5.3.Market size and forecast, by sales channel
7.5.4.Market size and forecast, by end user
7.5.5.Market size and forecast, by country
7.5.5.1.Latin America
7.5.5.1.1.Market size and forecast, by type
7.5.5.1.2.Market size and forecast, by sales channel
7.5.5.1.3.Market size and forecast, by end user
7.5.5.2.Middle East
7.5.5.2.1.Market size and forecast, by type
7.5.5.2.2.Market size and forecast, by sales channel
7.5.5.2.3.Market size and forecast, by end user
7.5.5.3.Africa
7.5.5.3.1.Market size and forecast, by type
7.5.5.3.2.Market size and forecast, by sales channel
7.5.5.3.3.Market size and forecast, by end user
CHAPTER 8:COMPETITIVE LANDSCAPE
8.1.Product mapping
8.2.Competitive heat map of Top 10 Key Players
CHAPTER 9:COMPANY PROFILES
9.1.ACCELL GROUP
9.1.1.Company overview
9.1.2.Key executives
9.1.3.Company snapshot
9.1.4.Operating business segments
9.1.5.Product portfolio
9.1.6.Business performance
9.1.7.Key strategic moves and developments
9.2.CERVÉLO
9.2.1.Company overview
9.2.2.Key executive
9.2.3.Company snapshot
9.2.4.Product portfolio
9.3.DOREL INDUSTRIES INC.
9.3.1.Company overview
9.3.2.Key executives
9.3.3.Company snapshot
9.3.4.Operating business segments
9.3.5.Product portfolio
9.3.6.Business performance
9.4.GIANT Bicycles
9.4.1.Company overview
9.4.2.Key executives
9.4.3.Company snapshot
9.4.4.Product portfolio
9.4.5.Business performance
9.5.MERIDA INDUSTRY CO., LTD.
9.5.1.Company overview
9.5.2.Key executives
9.5.3.Company snapshot
9.5.4.Operating business segments
9.5.5.Product portfolio
9.5.6.Business performance
9.5.7.Key strategic moves and developments
9.6.OLYMPUS BIKES
9.6.1.Company overview
9.6.2.Key executives
9.6.3.Company snapshot
9.6.4.Product portfolio
9.6.5.Business performance
9.7.SCOTT SPORTS SA
9.7.1.Company overview
9.7.2.Key executive
9.7.3.Company snapshot
9.7.4.Operating business segments
9.7.5.Product portfolio
9.7.6.Key strategic moves and developments
9.8.SPECIALIZED BICYCLE COMPONENTS, INC.
9.8.1.Company overview
9.8.2.Key executive
9.8.3.Company snapshot
9.8.4.Operating business segments
9.8.5.Product portfolio
9.9.TREK BICYCLE CORPORATION
9.9.1.Company overview
9.9.2.Key executives
9.9.3.Company snapshot
9.9.4.Operating business segments
9.9.5.Product portfolio
9.9.6.Key strategic moves and developments
9.10.KONA BICYCLE COMPANY
9.10.1.Company overview
9.10.2.Key executive
9.10.3.Company snapshot
9.10.4.Product portfolio
LIST OF TABLES
TABLE 01.GLOBAL BICYCLE MARKET REVENUE, BY TYPE, 2019-2027 ($MILLION)
TABLE 02.CARGO ELECTRIC BIKE MARKET REVENUE, BY TYPE, 2019–2027 ($MILLION)
TABLE 03.NON-CARGO ELECTRIC BIKE MARKET REVENUE, BY TYPE, 2019–2027 ($MILLION)
TABLE 04.CARGO NONELECTRIC BIKE MARKET REVENUE, BY TYPE, 2019–2027 ($MILLION)
TABLE 05.NON-CARGO NONELECTRIC BIKE MARKET REVENUE, BY TYPE, 2019–2027 ($MILLION)
TABLE 06.GLOBAL BICYCLE MARKET REVENUE, BY SALES CHANNEL, 2019–2027 ($MILLION)
TABLE 07.BICYCLE MARKET REVENUE FOR ONLINE PLATFORM, BY REGION, 2019–2027 ($MILLION)
TABLE 08.BICYCLE MARKET REVENUE FOR PHYSICAL STORES, BY SALES CHANNEL, 2019–2027 ($MILLION)
TABLE 09.GLOBAL BICYCLE MARKET REVENUE, BY END USER, 2019–2027 ($MILLION)
TABLE 10.BICYCLE MARKET REVENUE FOR MEN, BY END USER, 2019–2027 ($MILLION)
TABLE 11.BICYCLE MARKET REVENUE FOR WOMEN, BY END USER, 2019–2027 ($MILLION)
TABLE 12.BICYCLE MARKET REVENUE FOR KIDS, BY END USER, 2019–2027 ($MILLION)
TABLE 13.BICYCLE MARKET REVENUE, BY REGION, 2019–2027 ($MILLION)
TABLE 14.BICYCLE MARKET REVENUE FOR NORTH AMERICA, BY TYPE, 2019–2027 ($MILLION)
TABLE 15.BICYCLE MARKET REVENUE FOR NORTH AMERICA, BY SALES CHANNEL, 2019–2027 ($MILLION)
TABLE 16.BICYCLE MARKET REVENUE FOR NORTH AMERICA, BY END USER, 2019–2027 ($MILLION)
TABLE 17.BICYCLE MARKET REVENUE FOR NORTH AMERICA, BY COUNTRY, 2019–2027 ($MILLION)
TABLE 18.BICYCLE MARKET REVENUE FOR U.S., BY TYPE, 2019–2027 ($MILLION)
TABLE 19.BICYCLE MARKET REVENUE FOR U.S., BY SALES CHANNEL, 2019–2027 ($MILLION)
TABLE 20.BICYCLE MARKET REVENUE FOR U.S., BY END USER, 2019–2027 ($MILLION)
TABLE 21.BICYCLE MARKET REVENUE FOR CANADA, BY TYPE, 2019–2027 ($MILLION)
TABLE 22.BICYCLE MARKET REVENUE FOR CANADA, BY SALES CHANNEL, 2019–2027 ($MILLION)
TABLE 23.BICYCLE MARKET REVENUE FOR CANADA, BY END USER, 2019–2027 ($MILLION)
TABLE 24.BICYCLE MARKET REVENUE FOR MEXICO, BY TYPE, 2019–2027 ($MILLION)
TABLE 25.BICYCLE MARKET REVENUE FOR MEXICO, BY SALES CHANNEL, 2019–2027 ($MILLION)
TABLE 26.BICYCLE MARKET REVENUE FOR MEXICO, BY END USER, 2019–2027 ($MILLION)
TABLE 27.BICYCLE MARKET REVENUE FOR EUROPE, BY TYPE, 2019–2027 ($MILLION)
TABLE 28.BICYCLE MARKET REVENUE FOR EUROPE, BY SALES CHANNEL, 2019–2027 ($MILLION)
TABLE 29.BICYCLE MARKET REVENUE FOR EUROPE, BY END USER, 2019–2027 ($MILLION)
TABLE 30.BICYCLE MARKET REVENUE FOR EUROPE, BY COUNTRY, 2019–2027 ($MILLION)
TABLE 31.BICYCLE MARKET REVENUE FOR GERMANY, BY TYPE, 2019–2027 ($MILLION)
TABLE 32.BICYCLE MARKET REVENUE FOR GERMANY, BY SALES CHANNEL, 2019–2027 ($MILLION)
TABLE 33.BICYCLE MARKET REVENUE FOR GERMANY, BY END USER, 2019–2027 ($MILLION)
TABLE 34.BICYCLE MARKET REVENUE FOR UK, BY TYPE, 2019–2027 ($MILLION)
TABLE 35.BICYCLE MARKET REVENUE FOR UK, BY SALES CHANNEL, 2019–2027 ($MILLION)
TABLE 36.BICYCLE MARKET REVENUE FOR UK, BY END USER, 2019–2027 ($MILLION)
TABLE 37.BICYCLE MARKET REVENUE FOR FRANCE, BY TYPE, 2019–2027 ($MILLION)
TABLE 38.BICYCLE MARKET REVENUE FOR FRANCE, BY SALES CHANNEL, 2019–2027 ($MILLION)
TABLE 39.BICYCLE MARKET REVENUE FOR FRANCE, BY END USER, 2019–2027 ($MILLION)
TABLE 40.BICYCLE MARKET REVENUE FOR ITALY, BY TYPE, 2019–2027 ($MILLION)
TABLE 41.BICYCLE MARKET REVENUE FOR ITALY, BY SALES CHANNEL, 2019–2027 ($MILLION)
TABLE 42.BICYCLE MARKET REVENUE FOR ITALY, BY END USER, 2019–2027 ($MILLION)
TABLE 43.BICYCLE MARKET REVENUE FOR SPAIN, BY TYPE, 2019–2027 ($MILLION)
TABLE 44.BICYCLE MARKET REVENUE FOR SPAIN, BY SALES CHANNEL, 2019–2027 ($MILLION)
TABLE 45.BICYCLE MARKET REVENUE FOR SPAIN, BY END USER, 2019–2027 ($MILLION)
TABLE 46.BICYCLE MARKET REVENUE FOR RUSSIA, BY TYPE, 2019–2027 ($MILLION)
TABLE 47.BICYCLE MARKET REVENUE FOR RUSSIA, BY SALES CHANNEL, 2019–2027 ($MILLION)
TABLE 48.BICYCLE MARKET REVENUE FOR RUSSIA, BY END USER, 2019–2027 ($MILLION)
TABLE 49.BICYCLE MARKET REVENUE FOR NETHERLANDS, BY TYPE, 2019–2027 ($MILLION)
TABLE 50.BICYCLE MARKET REVENUE FOR NETHERLANDS, BY SALES CHANNEL, 2019–2027 ($MILLION)
TABLE 51.BICYCLE MARKET REVENUE FOR NETHERLANDS, BY END USER, 2019–2027 ($MILLION)
TABLE 52.BICYCLE MARKET REVENUE FOR SWEDEN, BY TYPE, 2019–2027 ($MILLION)
TABLE 53.BICYCLE MARKET REVENUE FOR SWEDEN, BY SALES CHANNEL, 2019–2027 ($MILLION)
TABLE 54.BICYCLE MARKET REVENUE FOR SWEDEN, BY END USER, 2019–2027 ($MILLION)
TABLE 55.BICYCLE MARKET REVENUE FOR REST OF EUROPE, BY TYPE, 2019–2027 ($MILLION)
TABLE 56.BICYCLE MARKET REVENUE FOR REST OF EUROPE, BY SALES CHANNEL, 2019–2027 ($MILLION)
TABLE 57.BICYCLE MARKET REVENUE FOR REST OF EUROPE, BY END USER, 2019–2027 ($MILLION)
TABLE 58.BICYCLE MARKET REVENUE FOR ASIA-PACIFIC, BY TYPE, 2019–2027 ($MILLION)
TABLE 59.BICYCLE MARKET REVENUE FOR ASIA-PACIFIC, BY SALES CHANNEL, 2019–2027 ($MILLION)
TABLE 60.BICYCLE MARKET REVENUE FOR ASIA-PACIFIC, BY END USER, 2019–2027 ($MILLION)
TABLE 61.BICYCLE MARKET REVENUE FOR ASIA-PACIFIC, BY COUNTRY, 2019–2027 ($MILLION)
TABLE 62.BICYCLE MARKET REVENUE FOR CHINA, BY TYPE, 2019–2027 ($MILLION)
TABLE 63.BICYCLE MARKET REVENUE FOR CHINA, BY SALES CHANNEL, 2019–2027 ($MILLION)
TABLE 64.BICYCLE MARKET REVENUE FOR CHINA, BY END USER, 2019–2027 ($MILLION)
TABLE 65.BICYCLE MARKET REVENUE FOR INDIA, BY TYPE, 2019–2027 ($MILLION)
TABLE 66.BICYCLE MARKET REVENUE FOR INDIA, BY SALES CHANNEL, 2019–2027 ($MILLION)
TABLE 67.BICYCLE MARKET REVENUE FOR INDIA, BY END USER, 2019–2027 ($MILLION)
TABLE 68.BICYCLE MARKET REVENUE FOR JAPAN, BY TYPE, 2019–2027 ($MILLION)
TABLE 69.BICYCLE MARKET REVENUE FOR JAPAN, BY SALES CHANNEL, 2019–2027 ($MILLION)
TABLE 70.BICYCLE MARKET REVENUE FOR JAPAN, BY END USER, 2019–2027 ($MILLION)
TABLE 71.BICYCLE MARKET REVENUE FOR AUSTRALIA, BY TYPE, 2019–2027 ($MILLION)
TABLE 72.BICYCLE MARKET REVENUE FOR AUSTRALIA, BY SALES CHANNEL, 2019–2027 ($MILLION)
TABLE 73.BICYCLE MARKET REVENUE FOR AUSTRALIA, BY END USER, 2019–2027 ($MILLION)
TABLE 74.BICYCLE MARKET REVENUE FOR SOUTH KOREA, BY TYPE, 2019–2027 ($MILLION)
TABLE 75.BICYCLE MARKET REVENUE FOR SOUTH KOREA, BY SALES CHANNEL, 2019–2027 ($MILLION)
TABLE 76.BICYCLE MARKET REVENUE FOR SOUTH KOREA, BY END USER, 2019–2027 ($MILLION)
TABLE 77.BICYCLE MARKET REVENUE FOR MALAYSIA, BY TYPE, 2019–2027 ($MILLION)
TABLE 78.BICYCLE MARKET REVENUE FOR MALAYSIA, BY SALES CHANNEL, 2019–2027 ($MILLION)
TABLE 79.BICYCLE MARKET REVENUE FOR MALAYSIA, BY END USER, 2019–2027 ($MILLION)
TABLE 80.BICYCLE MARKET REVENUE FOR INDONESIA, BY TYPE, 2019–2027 ($MILLION)
TABLE 81.BICYCLE MARKET REVENUE FOR INDONESIA, BY SALES CHANNEL, 2019–2027 ($MILLION)
TABLE 82.BICYCLE MARKET REVENUE FOR INDONESIA, BY END USER, 2019–2027 ($MILLION)
TABLE 83.BICYCLE MARKET REVENUE FOR REST OF ASIA-PACIFIC, BY TYPE, 2019–2027 ($MILLION)
TABLE 84.BICYCLE MARKET REVENUE FOR REST OF ASIA-PACIFIC, BY SALES CHANNEL, 2019–2027 ($MILLION)
TABLE 85.BICYCLE MARKET REVENUE FOR REST OF ASIA-PACIFIC, BY END USER, 2019–2027 ($MILLION)
TABLE 86.BICYCLE MARKET REVENUE FOR LAMEA, BY TYPE, 2019–2027 ($MILLION)
TABLE 87.BICYCLE MARKET REVENUE FOR LAMEA, BY SALES CHANNEL, 2019–2027 ($MILLION)
TABLE 88.BICYCLE MARKET REVENUE FOR LAMEA, BY END USER, 2019–2027 ($MILLION)
TABLE 89.BICYCLE MARKET REVENUE FOR LAMEA, BY COUNTRY, 2019–2027 ($MILLION)
TABLE 90.BICYCLE MARKET REVENUE FOR LATIN AMERICA, BY TYPE, 2019–2027 ($MILLION)
TABLE 91.BICYCLE MARKET REVENUE FOR LATIN AMERICA, BY SALES CHANNEL, 2019–2027 ($MILLION)
TABLE 92.BICYCLE MARKET REVENUE FOR LATIN AMERICA, BY END USER, 2019–2027 ($MILLION)
TABLE 93.BICYCLE MARKET REVENUE FOR MIDDLE EAST, BY TYPE, 2019–2027 ($MILLION)
TABLE 94.BICYCLE MARKET REVENUE FOR MIDDLE EAST, BY SALES CHANNEL, 2019–2027 ($MILLION)
TABLE 95.BICYCLE MARKET REVENUE FOR MIDDLE EAST, BY END USER, 2019–2027 ($MILLION)
TABLE 96.BICYCLE MARKET REVENUE FOR AFRICA, BY TYPE, 2019–2027 ($MILLION)
TABLE 97.BICYCLE MARKET REVENUE FOR AFRICA, BY SALES CHANNEL, 2019–2027 ($MILLION)
TABLE 98.BICYCLE MARKET REVENUE FOR AFRICA, BY END USER, 2019–2027 ($MILLION)
TABLE 99.ACCELL GROUP: KEY EXECUTIVES
TABLE 100.ACCELL GROUP: COMPANY SNAPSHOT
TABLE 101.ACCELL GROUP: OPERATING SEGMENTS
TABLE 102.ACCELL GROUP: PRODUCT PORTFOLIO
TABLE 103.ACCELL GROUP: NET SALES, 2017–2019 ($MILLION)
TABLE 104.CERVÉLO: KEY EXECUTIVE
TABLE 105.CERVÉLO: COMPANY SNAPSHOT
TABLE 106.CERVÉLO: PRODUCT PORTFOLIO
TABLE 107.DOREL INDUSTRIES INC. : KEY EXECUTIVES
TABLE 108.DOREL INDUSTRIES INC. : COMPANY SNAPSHOT
TABLE 109.DOREL INDUSTRIES INC. : OPERATING SEGMENTS
TABLE 110.DOREL INDUSTRIES INC. : PRODUCT PORTFOLIO
TABLE 111.DOREL INDUSTRIES INC. : NET SALES, 2017–2019 ($MILLION)
TABLE 112.GIANT BICYCLES MANUFACTURING CO. LTD.: KEY EXECUTIVES
TABLE 113.GIANT BICYCLES MANUFACTURING CO. LTD.: COMPANY SNAPSHOT
TABLE 114.GIANT BICYCLES: PRODUCT PORTFOLIO
TABLE 115.GIANT BICYCLES: NET SALES, 2017–2019 ($MILLION)
TABLE 116.MERIDA INDUSTRY CO., LTD.: KEY EXECUTIVES
TABLE 117.MERIDA INDUSTRY CO., LTD.: COMPANY SNAPSHOT
TABLE 118.MERIDA INDUSTRY CO., LTD.: OPERATING SEGMENTS
TABLE 119.MERIDA INDUSTRY CO., LTD.: PRODUCT PORTFOLIO
TABLE 120.MERIDA INDUSTRY CO., LTD.: NET SALES, 2017–2019 ($MILLION)
TABLE 121.OLYMPUS BIKES: KEY EXECUTIVES
TABLE 122.OLYMPUS BIKES: COMPANY SNAPSHOT
TABLE 123.OLYMPUS BIKES: PRODUCT PORTFOLIO
TABLE 124.OLYMPUS BIKES: NET SALES, 2017–2019 ($MILLION)
TABLE 125.SCOTT SPORTS SA : KEY EXECUTIVE
TABLE 126.SCOTT SPORTS SA : COMPANY SNAPSHOT
TABLE 127.SCOTT SPORTS SA: OPERATING SEGMENTS
TABLE 128.SCOTT SPORTS SA : PRODUCT PORTFOLIO
TABLE 129.SPECIALIZED BICYCLE COMPONENTS, INC.: KEY EXECUTIVE
TABLE 130.SPECIALIZED BICYCLE COMPONENTS, INC.: COMPANY SNAPSHOT
TABLE 131.SPECIALIZED BICYCLE COMPONENTS, INC.: OPERATING SEGMENTS
TABLE 132.SPECIALIZED BICYCLE COMPONENTS, INC.: PRODUCT PORTFOLIO
TABLE 133.TREK BICYCLE CORPORATION: KEY EXECUTIVES
TABLE 134.TREK BICYCLE CORPORATION: COMPANY SNAPSHOT
TABLE 135.TREK BICYCLE CORPORATION: OPERATING SEGMENTS
TABLE 136.TREK BICYCLE CORPORATION: PRODUCT PORTFOLIO
TABLE 137.KONA BICYCLE COMPANY: KEY EXECUTIVE
TABLE 138.KONA BICYCLE COMPANY: COMPANY SNAPSHOT
TABLE 139.KONA BICYCLE COMPANY: PRODUCT PORTFOLIO
LIST OF FIGURES
FIGURE 01.KEY MARKET SEGMENTS
FIGURE 02.GLOBAL BICYCLE MARKET SNAPSHOT, 2021–2027
FIGURE 03.LOW BARGAINING POWER OF SUPPLIERS
FIGURE 04.LOW BARGAINING POWER OF BUYERS
FIGURE 05.MODERATE THREAT OF SUBSTITUTION
FIGURE 06.LOW THREAT OF NEW ENTRANTS
FIGURE 07.MODERATE INTENSITY OF COMPETITIVE RIVALRY
FIGURE 08.BICYCLE MARKET DRIVERS, RESTRAINTS, AND OPPORTUNITIES
FIGURE 09.COMPARATIVE SHARE ANALYSIS OF CARGO ELECTRIC BIKE MARKET REVENUE, BY TYPE,
2019 & 2027 (%)
FIGURE 10.COMPARATIVE SHARE ANALYSIS OF NON-CARGO ELECTIC BIKE MARKET REVENUE, BY TYPE,
2019 & 2027 (%)
FIGURE 11.COMPARATIVE SHARE ANALYSIS OF CARGO NONELECTRIC BIKE MARKET REVENUE, BY TYPE,
2019 & 2027 (%)
FIGURE 12.COMPARATIVE SHARE ANALYSIS OF NON-CARGO NONELECTRIC BIKE MARKET REVENUE, BY TYPE,
2019 & 2027 (%)
FIGURE 13.COMPARATIVE SHARE ANALYSIS OF BICYCLE MARKET REVENUE FOR ONLINE PLATFORMS,
BY COUNTRY, 2019 & 2027 (%)
FIGURE 14.COMPARATIVE SHARE ANALYSIS OF BICYCLE MARKET REVENUE FOR PHYSICAL STORES, BY COUNTRY,
2019 & 2027 (%)
FIGURE 15.COMPARATIVE SHARE ANALYSIS OF BICYCLE MARKET REVENUE FOR MEN END USER, BY COUNTRY,
2019 & 2027 (%)
FIGURE 16.COMPARATIVE SHARE ANALYSIS OF BICYCLE MARKET REVENUE FOR WOMEN END USER,
BY COUNTRY, 2019 & 2027 (%)
FIGURE 17.COMPARATIVE SHARE ANALYSIS OF BICYCLE MARKET REVENUE FOR KIDS END USER, BY COUNTRY,
2019 & 2027 (%)
FIGURE 18.U.S. BICYCLE MARKET, 2019 & 2027 ($MILLION)
FIGURE 19.CANADA BICYCLE MARKET, 2019 & 2027 ($MILLION)
FIGURE 20.MEXICO BICYCLE MARKET, 2019 & 2027 ($MILLION)
FIGURE 21.GERMANY BICYCLE MARKET, 2019 & 2027 ($MILLION)
FIGURE 22.UK BICYCLE MARKET, 2019 & 2027 ($MILLION)
FIGURE 23.FRANCE BICYCLE MARKET, 2019 & 2027 ($MILLION)
FIGURE 24.ITALY BICYCLE MARKET, 2019 & 2027 ($MILLION)
FIGURE 25.SPAIN BICYCLE MARKET, 2019 & 2027 ($MILLION)
FIGURE 26.RUSSIA BICYCLE MARKET, 2019 & 2027 ($MILLION)
FIGURE 27.NETHERLANDS BICYCLE MARKET, 2019 & 2027 ($MILLION)
FIGURE 28.SWEDEN BICYCLE MARKET, 2019 & 2027 ($MILLION)
FIGURE 29.REST OF EUROPE BICYCLE MARKET, 2019 & 2027 ($MILLION)
FIGURE 30.CHINA BICYCLE MARKET, 2019 & 2027 ($MILLION)
FIGURE 31.INDIA BICYCLE MARKET, 2019 & 2027 ($MILLION)
FIGURE 32.JAPAN BICYCLE MARKET, 2019 & 2027 ($MILLION)
FIGURE 33.AUSTRALIA BICYCLE MARKET, 2019 & 2027 ($MILLION)
FIGURE 34.SOUTH KOREA BICYCLE MARKET, 2019 & 2027 ($MILLION)
FIGURE 35.MALAYSIA BICYCLE MARKET, 2019 & 2027 ($MILLION)
FIGURE 36.INDONESIA BICYCLE MARKET, 2019 & 2027 ($MILLION)
FIGURE 37.REST OF ASIA-PACIFIC BICYCLE MARKET, 2019 & 2027 ($MILLION)
FIGURE 38.LATIN AMERICA BICYCLE MARKET, 2019 & 2027 ($MILLION)
FIGURE 39.MIDDLE EAST BICYCLE MARKET, 2019 & 2027 ($MILLION)
FIGURE 40.AFRICA BICYCLE MARKET, 2019 & 2027 ($MILLION)
FIGURE 41.PRODUCT MAPPING OF TOP 10 KEY PLAYERS
FIGURE 42.COMPETITIVE HEAT MAP OF TOP 10 KEY PLAYERS
FIGURE 43.ACCELL GROUP: NET SALES, 2017–2019 ($MILLION)
FIGURE 44.ACCELL GROUP: REVENUE SHARE BY SEGMENT, 2019 (%)
FIGURE 45.ACCELL GROUP: REVENUE SHARE BY REGION, 2019 (%)
FIGURE 46.DOREL INDUSTRIES INC. : NET SALES, 2017–2019 ($MILLION)
FIGURE 47.DOREL INDUSTRIES INC.: REVENUE SHARE BY SEGMENT, 2019 (%)
FIGURE 48.DOREL INDUSTRIES INC.: REVENUE SHARE BY REGION, 2019 (%)
FIGURE 49.GIANT BICYCLES: NET SALES, 2017–2019 ($MILLION)
FIGURE 50.MERIDA INDUSTRY CO., LTD.: NET SALES, 2017–2019 ($MILLION)
FIGURE 51.OLYMPUS BIKES: NET SALES, 2017-2019 ($MILLION)
$5769
$8995
HAVE A QUERY?
OUR CUSTOMER
