
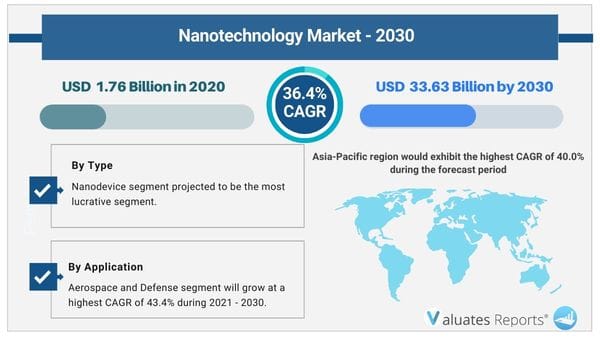
The global nanotechnology market size was valued at $1.76 Billion in 2020, and is projected to reach $33.63 Billion by 2030, registering a CAGR of 36.4% from 2021 to 2030.
Key drivers of the nanotechnology market include the rising use in medical diagnosis and imaging. The huge scope for application in the aerospace and defense industry will fuel the growth of the market in the upcoming years. The rising government funding for R&D initiatives will drive the growth of the market during the forecast period.
Nanoscience and nanotechnology involve the study of nanoparticles and devices, which find their application across all the science fields such as chemical, bio-medical, mechanics, and material science among others. Nanotechnology market encompasses the production and application of physical, chemical, and biological systems and devices at scales ranging from individual atoms or molecules to around 100 nanometers.
Healthcare Industry
Nanomaterials have been developed that are extremely useful in imaging, drug delivery, and medical diagnostic applications. It promotes the development of personalized medicine. Nanoscale sensors and devices aid in the quick detection of cancerous tumors and inflammations. Several researchers are developing nanoparticles that recognize many analytes simultaneously. This will fuel the growth of the nanotechnology market in the forthcoming years. Nanoparticles attach themselves to the particles present in the bloodstream for identifying microvesicles that are present in brain cancer cells. Moreover, nano-level electronic devices are getting developed that help in imaging, sensing, and drug delivery to the targeted cells or tissues. The embedded sensors can find the levels of oxygen, and carbon dioxide and detect food sensitivities. Nanoflares bind the particles to genetic targets in cancer cells and check for toxic elements. Furthermore, nanobots are inserted inside the body for repairing intracellular structures and replacing DNA molecules for disease treatment. The material is also effective in taking biopsy samples and clearing artery blockages by drilling through them.
Aerospace and defense industry
The defense and aviation sector has immense scope for nanotechnology. Lightweight, compact battlesuits are in development for soldiers that are comfortable, protect against contaminants, and are vital for use in tracking. The ship-to-sea communications are passed through specially coated polymer threads of the suits and use encoded signals to gather crucial information against the enemy. Nanomaterial-based devices are calibrated carefully to prevent detection or eavesdropping by enemy units. The extensive research on the material will fuel the growth of the nanotechnology market in the upcoming years. On the other hand aircraft manufacturers are under tremendous pressure to produce lightweight fuel-efficient body parts that reduce carbon emissions. Smart engineered aircraft structures are being developed that are flexible, adaptive, and control the distortion of aerodynamically important surfaces. It maintains the specific airframe area and generates much less noise. Nanoparticles provide improved functionalities related to industrial compressors and turbofan engines. Simply adding the particles in the hydrocarbon fuel can aid in the combustion process thereby increasing fuel efficiency.
Rising government funding
Government authorities around the world are spending huge amounts of money on developing nanomaterials which will positively impact the nanotechnology market growth in the coming years. International private sector funding and venture capitalists are collaborating with multinational firms to do extensive R&D activities in the domain. BRIC nations are planning to establish themselves as nanotechnology hubs. The US government is specifically focused on developing the particles for growing military influence. Several academic and research institutes are gaining enormous state and country-wide funding to develop the proper platform for the technology.
Limitations of the particles
There are certain barriers to the full-scale commercialization of the technology. The particles are difficult to manufacture and expensive. It is toxic to animals. The materials are expected to work under extremely harsh conditions and maintain electromagnetic interference. It gradually leads to a loss of the precision and stability of the materials. It eliminates cross-sensitivities. This will hamper the growth prospects of the nanotechnology market in the coming years. The particles need to maintain strict accuracy specifications in terms of response, force, and displacement times.
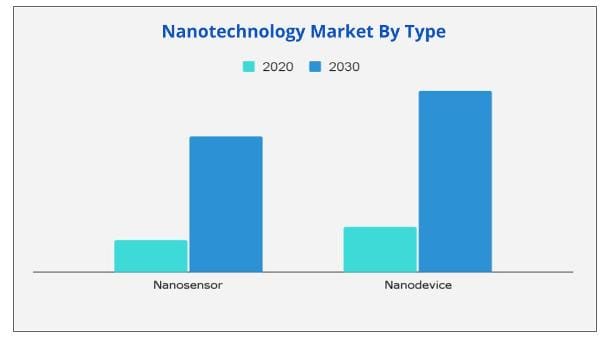
Based on type, the nanodevice segment is expected to dominate in the nanotechnology market share during the forecast period.
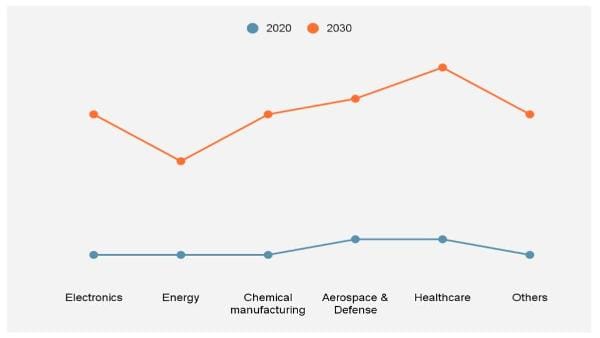
Based on application, the healthcare segment will maintain the lead in the nanotechnology market share due to a variety of applications ranging from targeted drug delivery to cell repair, surgery, and neurodiagnostics. While aerospace and defense will grow at the fastest with a CAGR of 43.4% due to a huge number of R&D initiatives.
Based on region, Asia-Pacific will grow the highest due to extensive funding by manufacturers, governments, and healthcare providers. It will grow at a CAGR of 40%.
Key Benefits For Stakeholders
|
Report Metric |
Details |
|
Base Year: |
2020 |
|
Market Size in 2020: |
USD 1.76 Billion |
|
Forecast Period: |
2021 to 2030 |
|
Forecast Period 2022 to 2031 CAGR: |
36.4% |
|
2030 Value Projection: |
USD 33.63 Billion |
|
No. of Pages: |
248 |
|
Tables & Figures |
61 |
|
Charts |
86 |
|
Segments covered: |
By Type, By Application, and By Region. |
Ans. Emerging use cases and application is expected to be one of the key factors contributing towards the growth of Nanotechnology market during the forecast period.
Ans. The global nanotechnology market size was valued at $1.76 billion in 2020, and is projected to reach $33.63 billion by 2030, registering a CAGR of 36.4% from 2021 to 2030.
Ans. The global Nanotechnology market value was valued at US$ 1.76 billion in 2020.
Ans. Based on Region, Asia-Pacific region would exhibit the highest CAGR of 40.0% during the forecast period
Ans. The forecast period considered for the global Nanotechnology market is 2021 to 2030.
Ans. Based on application, Aerospace and Defense segment will grow at a highest CAGR of 43.4% during 2021 - 2030.
Chapter 1:Introduction
1.1.Report description
1.2.Key benefits for stakeholders
1.3.Key market segments
1.4.Research methodology
1.4.1.Primary research
1.4.2.Secondary research
1.4.3.Analyst tools and models
Chapter 2:Executive Summary
2.1.Key findings
2.1.1.Top impacting factors
2.1.2.Top investment pockets
2.2.CXO perspective
Chapter 3:Market Overview
3.1.Market definition and scope
3.2.Covid-19 impact analysis
3.2.1.COVID-19 Outbreak
3.2.2.Impact on market size
3.2.3.End user trends, preferences, and budget impact
3.2.4.Parent industry impact
3.2.5.Key player strategies to tackle negative impact
3.2.5.1.Limiting cuts to R&D expense:
3.2.5.2.Focusing on next-generation products
3.2.5.3.Shifting toward agile supply chain model
3.2.6.Opportunity window
3.3.Key Forces Shaping Nanotechnology Market
3.4.Patent Analysis
3.4.1.Nanodevices, by Region (2012-2020)
3.4.2.Nanosensor, by Region (2012-2020)
3.4.3.Nanodevices, by applicant
3.4.4.Nanosensor, by Applicant
3.5.Market dynamics
3.5.1.Drivers
3.5.1.1.Surge in adoption of nanotechnology in medical diagnosis
3.5.1.2.Emerging technological advancements in nanotech devices
3.5.2.Restraints
3.5.2.1.Issues pertaining to the deployment of nanotech devices in extreme weather conditions
3.5.2.2.High cost of the technology
3.5.3.Opportunities
3.5.3.1.Increase in government support and funding
3.5.3.2.Emergence of self-powered nanotech devices
Chapter 4:Nanotechnology Market, By Type
4.1.Overview
4.2.Nanosensor
4.2.1.Optical Nanosensor
4.2.2.Chemical Nanosensor
4.2.3.Physical Nanosensor
4.2.4.Biosensors
4.2.5.Others
4.2.6.Key market trends, growth factors, and opportunities
4.2.7.Market size and forecast, by region
4.2.8.Market analysis, by country
4.3.Nanodevice
4.3.1.Nanomanipulator
4.3.2.Nanomechanical test instruments
4.3.3.Nanoscale infrared spectrometers
4.3.4.Key market trends, growth factors, and opportunities
4.3.5.Market size and forecast, by region
4.3.6.Market analysis, by country
Chapter 5:Nanotechnology Market, By Application
5.1.Overview
5.2.Electronics
5.2.1.Key market trends, growth factors, and opportunities
5.2.2.Market size and forecast, by region
5.2.3.Market analysis, by country
5.3.Energy
5.3.1.Key market trends, growth factors, and opportunities
5.3.2.Market size and forecast, by region
5.3.3.Market analysis, by country
5.4.Chemical manufacturing
5.4.1.Key market trends, growth factors, and opportunities
5.4.2.Market size and forecast, by region
5.4.3.Market analysis, by country
5.5.Aerospace & defense
5.5.1.Key market trends, growth factors, and opportunities
5.5.2.Market size and forecast, by region
5.5.3.Market analysis, by country
5.6.Healthcare
5.6.1.Key market trends, growth factors, and opportunities
5.6.2.Market size and forecast, by region
5.6.3.Market analysis, by country
5.7.Others
5.7.1.Key market trends, growth factors, and opportunities
5.7.2.Market size and forecast, by region
5.7.3.Market analysis, by country
Chapter 6:Nanotechnology Market, By Region
6.1.Overview
6.2.North America
6.2.1.Key market trends, growth factors, and opportunities
6.2.2.Market size and forecast, by type
6.2.3.Market size and forecast, by application
6.2.4.Market analysis, by country
6.2.4.1.U.S.
6.2.4.1.1.Market size and forecast, by type
6.2.4.1.2.Market size and forecast, by application
6.2.4.2.Canada
6.2.4.2.1.Market size and forecast, by type
6.2.4.2.2.Market size and forecast, by application
6.2.4.3.Mexico
6.2.4.3.1.Market size and forecast, by type
6.2.4.3.2.Market size and forecast, by application
6.3.Europe
6.3.1.Key market trends, growth factors, and opportunities
6.3.2.Market size and forecast, by type
6.3.3.Market size and forecast, by application
6.3.4.Market analysis, by country
6.3.4.1.UK
6.3.4.1.1.Market size and forecast, by type
6.3.4.1.2.Market size and forecast, by application
6.3.4.2.Germany
6.3.4.2.1.Market size and forecast, by type
6.3.4.2.2.Market size and forecast, by application
6.3.4.3.Russia
6.3.4.3.1.Market size and forecast, by type
6.3.4.3.2.Market size and forecast, by application
6.3.4.4.Rest of Europe
6.3.4.4.1.Market size and forecast, by type
6.3.4.4.2.Market size and forecast, by application
6.4.Asia-Pacific
6.4.1.Key market trends, growth factors, and opportunities
6.4.2.Market size and forecast, by type
6.4.3.Market size and forecast, by application
6.4.4.Market analysis, by country
6.4.4.1.China
6.4.4.1.1.Market size and forecast, by type
6.4.4.1.2.Market size and forecast, by application
6.4.4.2.India
6.4.4.2.1.Market size and forecast, by type
6.4.4.2.2.Market size and forecast, by application
6.4.4.3.Japan
6.4.4.3.1.Market size and forecast, by type
6.4.4.3.2.Market size and forecast, by application
6.4.4.4.Australia
6.4.4.4.1.Market size and forecast, by type
6.4.4.4.2.Market size and forecast, by application
6.4.4.5.Rest of Asia-Pacific
6.4.4.5.1.Market size and forecast, by type
6.4.4.5.2.Market size and forecast, by application
6.5.LAMEA
6.5.1.Key market trends, growth factors, and opportunities
6.5.2.Market size and forecast, by type
6.5.3.Market size and forecast, by application
6.5.4.Market analysis, by country
6.5.4.1.Latin America
6.5.4.1.1.Market size and forecast, by type
6.5.4.1.2.Market size and forecast, by application
6.5.4.2.Middle East
6.5.4.2.1.Market size and forecast, by type
6.5.4.2.2.Market size and forecast, by application
6.5.4.3.Africa
6.5.4.3.1.Market size and forecast, by type
6.5.4.3.2.Market size and forecast, by application
Chapter 7:Competitive Landscape
7.1.Introduction
7.2.Top winning strategies
7.2.1.Top winning strategies, by year
7.2.2.Top winning strategies, by development
7.2.3.Top winning strategies, by company
Chapter 8:Company Profile
8.1.Altair Nanotechnologies Inc. (Canon Investment Holdings Limited)
8.1.1.Company overview
8.1.2.Key executives
8.1.3.Company snapshot
8.1.4.Product portfolio
8.2.Applied Nanotech, Inc. (Nano Magic Holdings Inc.)
8.2.1.Company overview
8.2.2.Key executives
8.2.3.Company snapshot
8.2.4.Operating business segments
8.2.5.Product portfolio
8.2.6.R&D expenditure
8.2.7.Business performance
8.3.Advanced Nano Products Co., Ltd.
8.3.1.Company overview
8.3.2.Key executives
8.3.3.Company snapshot
8.3.4.Product portfolio
8.3.5.Business performance
8.4.Bruker Corporation
8.4.1.Company overview
8.4.2.Key executives
8.4.3.Company snapshot
8.4.4.Operating business segments
8.4.5.Product portfolio
8.4.6.R&D expenditure
8.4.7.Business performance
8.4.8.Key strategic moves and developments
8.5.Biosensors International Group, Ltd. (Bluesail Medical Co., Ltd.)
8.5.1.Company overview
8.5.2.Key executives
8.5.3.Company snapshot
8.5.4.Product portfolio
8.5.5.R&D expenditure
8.5.6.Business performance
8.5.7.Key strategic moves and developments
8.6.eSpin Technologies, Inc.
8.6.1.Company overview
8.6.2.Key executives
8.6.3.Company snapshot
8.6.4.Product portfolio
8.7.Imina Technologies SA
8.7.1.Company overview
8.7.2.Key executives
8.7.3.Company snapshot
8.7.4.Product portfolio
8.7.5.Key strategic moves and developments
8.8.Kleindiek Nanotechnik GmbH
8.8.1.Company overview
8.8.2.Key executives
8.8.3.Company snapshot
8.8.4.Product portfolio
8.9.NANONICS IMAGING Ltd.
8.9.1.Company overview
8.9.2.Key executives
8.9.3.Company snapshot
8.9.4.Product portfolio
8.10.Thermo Fisher Scientific Inc.
8.10.1.Company overview
8.10.2.Key executives
8.10.3.Company snapshot
8.10.4.Operating business segments
8.10.5.Product portfolio
8.10.6.R&D expenditure
8.10.7.Business performance
8.10.8.Key strategic moves and developments
LIST OF TABLES
TABLE 01.GLOBAL NANOTECHNOLOGY MARKET, BY TYPE, 2020-2030 ($MILLION)
TABLE 02.NANOTECHNOLOGY MARKET REVENUE FOR NANOSENSOR, BY REGION 2020-2030 ($MILLION)
TABLE 03.NANOTECHNOLOGY MARKET REVENUE FOR NANODEVICE, BY REGION 2020–2030($MILLION)
TABLE 04.GLOBAL NANOTECHNOLOGY MARKET REVENUE, BY APPLICATION, 2020-2030 ($MILLION)
TABLE 05.NANOTECHNOLOGY MARKET REVENUE FOR ELECTRONICS, BY REGION 2020–2030($MILLION)
TABLE 06.NANOTECHNOLOGY MARKET REVENUE FOR ENERGY, BY REGION 2020–2030($MILLION)
TABLE 07.NANOTECHNOLOGY MARKET REVENUE FOR CHEMICAL MANUFACTURING, BY REGION 2020–2030($MILLION)
TABLE 08.NANOTECHNOLOGY MARKET REVENUE FOR AEROSPACE & DEFENSE, BY REGION 2020–2030($MILLION)
TABLE 09.NANOTECHNOLOGY MARKET REVENUE FOR HEALTHCARE, BY REGION 2020–2030($MILLION)
TABLE 10.NANOTECHNOLOGY MARKET REVENUE FOR OTHERS, BY REGION 2020–2030($MILLION)
TABLE 11.GLOBAL NANOTECHNOLOGY MARKET REVENUE, BY REGION, 2020–2030 ($MILLION)
TABLE 12.NORTH AMERICA NANOTECHNOLOGY MARKET REVENUE, BY TYPE 2020–2030($MILLION)
TABLE 13.NORTH AMERICA NANOTECHNOLOGY MARKET REVENUE, BY APPLICATION 2020–2030($MILLION)
TABLE 14.U.S. NANOTECHNOLOGY MARKET REVENUE, BY TYPE 2020–2030($MILLION)
TABLE 15.U.S. NANOTECHNOLOGY MARKET REVENUE, BY APPLICATION 2020–2030($MILLION)
TABLE 16.CANADA NANOTECHNOLOGY MARKET REVENUE, BY TYPE 2020–2030($MILLION)
TABLE 17.CANADA NANOTECHNOLOGY MARKET REVENUE, BY APPLICATION 2020–2030($MILLION)
TABLE 18.MEXICO NANOTECHNOLOGY MARKET REVENUE, BY TYPE 2020-2030 ($MILLION)
TABLE 19.MEXICO NANOTECHNOLOGY MARKET REVENUE, BY APPLICATION 2020–2030($MILLION)
TABLE 20.EUROPE NANOTECHNOLOGY MARKET REVENUE, BY TYPE 2020–2030($MILLION)
TABLE 21.EUROPE NANOTECHNOLOGY MARKET REVENUE, BY APPLICATION 2020–2030($MILLION)
TABLE 22.UK NANOTECHNOLOGY MARKET REVENUE, BY TYPE 2020–2030($MILLION)
TABLE 23.UK NANOTECHNOLOGY MARKET REVENUE, BY APPLICATION 2020–2030($MILLION)
TABLE 24.GERMANY NANOTECHNOLOGY MARKET REVENUE, BY TYPE 2020–2030($MILLION)
TABLE 25.GERMANY NANOTECHNOLOGY MARKET REVENUE, BY APPLICATION 2020–2030($MILLION)
TABLE 26.RUSSIA NANOTECHNOLOGY MARKET REVENUE, BY TYPE 2020–2030($MILLION)
TABLE 27.RUSSIA NANOTECHNOLOGY MARKET REVENUE, BY APPLICATION 2020–2030($MILLION)
TABLE 28.REST OF EUROPE NANOTECHNOLOGY MARKET REVENUE, BY TYPE 2020–2030($MILLION)
TABLE 29.REST OF EUROPE NANOTECHNOLOGY MARKET REVENUE, BY APPLICATION 2020–2030($MILLION)
TABLE 30.ASIA-PACIFIC NANOTECHNOLOGY MARKET REVENUE, BY TYPE 2020–2030($MILLION)
TABLE 31.ASIA-PACIFIC NANOTECHNOLOGY MARKET REVENUE, BY APPLICATION 2020–2030($MILLION)
TABLE 32.CHINA NANOTECHNOLOGY MARKET REVENUE, BY TYPE 2020–2030($MILLION)
TABLE 33.CHINA NANOTECHNOLOGY MARKET REVENUE, BY APPLICATION 2020–2030($MILLION)
TABLE 34.INDIA NANOTECHNOLOGY MARKET REVENUE, BY TYPE 2020–2030($MILLION)
TABLE 35.INDIA NANOTECHNOLOGY MARKET REVENUE, BY APPLICATION 2020–2030($MILLION)
TABLE 36.JAPAN NANOTECHNOLOGY MARKET REVENUE, BY TYPE 2020–2030($MILLION)
TABLE 37.JAPAN NANOTECHNOLOGY MARKET REVENUE, BY APPLICATION 2020–2030($MILLION)
TABLE 38.AUSTRALIA NANOTECHNOLOGY MARKET REVENUE, BY TYPE 2020–2030($MILLION)
TABLE 39.AUSTRALIA NANOTECHNOLOGY MARKET REVENUE, BY APPLICATION 2020–2030($MILLION)
TABLE 40.REST OF ASIA-PACIFIC NANOTECHNOLOGY MARKET REVENUE, BY TYPE 2020–2030($MILLION)
TABLE 41.REST OF ASIA-PACIFIC NANOTECHNOLOGY MARKET REVENUE, BY APPLICATION 2020–2030($MILLION)
TABLE 42.LAMEA NANOTECHNOLOGY MARKET REVENUE, BY TYPE 2020–2030($MILLION)
TABLE 43.LAMEA NANOTECHNOLOGY MARKET REVENUE, BY APPLICATION 2020–2030($MILLION)
TABLE 44.LATIN AMERICA NANOTECHNOLOGY MARKET REVENUE, BY TYPE 2020–2030($MILLION)
TABLE 45.LATIN AMERICA NANOTECHNOLOGY MARKET REVENUE, BY APPLICATION 2020–2030($MILLION)
TABLE 46.MIDDLE EAST NANOTECHNOLOGY MARKET REVENUE, BY TYPE 2020–2030($MILLION)
TABLE 47.MIDDLE EAST NANOTECHNOLOGY MARKET REVENUE, BY APPLICATION 2020–2030($MILLION)
TABLE 48.AFRICA NANOTECHNOLOGY MARKET REVENUE, BY TYPE 2020–2030($MILLION)
TABLE 49.AFRICA NANOTECHNOLOGY MARKET REVENUE, BY APPLICATION 2020–2030($MILLION)
TABLE 50.ALTAIR NANOTECHNOLOGIES INC.:KEY EXECUTIVES
TABLE 51.ALTAIR NANOTECHNOLOGIES INC.: COMPANY SNAPSHOT
TABLE 52.ALTAIR NANOTECHNOLOGIES INC.: PRODUCT PORTFOLIO
TABLE 53.NANO MAGIC HOLDINGS INC.:KEY EXECUTIVES
TABLE 54.APPLIED NANOTECH, INC.: COMPANY SNAPSHOT
TABLE 55.NANO MAGIC HOLDINGS INC.: OPERATING SEGMENTS
TABLE 56.APPLIED NANOTECH, INC.: PRODUCT PORTFOLIO
TABLE 57.ADVANCED NANO PRODUCTS CO., LTD.:KEY EXECUTIVES
TABLE 58.ADVANCED NANO PRODUCTS CO., LTD.: COMPANY SNAPSHOT
TABLE 59.ADVANCED NANO PRODUCTS CO., LTD.: PRODUCT PORTFOLIO
TABLE 60.BRUKER CORPORATION:KEY EXECUTIVES
TABLE 61.BRUKER CORPORATION: COMPANY SNAPSHOT
TABLE 62.BRUKER CORPORATION: OPERATING SEGMENTS
TABLE 63.BRUKER CORPORATION: PRODUCT PORTFOLIO
TABLE 64.BRUKER CORPORATION: KEY STRATEGIC MOVES AND DEVELOPMENTS
TABLE 65.BLUESAIL MEDICAL CO., LTD.:KEY EXECUTIVES
TABLE 66.BIOSENSORS INTERNATIONAL GROUP, LTD.: COMPANY SNAPSHOT
TABLE 67.BIOSENSORS INTERNATIONAL GROUP, LTD.: PRODUCT PORTFOLIO
TABLE 68.BIOSENSORS INTERNATIONAL GROUP, LTD.: KEY STRATEGIC MOVES AND DEVELOPMENTS
TABLE 69.ESPIN TECHNOLOGIES, INC.:KEY EXECUTIVES
TABLE 70.ESPIN TECHNOLOGIES, INC.: COMPANY SNAPSHOT
TABLE 71.ESPIN TECHNOLOGIES, INC.: PRODUCT PORTFOLIO
TABLE 72.IMINA TECHNOLOGIES SA:KEY EXECUTIVES
TABLE 73.IMINA TECHNOLOGIES SA: COMPANY SNAPSHOT
TABLE 74.IMINA TECHNOLOGIES SA: PRODUCT PORTFOLIO
TABLE 75.IMINA TECHNOLOGIES SA: KEY STRATEGIC MOVES AND DEVELOPMENTS
TABLE 76.KLEINDIEK NANOTECHNIK GMBH:KEY EXECUTIVES
TABLE 77.KLEINDIEK NANOTECHNIK GMBH: COMPANY SNAPSHOT
TABLE 78.KLEINDIEK NANOTECHNIK GMBH: PRODUCT PORTFOLIO
TABLE 79.NANONICS IMAGING LTD.:KEY EXECUTIVES
TABLE 80.NANONICS IMAGING LTD.: COMPANY SNAPSHOT
TABLE 81.NANONICS IMAGING LTD.: PRODUCT PORTFOLIO
TABLE 82.THERMO FISHER SCIENTIFIC INC.:KEY EXECUTIVES
TABLE 83.THERMO FISHER SCIENTIFIC INC.: COMPANY SNAPSHOT
TABLE 84.THERMO FISHER SCIENTIFIC INC.: OPERATING SEGMENTS
TABLE 85.THERMO FISHER SCIENTIFIC INC.: PRODUCT PORTFOLIO
TABLE 86.THERMO FISHER SCIENTIFIC INC.: KEY STRATEGIC MOVES AND DEVELOPMENTS
LIST OF FIGURES
FIGURE 01.KEY MARKET SEGMENTS
FIGURE 02.EXECUTIVE SUMMARY
FIGURE 03.EXECUTIVE SUMMARY
FIGURE 04.TOP IMPACTING FACTORS
FIGURE 05.TOP INVESTMENT POCKETS
FIGURE 06.LOW-TO-HIGH BARGAINING POWER OF SUPPLIERS
FIGURE 07.MODERATE-TO-HIGH THREAT OF NEW ENTRANTS
FIGURE 08.MODERATE THREAT OF SUBSTITUTES
FIGURE 09.MODERATE INTENSITY OF RIVALRY
FIGURE 10.LOW-TO-MODERATE BARGAINING POWER OF BUYERS
FIGURE 11.PATENT ANALYSIS, BY REGION
FIGURE 12.PATENT ANALYSIS, BY REGION
FIGURE 13.PATENT ANALYSIS, BY APPLICANT
FIGURE 14.PATENT ANALYSIS, BY APPLICANT
FIGURE 15.GLOBAL NANOTECHNOLOGY MARKET, BY TYPE, 2020-2030
FIGURE 16.COMPARATIVE SHARE ANALYSIS OF NANOSENSOR NANOTECHNOLOGY MARKET, BY COUNTRY, 2020 & 2030 (%)
FIGURE 17.COMPARATIVE SHARE ANALYSIS OF NANODEVICE NANOTECHNOLOGY MARKET, BY COUNTRY, 2020 & 2030 (%)
FIGURE 18.GLOBAL NANOTECHNOLOGY MARKET, BY APPLICATION, 2020-2030
FIGURE 19.COMPARATIVE SHARE ANALYSIS OF ELECTRONICS NANOTECHNOLOGY MARKET, BY COUNTRY, 2020 & 2030 (%)
FIGURE 20.COMPARATIVE SHARE ANALYSIS OF ENERGY NANOTECHNOLOGY MARKET, BY COUNTRY, 2020 & 2030 (%)
FIGURE 21.COMPARATIVE SHARE ANALYSIS OF CHEMICAL MANUFACTURING NANOTECHNOLOGY MARKET, BY COUNTRY, 2020 & 2030 (%)
FIGURE 22.COMPARATIVE SHARE ANALYSIS OF AEROSPACE & DEFENSE NANOTECHNOLOGY MARKET, BY COUNTRY, 2020 & 2030 (%)
FIGURE 23.COMPARATIVE SHARE ANALYSIS OF HEALTHCARE NANOTECHNOLOGY MARKET, BY COUNTRY, 2020 & 2030 (%)
FIGURE 24.COMPARATIVE SHARE ANALYSIS OF OTHERS NANOTECHNOLOGY MARKET, BY COUNTRY, 2020 & 2030 (%)
FIGURE 25.GLOBAL NANOTECHNOLOGY MARKET, BY APPLICATION, 2020-2030
FIGURE 26.NORTH AMERICA NANOTECHNOLOGY MARKET, BY COUNTRY, 2020-2030
FIGURE 27.U.S. NANOTECHNOLOGY MARKET REVENUE, 2020-2030($MILLION)
FIGURE 28.CANADA NANOTECHNOLOGY MARKET REVENUE, 2020-2030 ($MILLION)
FIGURE 29.MEXICO NANOTECHNOLOGY MARKET REVENUE, 2020-2030 ($MILLION)
FIGURE 30.EUROPE NANOTECHNOLOGY MARKET, BY COUNTRY, 2020-2030
FIGURE 31.UK NANOTECHNOLOGY MARKET REVENUE, 2020-2030 ($MILLION)
FIGURE 32.GERMANY NANOTECHNOLOGY MARKET REVENUE, 2020-2030 ($MILLION)
FIGURE 33.RUSSIA NANOTECHNOLOGY MARKET REVENUE, 2020-2030 ($MILLION)
FIGURE 34.REST OF EUROPE NANOTECHNOLOGY MARKET REVENUE, 2020-2030 ($MILLION)
FIGURE 35.ASIA-PACIFIC NANOTECHNOLOGY MARKET, BY COUNTRY, 2020-2030
FIGURE 36.CHINA NANOTECHNOLOGY MARKET REVENUE, 2020-2030 ($MILLION)
FIGURE 37.INDIA NANOTECHNOLOGY MARKET REVENUE, 2020-2030 ($MILLION)
FIGURE 38.JAPAN NANOTECHNOLOGY MARKET REVENUE, 2020-2030 ($MILLION)
FIGURE 39.AUSTRALIA NANOTECHNOLOGY MARKET REVENUE, 2020-2030 ($MILLION)
FIGURE 40.REST OF ASIA-PACIFIC NANOTECHNOLOGY MARKET REVENUE, 2020-2030 ($MILLION)
FIGURE 41.LAMEA NANOTECHNOLOGY MARKET, BY COUNTRY, 2020-2030
FIGURE 42.LATIN AMERICA NANOTECHNOLOGY MARKET REVENUE, 2020-2030 ($MILLION)
FIGURE 43.MIDDLE EAST NANOTECHNOLOGY MARKET REVENUE, 2020-2030($MILLION)
FIGURE 44.AFRICA NANOTECHNOLOGY MARKET REVENUE, 2020-2030 ($MILLION)
FIGURE 45.TOP WTOP WINNING STRATEGIES, BY YEAR, 2018–2021
FIGURE 46.TOP WINNING STRATEGIES, BY DEVELOPMENT, 2018–2021 (%)
FIGURE 47.TOP WINNING STRATEGIES, BY COMPANY, 2018–2021
FIGURE 48.NANO MAGIC HOLDINGS INC.: R&D EXPENDITURE, 2018–2020 ($MILLION)
FIGURE 49.NANO MAGIC HOLDINGS INC.: NET SALES, 2018–2020 ($MILLION)
FIGURE 50.NANO MAGIC HOLDINGS INC.: REVENUE SHARE BY SEGMENT, 2020 (%)
FIGURE 51.ADVANCED NANO PRODUCTS CO., LTD.: REVENUE, 2018–2020 ($MILLION)
FIGURE 52.BRUKER CORPORATION: R&D EXPENDITURE, 2018–2020 ($MILLION)
FIGURE 53.BRUKER CORPORATION: REVENUE, 2018–2020 ($MILLION)
FIGURE 54.BRUKER CORPORATION: REVENUE SHARE, BY SEGMENT, 2020 (%)
FIGURE 55.BRUKER CORPORATION: REVENUE SHARE, BY REGION, 2020 (%)
FIGURE 56.BLUESAIL MEDICAL CO., LTD.: R&D EXPENDITURE, 2018–2020 ($MILLION)
FIGURE 57.BLUESAIL MEDICAL CO., LTD.: REVENUE, 2018–2020 ($MILLION)
FIGURE 58.THERMO FISHER SCIENTIFIC INC.: R&D EXPENDITURE, 2018–2020 ($MILLION)
FIGURE 59.THERMO FISHER SCIENTIFIC INC.: REVENUE, 2018–2020 ($MILLION)
FIGURE 60.THERMO FISHER SCIENTIFIC INC.: REVENUE SHARE, BY SEGMENT, 2020 (%)
FIGURE 61.THERMO FISHER SCIENTIFIC INC.: REVENUE SHARE, BY REGION, 2020 (%)
$5760
$8518
HAVE A QUERY?
OUR CUSTOMER
