
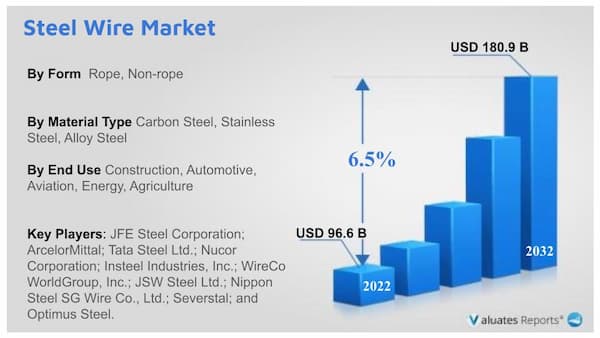
The global steel wire market was valued at USD 96.6 Billion in 2022, and is projected to reach USD 180.9 Billion by 2032, growing at a CAGR of 6.5% from 2023 to 2032.
Steel wires are cylindrically stretched metal structures that can be solid, twisted or braided. An alloy of manganese, iron, carbon, and silicon is used for their production. They can be produced in multiple shapes such as round, square, and rectangular. Steel wires have many different physical properties including high tensile strength, flexibility, higher modulus and lower contact pressure. Steel cables, wire mesh and wire mesh are often made from steel wires. Steel wires are therefore widely used in industry, construction, aerospace and automotive. They are available in numerous forms such as carbon steel, alloy steel , and stainless steel. With the development of infrastructure in emerging countries, the demand for steel wire is increasing.
Increase in demand for steel wire from construction, automotive, aviation, energy, and agriculture industries is driving the steel wire market growth.
Government spending on the construction sector is enormous. There are many new government initiatives related to the construction sector, including initiatives to build new roads and bridges. The use of steel wire has grown with the construction of suspension bridges to improve infrastructure and connectivity. The roadway is supported by suspended steel cables and any load applied to the bridge causes stress on the steel cables. Because of their high tensile strength, flexibility, toughness under adverse conditions, and high resilience, these wires are used in suspension bridge cables. Steel wire is crucial for the production of viaducts, slabs, aqueducts, silos, suspensions, skyscrapers, river domes, railways, and nuclear reactors, as well as for the construction of railway sleepers and high-rise buildings. The demand for steel wire for these applications is likely to increase during the forecast period.
In the automotive sector, the need for safety coupled with robustness, performance, efficiency, and low weight is constantly growing. By meeting these needs, stainless steel is at the forefront of automotive design. This material makes up about 45-50% of all exhaust systems in the automotive industry. Also, steel wires are used in control cables, including brake cables, throttle cables, and clutch cables. These wires provide reliable operation of control systems, delivering high tensile strength and resistance to corrosion and wear. Besides, steel wires are used in seating systems, including support structures and seat frames. They offer durability, strength, and structural integrity to automotive seats. In addition, steel wires offer the required durability, strength, and versatility in order to meet the challenging requirements of automotive applications, making them a critical component in the production of vehicles.
However, there are several alternatives or substitutes to steel wire, which can hinder market growth. Aluminum wire is a lightweight alternative to steel wire. It has excellent conductivity and hence it is widely used in electrical wiring applications. Also, copper wire is another common alternative to steel wire and has excellent electrical conductivity. It is widely used in wiring for electronics, power transmission, and telecommunications. Various synthetic fibers, including polyester, nylon, and polypropylene can be used as alternatives to steel wire in certain applications. Synthetic fibers are flexible, lightweight, and resistant to corrosion, making them ideal for uses such as netting and webbing.
Nevertheless, the surge in technological advancement is expected to create ample growth opportunities during the forecast period. Different coating materials, including zinc and ceramic coatings, are used to shield the steel wires from environmental factors, extend their lifespan, and maintain their performance over time. Also, nanotechnology has contributed to the development of nanostructured steel wire. Nanocoatings and nanoparticle reinforcements are widely used to enhance the longevity and performance of steel wire.
The steel wire market is segmented on the basis of form, material type, end use, and region. On the basis of form, the market is bifurcated into rope and non-rope. On the basis of material type, the market is categorized into carbon steel, stainless steel, alloy steel, and others. On the basis of end use, the market is categorized into construction, automotive, aviation, energy, agriculture, and others. On the basis of region, the steel wire market share is analyzed across North America, Europe, Asia-Pacific, and LAMEA.
Asia-Pacific was the highest revenue contributor to the market in 2022. The growth of the region is mainly attributable to the presence of raw material suppliers, producers, and end-users. The key manufacturers in the region are expanding their production in order to cater to domestic customers as well as international demand. For example, in October 2021, India-based Rajratan Global Wire Limited announced the construction of a 60 kilotons annual capacity production facility in Chennai, Tamil Nadu to cater to the markets in Europe and the U.S. along with domestic demand. The company manufactures tire beads and high-carbon steel wire.
Rope segment was the highest revenue contributor to the market in 2022. Wire ropes usually consist of high-strength carbon steel wires. Steel wire ropes are utilized for transmission of mechanical power and for lifting and hoisting in cranes and elevators. Besides, steel wire ropes are used to transmit force in mechanisms, such as the control surfaces of an aircraft connected to levers and pedals in the cockpit.
Furthermore, steel wire ropes are developed for high tensile strength in order to resist high loads. Besides, steel wire rope provides flexibility in order to conform to the shape of pulley blocks, or other equipment without deforming.
Carbon steel segment was the highest revenue contributor to the market in 2022. Carbon steel wire is used in the construction industry for reinforcing concrete structures. It is widely used to fabricate welded wire mesh and pre-stressed concrete products, delivering strength and stability to buildings, highways, bridges, and other infrastructure projects.
Furthermore, carbon steel wire is utilized in a wide range of production processes and industrial applications. It is used to produce springs, cables, ropes, wire mesh, fasteners, wire forms, and various types of wire products.
Construction segment was the highest revenue contributor to the market in 2022. Steel wires are used in pre-stressed concrete, which is extensively used in bridges, parking structures, and high-rise buildings. Also, it is used to design a framework for supporting lighting fixtures, ceiling tiles, and acoustic panels. It is also used for suspended ceilings and partitions.
Moreover, steel wire mesh is used for a range of construction applications. It is used for providing stability to slopes or embankments, reinforcing plaster or stucco walls, preventing cracks in concrete pavements, and creating safety barriers. Further, steel wire ropes and cables are important for lifting, rigging, and suspension applications on construction sites. They are utilized for cranes, elevators, hoists, and temporary structures.
Key players in the steel wire industry include JFE Steel Corporation; ArcelorMittal; Tata Steel Ltd.; Nucor Corporation; Insteel Industries, Inc.; WireCo WorldGroup, Inc.; JSW Steel Ltd.; Nippon Steel SG Wire Co., Ltd.; Severstal; and Optimus Steel.
| Report Metric | Details |
| Report Name | Steel Wire Market |
| Segment by Form |
|
| Segment by Material Type |
|
| Segment by End User |
|
| Production by Region |
|
| Consumption by Region |
|
| By Company | JSW Steel Ltd., Insteel Industries, Inc., ArcelorMittal, NIPPON STEEL SG WIRE CO.,LTD., Optimus Steel, Severstal, WireCo WorldGroup, Inc., JFE Steel Corporation, Nucor Corporation, Tata Steel Ltd. |
| Forecast units | USD million in value |
| Report coverage | Revenue and volume forecast, company share, competitive landscape, growth factors and trends |
Chapter 1 : INTRODUCTION
1.1. Report description
1.2. Key market segments
1.3. Key benefits to the stakeholders
1.4. Research Methodology
1.4.1. Primary research
1.4.2. Secondary research
Chapter 2 : EXECUTIVE SUMMARY
2.1. CXO Perspective
Chapter 3 : MARKET OVERVIEW
3.1. Market definition and scope
3.2. Key findings
3.2.1. Top impacting factors
3.2.2. Top investment pockets
3.3. Porter’s five forces analysis
3.3.1. Low bargaining power of suppliers
3.3.2. Low threat of new entrants
3.3.3. Low threat of substitutes
3.3.4. Low intensity of rivalry
3.3.5. Low bargaining power of buyers
3.4. Market dynamics
3.4.1. Drivers
3.4.1.1. Surge in demand for steel wires in the construction industry
3.4.1.2. Increase in adoption of steel wires in automobiles
3.4.2. Restraints
3.4.2.1. Availability of substitutes
3.4.3. Opportunities
3.4.3.1. Increase in technological advancement and innovation
3.5. COVID-19 Impact Analysis on the market
3.6. Pricing Analysis
3.7. Key Regulation Analysis
3.8. Patent Landscape
3.9. Impact Analysis of Russia-Ukraine War
Chapter 4 : STEEL WIRE MARKET, BY FORM
4.1. Overview
4.1.1. Market size and forecast
4.2. Rope
4.2.1. Key market trends, growth factors and opportunities
4.2.2. Market size and forecast, by region
4.2.3. Market share analysis by country
4.3. Non-rope
4.3.1. Key market trends, growth factors and opportunities
4.3.2. Market size and forecast, by region
4.3.3. Market share analysis by country
Chapter 5 : STEEL WIRE MARKET, BY MATERIAL TYPE
5.1. Overview
5.1.1. Market size and forecast
5.2. Carbon Steel
5.2.1. Key market trends, growth factors and opportunities
5.2.2. Market size and forecast, by region
5.2.3. Market share analysis by country
5.3. Stainless Steel
5.3.1. Key market trends, growth factors and opportunities
5.3.2. Market size and forecast, by region
5.3.3. Market share analysis by country
5.4. Alloy Steel
5.4.1. Key market trends, growth factors and opportunities
5.4.2. Market size and forecast, by region
5.4.3. Market share analysis by country
5.5. Others
5.5.1. Key market trends, growth factors and opportunities
5.5.2. Market size and forecast, by region
5.5.3. Market share analysis by country
Chapter 6 : STEEL WIRE MARKET, BY END-USE
6.1. Overview
6.1.1. Market size and forecast
6.2. Construction
6.2.1. Key market trends, growth factors and opportunities
6.2.2. Market size and forecast, by region
6.2.3. Market share analysis by country
6.3. Automotive
6.3.1. Key market trends, growth factors and opportunities
6.3.2. Market size and forecast, by region
6.3.3. Market share analysis by country
6.4. Aviation
6.4.1. Key market trends, growth factors and opportunities
6.4.2. Market size and forecast, by region
6.4.3. Market share analysis by country
6.5. Energy
6.5.1. Key market trends, growth factors and opportunities
6.5.2. Market size and forecast, by region
6.5.3. Market share analysis by country
6.6. Agriculture
6.6.1. Key market trends, growth factors and opportunities
6.6.2. Market size and forecast, by region
6.6.3. Market share analysis by country
6.7. Others
6.7.1. Key market trends, growth factors and opportunities
6.7.2. Market size and forecast, by region
6.7.3. Market share analysis by country
Chapter 7 : STEEL WIRE MARKET, BY REGION
7.1. Overview
7.1.1. Market size and forecast By Region
7.2. North America
7.2.1. Key trends and opportunities
7.2.2. Market size and forecast, by Form
7.2.3. Market size and forecast, by Material Type
7.2.4. Market size and forecast, by End-use
7.2.5. Market size and forecast, by country
7.2.5.1. U.S.
7.2.5.1.1. Key market trends, growth factors and opportunities
7.2.5.1.2. Market size and forecast, by Form
7.2.5.1.3. Market size and forecast, by Material Type
7.2.5.1.4. Market size and forecast, by End-use
7.2.5.2. Canada
7.2.5.2.1. Key market trends, growth factors and opportunities
7.2.5.2.2. Market size and forecast, by Form
7.2.5.2.3. Market size and forecast, by Material Type
7.2.5.2.4. Market size and forecast, by End-use
7.2.5.3. Mexico
7.2.5.3.1. Key market trends, growth factors and opportunities
7.2.5.3.2. Market size and forecast, by Form
7.2.5.3.3. Market size and forecast, by Material Type
7.2.5.3.4. Market size and forecast, by End-use
7.3. Europe
7.3.1. Key trends and opportunities
7.3.2. Market size and forecast, by Form
7.3.3. Market size and forecast, by Material Type
7.3.4. Market size and forecast, by End-use
7.3.5. Market size and forecast, by country
7.3.5.1. Germany
7.3.5.1.1. Key market trends, growth factors and opportunities
7.3.5.1.2. Market size and forecast, by Form
7.3.5.1.3. Market size and forecast, by Material Type
7.3.5.1.4. Market size and forecast, by End-use
7.3.5.2. France
7.3.5.2.1. Key market trends, growth factors and opportunities
7.3.5.2.2. Market size and forecast, by Form
7.3.5.2.3. Market size and forecast, by Material Type
7.3.5.2.4. Market size and forecast, by End-use
7.3.5.3. Italy
7.3.5.3.1. Key market trends, growth factors and opportunities
7.3.5.3.2. Market size and forecast, by Form
7.3.5.3.3. Market size and forecast, by Material Type
7.3.5.3.4. Market size and forecast, by End-use
7.3.5.4. UK
7.3.5.4.1. Key market trends, growth factors and opportunities
7.3.5.4.2. Market size and forecast, by Form
7.3.5.4.3. Market size and forecast, by Material Type
7.3.5.4.4. Market size and forecast, by End-use
7.3.5.5. Spain
7.3.5.5.1. Key market trends, growth factors and opportunities
7.3.5.5.2. Market size and forecast, by Form
7.3.5.5.3. Market size and forecast, by Material Type
7.3.5.5.4. Market size and forecast, by End-use
7.3.5.6. Rest of Europe
7.3.5.6.1. Key market trends, growth factors and opportunities
7.3.5.6.2. Market size and forecast, by Form
7.3.5.6.3. Market size and forecast, by Material Type
7.3.5.6.4. Market size and forecast, by End-use
7.4. Asia-Pacific
7.4.1. Key trends and opportunities
7.4.2. Market size and forecast, by Form
7.4.3. Market size and forecast, by Material Type
7.4.4. Market size and forecast, by End-use
7.4.5. Market size and forecast, by country
7.4.5.1. China
7.4.5.1.1. Key market trends, growth factors and opportunities
7.4.5.1.2. Market size and forecast, by Form
7.4.5.1.3. Market size and forecast, by Material Type
7.4.5.1.4. Market size and forecast, by End-use
7.4.5.2. India
7.4.5.2.1. Key market trends, growth factors and opportunities
7.4.5.2.2. Market size and forecast, by Form
7.4.5.2.3. Market size and forecast, by Material Type
7.4.5.2.4. Market size and forecast, by End-use
7.4.5.3. Japan
7.4.5.3.1. Key market trends, growth factors and opportunities
7.4.5.3.2. Market size and forecast, by Form
7.4.5.3.3. Market size and forecast, by Material Type
7.4.5.3.4. Market size and forecast, by End-use
7.4.5.4. South Korea
7.4.5.4.1. Key market trends, growth factors and opportunities
7.4.5.4.2. Market size and forecast, by Form
7.4.5.4.3. Market size and forecast, by Material Type
7.4.5.4.4. Market size and forecast, by End-use
7.4.5.5. Australia
7.4.5.5.1. Key market trends, growth factors and opportunities
7.4.5.5.2. Market size and forecast, by Form
7.4.5.5.3. Market size and forecast, by Material Type
7.4.5.5.4. Market size and forecast, by End-use
7.4.5.6. Rest of Asia-Pacific
7.4.5.6.1. Key market trends, growth factors and opportunities
7.4.5.6.2. Market size and forecast, by Form
7.4.5.6.3. Market size and forecast, by Material Type
7.4.5.6.4. Market size and forecast, by End-use
7.5. LAMEA
7.5.1. Key trends and opportunities
7.5.2. Market size and forecast, by Form
7.5.3. Market size and forecast, by Material Type
7.5.4. Market size and forecast, by End-use
7.5.5. Market size and forecast, by country
7.5.5.1. Brazil
7.5.5.1.1. Key market trends, growth factors and opportunities
7.5.5.1.2. Market size and forecast, by Form
7.5.5.1.3. Market size and forecast, by Material Type
7.5.5.1.4. Market size and forecast, by End-use
7.5.5.2. Saudi Arabia
7.5.5.2.1. Key market trends, growth factors and opportunities
7.5.5.2.2. Market size and forecast, by Form
7.5.5.2.3. Market size and forecast, by Material Type
7.5.5.2.4. Market size and forecast, by End-use
7.5.5.3. South Africa
7.5.5.3.1. Key market trends, growth factors and opportunities
7.5.5.3.2. Market size and forecast, by Form
7.5.5.3.3. Market size and forecast, by Material Type
7.5.5.3.4. Market size and forecast, by End-use
7.5.5.4. Rest of LAMEA
7.5.5.4.1. Key market trends, growth factors and opportunities
7.5.5.4.2. Market size and forecast, by Form
7.5.5.4.3. Market size and forecast, by Material Type
7.5.5.4.4. Market size and forecast, by End-use
Chapter 8 : COMPETITIVE LANDSCAPE
8.1. Introduction
8.2. Top winning strategies
8.3. Product Mapping of Top 10 Player
8.4. Competitive Dashboard
8.5. Competitive Heatmap
8.6. Top player positioning, 2022
Chapter 9 : COMPANY PROFILES
9.1. JFE Steel Corporation
9.1.1. Company overview
9.1.2. Key Executives
9.1.3. Company snapshot
9.1.4. Operating business segments
9.1.5. Product portfolio
9.1.6. Key strategic moves and developments
9.2. ArcelorMittal
9.2.1. Company overview
9.2.2. Key Executives
9.2.3. Company snapshot
9.2.4. Operating business segments
9.2.5. Product portfolio
9.2.6. Business performance
9.2.7. Key strategic moves and developments
9.3. Tata Steel Ltd.
9.3.1. Company overview
9.3.2. Key Executives
9.3.3. Company snapshot
9.3.4. Operating business segments
9.3.5. Product portfolio
9.3.6. Business performance
9.4. Nucor Corporation
9.4.1. Company overview
9.4.2. Key Executives
9.4.3. Company snapshot
9.4.4. Operating business segments
9.4.5. Product portfolio
9.4.6. Business performance
9.5. JSW Steel Ltd.
9.5.1. Company overview
9.5.2. Key Executives
9.5.3. Company snapshot
9.5.4. Operating business segments
9.5.5. Product portfolio
9.5.6. Business performance
9.6. NIPPON STEEL SG WIRE CO.,LTD.
9.6.1. Company overview
9.6.2. Key Executives
9.6.3. Company snapshot
9.6.4. Operating business segments
9.6.5. Product portfolio
9.7. Severstal
9.7.1. Company overview
9.7.2. Key Executives
9.7.3. Company snapshot
9.7.4. Operating business segments
9.7.5. Product portfolio
9.7.6. Key strategic moves and developments
9.8. Optimus Steel
9.8.1. Company overview
9.8.2. Key Executives
9.8.3. Company snapshot
9.8.4. Operating business segments
9.8.5. Product portfolio
9.9. Insteel Industries, Inc.
9.9.1. Company overview
9.9.2. Key Executives
9.9.3. Company snapshot
9.9.4. Operating business segments
9.9.5. Product portfolio
9.9.6. Business performance
9.10. WireCo WorldGroup, Inc.
9.10.1. Company overview
9.10.2. Key Executives
9.10.3. Company snapshot
9.10.4. Operating business segments
9.10.5. Product portfolio
9.10.6. Key strategic moves and developments
List of Tables
TABLE 01. GLOBAL STEEL WIRE MARKET, BY FORM, 2022-2032 ($MILLION)
TABLE 02. GLOBAL STEEL WIRE MARKET, BY FORM, 2022-2032 (KILOTON)
TABLE 03. STEEL WIRE MARKET FOR ROPE, BY REGION, 2022-2032 ($MILLION)
TABLE 04. STEEL WIRE MARKET FOR ROPE, BY REGION, 2022-2032 (KILOTON)
TABLE 05. STEEL WIRE MARKET FOR NON-ROPE, BY REGION, 2022-2032 ($MILLION)
TABLE 06. STEEL WIRE MARKET FOR NON-ROPE, BY REGION, 2022-2032 (KILOTON)
TABLE 07. GLOBAL STEEL WIRE MARKET, BY MATERIAL TYPE, 2022-2032 ($MILLION)
TABLE 08. GLOBAL STEEL WIRE MARKET, BY MATERIAL TYPE, 2022-2032 (KILOTON)
TABLE 09. STEEL WIRE MARKET FOR CARBON STEEL, BY REGION, 2022-2032 ($MILLION)
TABLE 10. STEEL WIRE MARKET FOR CARBON STEEL, BY REGION, 2022-2032 (KILOTON)
TABLE 11. STEEL WIRE MARKET FOR STAINLESS STEEL, BY REGION, 2022-2032 ($MILLION)
TABLE 12. STEEL WIRE MARKET FOR STAINLESS STEEL, BY REGION, 2022-2032 (KILOTON)
TABLE 13. STEEL WIRE MARKET FOR ALLOY STEEL, BY REGION, 2022-2032 ($MILLION)
TABLE 14. STEEL WIRE MARKET FOR ALLOY STEEL, BY REGION, 2022-2032 (KILOTON)
TABLE 15. STEEL WIRE MARKET FOR OTHERS, BY REGION, 2022-2032 ($MILLION)
TABLE 16. STEEL WIRE MARKET FOR OTHERS, BY REGION, 2022-2032 (KILOTON)
TABLE 17. GLOBAL STEEL WIRE MARKET, BY END-USE, 2022-2032 ($MILLION)
TABLE 18. GLOBAL STEEL WIRE MARKET, BY END-USE, 2022-2032 (KILOTON)
TABLE 19. STEEL WIRE MARKET FOR CONSTRUCTION, BY REGION, 2022-2032 ($MILLION)
TABLE 20. STEEL WIRE MARKET FOR CONSTRUCTION, BY REGION, 2022-2032 (KILOTON)
TABLE 21. STEEL WIRE MARKET FOR AUTOMOTIVE, BY REGION, 2022-2032 ($MILLION)
TABLE 22. STEEL WIRE MARKET FOR AUTOMOTIVE, BY REGION, 2022-2032 (KILOTON)
TABLE 23. STEEL WIRE MARKET FOR AVIATION, BY REGION, 2022-2032 ($MILLION)
TABLE 24. STEEL WIRE MARKET FOR AVIATION, BY REGION, 2022-2032 (KILOTON)
TABLE 25. STEEL WIRE MARKET FOR ENERGY, BY REGION, 2022-2032 ($MILLION)
TABLE 26. STEEL WIRE MARKET FOR ENERGY, BY REGION, 2022-2032 (KILOTON)
TABLE 27. STEEL WIRE MARKET FOR AGRICULTURE, BY REGION, 2022-2032 ($MILLION)
TABLE 28. STEEL WIRE MARKET FOR AGRICULTURE, BY REGION, 2022-2032 (KILOTON)
TABLE 29. STEEL WIRE MARKET FOR OTHERS, BY REGION, 2022-2032 ($MILLION)
TABLE 30. STEEL WIRE MARKET FOR OTHERS, BY REGION, 2022-2032 (KILOTON)
TABLE 31. STEEL WIRE MARKET, BY REGION, 2022-2032 ($MILLION)
TABLE 32. STEEL WIRE MARKET, BY REGION, 2022-2032 (KILOTON)
TABLE 33. NORTH AMERICA STEEL WIRE MARKET, BY FORM, 2022-2032 ($MILLION)
TABLE 34. NORTH AMERICA STEEL WIRE MARKET, BY FORM, 2022-2032 (KILOTON)
TABLE 35. NORTH AMERICA STEEL WIRE MARKET, BY MATERIAL TYPE, 2022-2032 ($MILLION)
TABLE 36. NORTH AMERICA STEEL WIRE MARKET, BY MATERIAL TYPE, 2022-2032 (KILOTON)
TABLE 37. NORTH AMERICA STEEL WIRE MARKET, BY END-USE, 2022-2032 ($MILLION)
TABLE 38. NORTH AMERICA STEEL WIRE MARKET, BY END-USE, 2022-2032 (KILOTON)
TABLE 39. NORTH AMERICA STEEL WIRE MARKET, BY COUNTRY, 2022-2032 ($MILLION)
TABLE 40. NORTH AMERICA STEEL WIRE MARKET, BY COUNTRY, 2022-2032 (KILOTON)
TABLE 41. U.S. STEEL WIRE MARKET, BY FORM, 2022-2032 ($MILLION)
TABLE 42. U.S. STEEL WIRE MARKET, BY FORM, 2022-2032 (KILOTON)
TABLE 43. U.S. STEEL WIRE MARKET, BY MATERIAL TYPE, 2022-2032 ($MILLION)
TABLE 44. U.S. STEEL WIRE MARKET, BY MATERIAL TYPE, 2022-2032 (KILOTON)
TABLE 45. U.S. STEEL WIRE MARKET, BY END-USE, 2022-2032 ($MILLION)
TABLE 46. U.S. STEEL WIRE MARKET, BY END-USE, 2022-2032 (KILOTON)
TABLE 47. CANADA STEEL WIRE MARKET, BY FORM, 2022-2032 ($MILLION)
TABLE 48. CANADA STEEL WIRE MARKET, BY FORM, 2022-2032 (KILOTON)
TABLE 49. CANADA STEEL WIRE MARKET, BY MATERIAL TYPE, 2022-2032 ($MILLION)
TABLE 50. CANADA STEEL WIRE MARKET, BY MATERIAL TYPE, 2022-2032 (KILOTON)
TABLE 51. CANADA STEEL WIRE MARKET, BY END-USE, 2022-2032 ($MILLION)
TABLE 52. CANADA STEEL WIRE MARKET, BY END-USE, 2022-2032 (KILOTON)
TABLE 53. MEXICO STEEL WIRE MARKET, BY FORM, 2022-2032 ($MILLION)
TABLE 54. MEXICO STEEL WIRE MARKET, BY FORM, 2022-2032 (KILOTON)
TABLE 55. MEXICO STEEL WIRE MARKET, BY MATERIAL TYPE, 2022-2032 ($MILLION)
TABLE 56. MEXICO STEEL WIRE MARKET, BY MATERIAL TYPE, 2022-2032 (KILOTON)
TABLE 57. MEXICO STEEL WIRE MARKET, BY END-USE, 2022-2032 ($MILLION)
TABLE 58. MEXICO STEEL WIRE MARKET, BY END-USE, 2022-2032 (KILOTON)
TABLE 59. EUROPE STEEL WIRE MARKET, BY FORM, 2022-2032 ($MILLION)
TABLE 60. EUROPE STEEL WIRE MARKET, BY FORM, 2022-2032 (KILOTON)
TABLE 61. EUROPE STEEL WIRE MARKET, BY MATERIAL TYPE, 2022-2032 ($MILLION)
TABLE 62. EUROPE STEEL WIRE MARKET, BY MATERIAL TYPE, 2022-2032 (KILOTON)
TABLE 63. EUROPE STEEL WIRE MARKET, BY END-USE, 2022-2032 ($MILLION)
TABLE 64. EUROPE STEEL WIRE MARKET, BY END-USE, 2022-2032 (KILOTON)
TABLE 65. EUROPE STEEL WIRE MARKET, BY COUNTRY, 2022-2032 ($MILLION)
TABLE 66. EUROPE STEEL WIRE MARKET, BY COUNTRY, 2022-2032 (KILOTON)
TABLE 67. GERMANY STEEL WIRE MARKET, BY FORM, 2022-2032 ($MILLION)
TABLE 68. GERMANY STEEL WIRE MARKET, BY FORM, 2022-2032 (KILOTON)
TABLE 69. GERMANY STEEL WIRE MARKET, BY MATERIAL TYPE, 2022-2032 ($MILLION)
TABLE 70. GERMANY STEEL WIRE MARKET, BY MATERIAL TYPE, 2022-2032 (KILOTON)
TABLE 71. GERMANY STEEL WIRE MARKET, BY END-USE, 2022-2032 ($MILLION)
TABLE 72. GERMANY STEEL WIRE MARKET, BY END-USE, 2022-2032 (KILOTON)
TABLE 73. FRANCE STEEL WIRE MARKET, BY FORM, 2022-2032 ($MILLION)
TABLE 74. FRANCE STEEL WIRE MARKET, BY FORM, 2022-2032 (KILOTON)
TABLE 75. FRANCE STEEL WIRE MARKET, BY MATERIAL TYPE, 2022-2032 ($MILLION)
TABLE 76. FRANCE STEEL WIRE MARKET, BY MATERIAL TYPE, 2022-2032 (KILOTON)
TABLE 77. FRANCE STEEL WIRE MARKET, BY END-USE, 2022-2032 ($MILLION)
TABLE 78. FRANCE STEEL WIRE MARKET, BY END-USE, 2022-2032 (KILOTON)
TABLE 79. ITALY STEEL WIRE MARKET, BY FORM, 2022-2032 ($MILLION)
TABLE 80. ITALY STEEL WIRE MARKET, BY FORM, 2022-2032 (KILOTON)
TABLE 81. ITALY STEEL WIRE MARKET, BY MATERIAL TYPE, 2022-2032 ($MILLION)
TABLE 82. ITALY STEEL WIRE MARKET, BY MATERIAL TYPE, 2022-2032 (KILOTON)
TABLE 83. ITALY STEEL WIRE MARKET, BY END-USE, 2022-2032 ($MILLION)
TABLE 84. ITALY STEEL WIRE MARKET, BY END-USE, 2022-2032 (KILOTON)
TABLE 85. UK STEEL WIRE MARKET, BY FORM, 2022-2032 ($MILLION)
TABLE 86. UK STEEL WIRE MARKET, BY FORM, 2022-2032 (KILOTON)
TABLE 87. UK STEEL WIRE MARKET, BY MATERIAL TYPE, 2022-2032 ($MILLION)
TABLE 88. UK STEEL WIRE MARKET, BY MATERIAL TYPE, 2022-2032 (KILOTON)
TABLE 89. UK STEEL WIRE MARKET, BY END-USE, 2022-2032 ($MILLION)
TABLE 90. UK STEEL WIRE MARKET, BY END-USE, 2022-2032 (KILOTON)
TABLE 91. SPAIN STEEL WIRE MARKET, BY FORM, 2022-2032 ($MILLION)
TABLE 92. SPAIN STEEL WIRE MARKET, BY FORM, 2022-2032 (KILOTON)
TABLE 93. SPAIN STEEL WIRE MARKET, BY MATERIAL TYPE, 2022-2032 ($MILLION)
TABLE 94. SPAIN STEEL WIRE MARKET, BY MATERIAL TYPE, 2022-2032 (KILOTON)
TABLE 95. SPAIN STEEL WIRE MARKET, BY END-USE, 2022-2032 ($MILLION)
TABLE 96. SPAIN STEEL WIRE MARKET, BY END-USE, 2022-2032 (KILOTON)
TABLE 97. REST OF EUROPE STEEL WIRE MARKET, BY FORM, 2022-2032 ($MILLION)
TABLE 98. REST OF EUROPE STEEL WIRE MARKET, BY FORM, 2022-2032 (KILOTON)
TABLE 99. REST OF EUROPE STEEL WIRE MARKET, BY MATERIAL TYPE, 2022-2032 ($MILLION)
TABLE 100. REST OF EUROPE STEEL WIRE MARKET, BY MATERIAL TYPE, 2022-2032 (KILOTON)
TABLE 101. REST OF EUROPE STEEL WIRE MARKET, BY END-USE, 2022-2032 ($MILLION)
TABLE 102. REST OF EUROPE STEEL WIRE MARKET, BY END-USE, 2022-2032 (KILOTON)
TABLE 103. ASIA-PACIFIC STEEL WIRE MARKET, BY FORM, 2022-2032 ($MILLION)
TABLE 104. ASIA-PACIFIC STEEL WIRE MARKET, BY FORM, 2022-2032 (KILOTON)
TABLE 105. ASIA-PACIFIC STEEL WIRE MARKET, BY MATERIAL TYPE, 2022-2032 ($MILLION)
TABLE 106. ASIA-PACIFIC STEEL WIRE MARKET, BY MATERIAL TYPE, 2022-2032 (KILOTON)
TABLE 107. ASIA-PACIFIC STEEL WIRE MARKET, BY END-USE, 2022-2032 ($MILLION)
TABLE 108. ASIA-PACIFIC STEEL WIRE MARKET, BY END-USE, 2022-2032 (KILOTON)
TABLE 109. ASIA-PACIFIC STEEL WIRE MARKET, BY COUNTRY, 2022-2032 ($MILLION)
TABLE 110. ASIA-PACIFIC STEEL WIRE MARKET, BY COUNTRY, 2022-2032 (KILOTON)
TABLE 111. CHINA STEEL WIRE MARKET, BY FORM, 2022-2032 ($MILLION)
TABLE 112. CHINA STEEL WIRE MARKET, BY FORM, 2022-2032 (KILOTON)
TABLE 113. CHINA STEEL WIRE MARKET, BY MATERIAL TYPE, 2022-2032 ($MILLION)
TABLE 114. CHINA STEEL WIRE MARKET, BY MATERIAL TYPE, 2022-2032 (KILOTON)
TABLE 115. CHINA STEEL WIRE MARKET, BY END-USE, 2022-2032 ($MILLION)
TABLE 116. CHINA STEEL WIRE MARKET, BY END-USE, 2022-2032 (KILOTON)
TABLE 117. INDIA STEEL WIRE MARKET, BY FORM, 2022-2032 ($MILLION)
TABLE 118. INDIA STEEL WIRE MARKET, BY FORM, 2022-2032 (KILOTON)
TABLE 119. INDIA STEEL WIRE MARKET, BY MATERIAL TYPE, 2022-2032 ($MILLION)
TABLE 120. INDIA STEEL WIRE MARKET, BY MATERIAL TYPE, 2022-2032 (KILOTON)
TABLE 121. INDIA STEEL WIRE MARKET, BY END-USE, 2022-2032 ($MILLION)
TABLE 122. INDIA STEEL WIRE MARKET, BY END-USE, 2022-2032 (KILOTON)
TABLE 123. JAPAN STEEL WIRE MARKET, BY FORM, 2022-2032 ($MILLION)
TABLE 124. JAPAN STEEL WIRE MARKET, BY FORM, 2022-2032 (KILOTON)
TABLE 125. JAPAN STEEL WIRE MARKET, BY MATERIAL TYPE, 2022-2032 ($MILLION)
TABLE 126. JAPAN STEEL WIRE MARKET, BY MATERIAL TYPE, 2022-2032 (KILOTON)
TABLE 127. JAPAN STEEL WIRE MARKET, BY END-USE, 2022-2032 ($MILLION)
TABLE 128. JAPAN STEEL WIRE MARKET, BY END-USE, 2022-2032 (KILOTON)
TABLE 129. SOUTH KOREA STEEL WIRE MARKET, BY FORM, 2022-2032 ($MILLION)
TABLE 130. SOUTH KOREA STEEL WIRE MARKET, BY FORM, 2022-2032 (KILOTON)
TABLE 131. SOUTH KOREA STEEL WIRE MARKET, BY MATERIAL TYPE, 2022-2032 ($MILLION)
TABLE 132. SOUTH KOREA STEEL WIRE MARKET, BY MATERIAL TYPE, 2022-2032 (KILOTON)
TABLE 133. SOUTH KOREA STEEL WIRE MARKET, BY END-USE, 2022-2032 ($MILLION)
TABLE 134. SOUTH KOREA STEEL WIRE MARKET, BY END-USE, 2022-2032 (KILOTON)
TABLE 135. AUSTRALIA STEEL WIRE MARKET, BY FORM, 2022-2032 ($MILLION)
TABLE 136. AUSTRALIA STEEL WIRE MARKET, BY FORM, 2022-2032 (KILOTON)
TABLE 137. AUSTRALIA STEEL WIRE MARKET, BY MATERIAL TYPE, 2022-2032 ($MILLION)
TABLE 138. AUSTRALIA STEEL WIRE MARKET, BY MATERIAL TYPE, 2022-2032 (KILOTON)
TABLE 139. AUSTRALIA STEEL WIRE MARKET, BY END-USE, 2022-2032 ($MILLION)
TABLE 140. AUSTRALIA STEEL WIRE MARKET, BY END-USE, 2022-2032 (KILOTON)
TABLE 141. REST OF ASIA-PACIFIC STEEL WIRE MARKET, BY FORM, 2022-2032 ($MILLION)
TABLE 142. REST OF ASIA-PACIFIC STEEL WIRE MARKET, BY FORM, 2022-2032 (KILOTON)
TABLE 143. REST OF ASIA-PACIFIC STEEL WIRE MARKET, BY MATERIAL TYPE, 2022-2032 ($MILLION)
TABLE 144. REST OF ASIA-PACIFIC STEEL WIRE MARKET, BY MATERIAL TYPE, 2022-2032 (KILOTON)
TABLE 145. REST OF ASIA-PACIFIC STEEL WIRE MARKET, BY END-USE, 2022-2032 ($MILLION)
TABLE 146. REST OF ASIA-PACIFIC STEEL WIRE MARKET, BY END-USE, 2022-2032 (KILOTON)
TABLE 147. LAMEA STEEL WIRE MARKET, BY FORM, 2022-2032 ($MILLION)
TABLE 148. LAMEA STEEL WIRE MARKET, BY FORM, 2022-2032 (KILOTON)
TABLE 149. LAMEA STEEL WIRE MARKET, BY MATERIAL TYPE, 2022-2032 ($MILLION)
TABLE 150. LAMEA STEEL WIRE MARKET, BY MATERIAL TYPE, 2022-2032 (KILOTON)
TABLE 151. LAMEA STEEL WIRE MARKET, BY END-USE, 2022-2032 ($MILLION)
TABLE 152. LAMEA STEEL WIRE MARKET, BY END-USE, 2022-2032 (KILOTON)
TABLE 153. LAMEA STEEL WIRE MARKET, BY COUNTRY, 2022-2032 ($MILLION)
TABLE 154. LAMEA STEEL WIRE MARKET, BY COUNTRY, 2022-2032 (KILOTON)
TABLE 155. BRAZIL STEEL WIRE MARKET, BY FORM, 2022-2032 ($MILLION)
TABLE 156. BRAZIL STEEL WIRE MARKET, BY FORM, 2022-2032 (KILOTON)
TABLE 157. BRAZIL STEEL WIRE MARKET, BY MATERIAL TYPE, 2022-2032 ($MILLION)
TABLE 158. BRAZIL STEEL WIRE MARKET, BY MATERIAL TYPE, 2022-2032 (KILOTON)
TABLE 159. BRAZIL STEEL WIRE MARKET, BY END-USE, 2022-2032 ($MILLION)
TABLE 160. BRAZIL STEEL WIRE MARKET, BY END-USE, 2022-2032 (KILOTON)
TABLE 161. SAUDI ARABIA STEEL WIRE MARKET, BY FORM, 2022-2032 ($MILLION)
TABLE 162. SAUDI ARABIA STEEL WIRE MARKET, BY FORM, 2022-2032 (KILOTON)
TABLE 163. SAUDI ARABIA STEEL WIRE MARKET, BY MATERIAL TYPE, 2022-2032 ($MILLION)
TABLE 164. SAUDI ARABIA STEEL WIRE MARKET, BY MATERIAL TYPE, 2022-2032 (KILOTON)
TABLE 165. SAUDI ARABIA STEEL WIRE MARKET, BY END-USE, 2022-2032 ($MILLION)
TABLE 166. SAUDI ARABIA STEEL WIRE MARKET, BY END-USE, 2022-2032 (KILOTON)
TABLE 167. SOUTH AFRICA STEEL WIRE MARKET, BY FORM, 2022-2032 ($MILLION)
TABLE 168. SOUTH AFRICA STEEL WIRE MARKET, BY FORM, 2022-2032 (KILOTON)
TABLE 169. SOUTH AFRICA STEEL WIRE MARKET, BY MATERIAL TYPE, 2022-2032 ($MILLION)
TABLE 170. SOUTH AFRICA STEEL WIRE MARKET, BY MATERIAL TYPE, 2022-2032 (KILOTON)
TABLE 171. SOUTH AFRICA STEEL WIRE MARKET, BY END-USE, 2022-2032 ($MILLION)
TABLE 172. SOUTH AFRICA STEEL WIRE MARKET, BY END-USE, 2022-2032 (KILOTON)
TABLE 173. REST OF LAMEA STEEL WIRE MARKET, BY FORM, 2022-2032 ($MILLION)
TABLE 174. REST OF LAMEA STEEL WIRE MARKET, BY FORM, 2022-2032 (KILOTON)
TABLE 175. REST OF LAMEA STEEL WIRE MARKET, BY MATERIAL TYPE, 2022-2032 ($MILLION)
TABLE 176. REST OF LAMEA STEEL WIRE MARKET, BY MATERIAL TYPE, 2022-2032 (KILOTON)
TABLE 177. REST OF LAMEA STEEL WIRE MARKET, BY END-USE, 2022-2032 ($MILLION)
TABLE 178. REST OF LAMEA STEEL WIRE MARKET, BY END-USE, 2022-2032 (KILOTON)
TABLE 179. JFE STEEL CORPORATION: KEY EXECUTIVES
TABLE 180. JFE STEEL CORPORATION: COMPANY SNAPSHOT
TABLE 181. JFE STEEL CORPORATION: PRODUCT SEGMENTS
TABLE 182. JFE STEEL CORPORATION: PRODUCT PORTFOLIO
TABLE 183. JFE STEEL CORPORATION: KEY STRATERGIES
TABLE 184. ARCELORMITTAL: KEY EXECUTIVES
TABLE 185. ARCELORMITTAL: COMPANY SNAPSHOT
TABLE 186. ARCELORMITTAL: SERVICE SEGMENTS
TABLE 187. ARCELORMITTAL: PRODUCT PORTFOLIO
TABLE 188. ARCELORMITTAL: KEY STRATERGIES
TABLE 189. TATA STEEL LTD.: KEY EXECUTIVES
TABLE 190. TATA STEEL LTD.: COMPANY SNAPSHOT
TABLE 191. TATA STEEL LTD.: PRODUCT SEGMENTS
TABLE 192. TATA STEEL LTD.: PRODUCT PORTFOLIO
TABLE 193. NUCOR CORPORATION: KEY EXECUTIVES
TABLE 194. NUCOR CORPORATION: COMPANY SNAPSHOT
TABLE 195. NUCOR CORPORATION: PRODUCT SEGMENTS
TABLE 196. NUCOR CORPORATION: PRODUCT PORTFOLIO
TABLE 197. JSW STEEL LTD.: KEY EXECUTIVES
TABLE 198. JSW STEEL LTD.: COMPANY SNAPSHOT
TABLE 199. JSW STEEL LTD.: PRODUCT SEGMENTS
TABLE 200. JSW STEEL LTD.: PRODUCT PORTFOLIO
TABLE 201. NIPPON STEEL SG WIRE CO.,LTD.: KEY EXECUTIVES
TABLE 202. NIPPON STEEL SG WIRE CO.,LTD.: COMPANY SNAPSHOT
TABLE 203. NIPPON STEEL SG WIRE CO.,LTD.: PRODUCT SEGMENTS
TABLE 204. NIPPON STEEL SG WIRE CO.,LTD.: PRODUCT PORTFOLIO
TABLE 205. SEVERSTAL: KEY EXECUTIVES
TABLE 206. SEVERSTAL: COMPANY SNAPSHOT
TABLE 207. SEVERSTAL: PRODUCT SEGMENTS
TABLE 208. SEVERSTAL: SERVICE SEGMENTS
TABLE 209. SEVERSTAL: PRODUCT PORTFOLIO
TABLE 210. SEVERSTAL: KEY STRATERGIES
TABLE 211. OPTIMUS STEEL: KEY EXECUTIVES
TABLE 212. OPTIMUS STEEL: COMPANY SNAPSHOT
TABLE 213. OPTIMUS STEEL: PRODUCT SEGMENTS
TABLE 214. OPTIMUS STEEL: PRODUCT PORTFOLIO
TABLE 215. INSTEEL INDUSTRIES, INC.: KEY EXECUTIVES
TABLE 216. INSTEEL INDUSTRIES, INC.: COMPANY SNAPSHOT
TABLE 217. INSTEEL INDUSTRIES, INC.: PRODUCT SEGMENTS
TABLE 218. INSTEEL INDUSTRIES, INC.: PRODUCT PORTFOLIO
TABLE 219. WIRECO WORLDGROUP, INC.: KEY EXECUTIVES
TABLE 220. WIRECO WORLDGROUP, INC.: COMPANY SNAPSHOT
TABLE 221. WIRECO WORLDGROUP, INC.: PRODUCT SEGMENTS
TABLE 222. WIRECO WORLDGROUP, INC.: PRODUCT PORTFOLIO
TABLE 223. WIRECO WORLDGROUP, INC.: KEY STRATERGIES
List of Figures
FIGURE 01. STEEL WIRE MARKET, 2022-2032
FIGURE 02. SEGMENTATION OF STEEL WIRE MARKET, 2022-2032
FIGURE 03. TOP INVESTMENT POCKETS IN STEEL WIRE MARKET (2023-2032)
FIGURE 04. LOW BARGAINING POWER OF SUPPLIERS
FIGURE 05. LOW BARGAINING POWER OF BUYERS
FIGURE 06. LOW THREAT OF SUBSTITUTES
FIGURE 07. LOW THREAT OF NEW ENTRANTS
FIGURE 08. LOW INTENSITY OF RIVALRY
FIGURE 09. DRIVERS, RESTRAINTS AND OPPORTUNITIES: GLOBALSTEEL WIRE MARKET
FIGURE 10. IMPACT OF KEY REGULATION: STEEL WIRE MARKET
FIGURE 11. PATENT ANALYSIS BY COMPANY
FIGURE 12. PATENT ANALYSIS BY COUNTRY
FIGURE 13. PRICING ANALYSIS: STEEL WIRE MARKET 2022 AND 2032
FIGURE 14. STEEL WIRE MARKET, BY FORM, 2022(%)
FIGURE 15. COMPARATIVE SHARE ANALYSIS OF STEEL WIRE MARKET FOR ROPE, BY COUNTRY 2022 AND 2032(%)
FIGURE 16. COMPARATIVE SHARE ANALYSIS OF STEEL WIRE MARKET FOR NON-ROPE, BY COUNTRY 2022 AND 2032(%)
FIGURE 17. STEEL WIRE MARKET, BY MATERIAL TYPE, 2022(%)
FIGURE 18. COMPARATIVE SHARE ANALYSIS OF STEEL WIRE MARKET FOR CARBON STEEL, BY COUNTRY 2022 AND 2032(%)
FIGURE 19. COMPARATIVE SHARE ANALYSIS OF STEEL WIRE MARKET FOR STAINLESS STEEL, BY COUNTRY 2022 AND 2032(%)
FIGURE 20. COMPARATIVE SHARE ANALYSIS OF STEEL WIRE MARKET FOR ALLOY STEEL, BY COUNTRY 2022 AND 2032(%)
FIGURE 21. COMPARATIVE SHARE ANALYSIS OF STEEL WIRE MARKET FOR OTHERS, BY COUNTRY 2022 AND 2032(%)
FIGURE 22. STEEL WIRE MARKET, BY END-USE, 2022(%)
FIGURE 23. COMPARATIVE SHARE ANALYSIS OF STEEL WIRE MARKET FOR CONSTRUCTION, BY COUNTRY 2022 AND 2032(%)
FIGURE 24. COMPARATIVE SHARE ANALYSIS OF STEEL WIRE MARKET FOR AUTOMOTIVE, BY COUNTRY 2022 AND 2032(%)
FIGURE 25. COMPARATIVE SHARE ANALYSIS OF STEEL WIRE MARKET FOR AVIATION, BY COUNTRY 2022 AND 2032(%)
FIGURE 26. COMPARATIVE SHARE ANALYSIS OF STEEL WIRE MARKET FOR ENERGY, BY COUNTRY 2022 AND 2032(%)
FIGURE 27. COMPARATIVE SHARE ANALYSIS OF STEEL WIRE MARKET FOR AGRICULTURE, BY COUNTRY 2022 AND 2032(%)
FIGURE 28. COMPARATIVE SHARE ANALYSIS OF STEEL WIRE MARKET FOR OTHERS, BY COUNTRY 2022 AND 2032(%)
FIGURE 29. STEEL WIRE MARKET BY REGION, 2022
FIGURE 30. U.S. STEEL WIRE MARKET, 2022-2032 ($MILLION)
FIGURE 31. CANADA STEEL WIRE MARKET, 2022-2032 ($MILLION)
FIGURE 32. MEXICO STEEL WIRE MARKET, 2022-2032 ($MILLION)
FIGURE 33. GERMANY STEEL WIRE MARKET, 2022-2032 ($MILLION)
FIGURE 34. FRANCE STEEL WIRE MARKET, 2022-2032 ($MILLION)
FIGURE 35. ITALY STEEL WIRE MARKET, 2022-2032 ($MILLION)
FIGURE 36. UK STEEL WIRE MARKET, 2022-2032 ($MILLION)
FIGURE 37. SPAIN STEEL WIRE MARKET, 2022-2032 ($MILLION)
FIGURE 38. REST OF EUROPE STEEL WIRE MARKET, 2022-2032 ($MILLION)
FIGURE 39. CHINA STEEL WIRE MARKET, 2022-2032 ($MILLION)
FIGURE 40. INDIA STEEL WIRE MARKET, 2022-2032 ($MILLION)
FIGURE 41. JAPAN STEEL WIRE MARKET, 2022-2032 ($MILLION)
FIGURE 42. SOUTH KOREA STEEL WIRE MARKET, 2022-2032 ($MILLION)
FIGURE 43. AUSTRALIA STEEL WIRE MARKET, 2022-2032 ($MILLION)
FIGURE 44. REST OF ASIA-PACIFIC STEEL WIRE MARKET, 2022-2032 ($MILLION)
FIGURE 45. BRAZIL STEEL WIRE MARKET, 2022-2032 ($MILLION)
FIGURE 46. SAUDI ARABIA STEEL WIRE MARKET, 2022-2032 ($MILLION)
FIGURE 47. SOUTH AFRICA STEEL WIRE MARKET, 2022-2032 ($MILLION)
FIGURE 48. REST OF LAMEA STEEL WIRE MARKET, 2022-2032 ($MILLION)
FIGURE 49. TOP WINNING STRATEGIES, BY YEAR
FIGURE 50. TOP WINNING STRATEGIES, BY DEVELOPMENT
FIGURE 51. TOP WINNING STRATEGIES, BY COMPANY
FIGURE 52. PRODUCT MAPPING OF TOP 10 PLAYERS
FIGURE 53. COMPETITIVE DASHBOARD
FIGURE 54. COMPETITIVE HEATMAP: STEEL WIRE MARKET
FIGURE 55. TOP PLAYER POSITIONING, 2022
FIGURE 56. ARCELORMITTAL: NET SALES, 2020-2022 ($MILLION)
FIGURE 57. ARCELORMITTAL: RESEARCH & DEVELOPMENT EXPENDITURE, 2020-2022 ($MILLION)
FIGURE 58. ARCELORMITTAL: REVENUE SHARE BY SEGMENT, 2022 (%)
FIGURE 59. ARCELORMITTAL: REVENUE SHARE BY REGION, 2022 (%)
FIGURE 60. TATA STEEL LTD.: NET SALES, 2020-2022 ($MILLION)
FIGURE 61. TATA STEEL LTD.: REVENUE SHARE BY SEGMENT, 2022 (%)
FIGURE 62. TATA STEEL LTD.: REVENUE SHARE BY REGION, 2022 (%)
FIGURE 63. NUCOR CORPORATION (NUCOR TUBULAR PRODUCTS): NET SALES, 2020-2022 ($MILLION)
FIGURE 64. NUCOR CORPORATION (NUCOR TUBULAR PRODUCTS): REVENUE SHARE BY SEGMENT, 2022 (%)
FIGURE 65. JSW STEEL LTD.: NET REVENUE, 2020-2022 ($MILLION)
FIGURE 66. INSTEEL INDUSTRIES, INC.: NET SALES, 2020-2022 ($MILLION)
FIGURE 67. INSTEEL INDUSTRIES, INC.: REVENUE SHARE BY SEGMENT, 2022 (%)
$5730
$9600
HAVE A QUERY?
OUR CUSTOMER
