
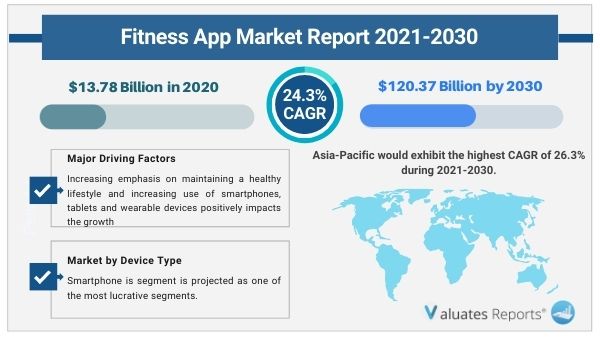
The global fitness app market size was valued at USD 13.78 billion in 2020 and is projected to reach USD 120.37 billion by 2030 at a Compound Annual Growth Rate (CAGR) of 24.3% from 2021 to 2030.
The fitness app market is primarily driven by the growing emphasis on leading a healthy lifestyle and the expanding use of smart devices like smartphones, tablets, and wearables. The development of fitness apps using artificial intelligence and machine learning, as well as the rising incidence of diseases linked to a sedentary lifestyle, are creating lucrative growth opportunities. The fitness app market worldwide is also growing as people become more aware of diseases linked to diet. Home fitness apps have always been a part of our lives, but recently, their use has skyrocketed. National lockdowns and social distance guidelines have altered how we use applications over the past 18 months. All verticals experienced significant growth in installs and sessions in 2020, but the health and fitness sector performed especially well.
Fitness applications have done a great job of retaining their users, which has led to many people choosing to utilize their mobile devices to maintain their fitness levels. Apart from the limitations that still affect users' habits, the variety and number of health and fitness applications are probably what motivates this continuous use. Nowadays, in addition to workouts and routines, several applications also include integrated equipment, wearable technologies, and mindfulness/meditation exercises.
By enabling us to monitor our progress from anywhere, mobile apps have given us more tools to improve our health and fitness. They also offer tips on how to carry out particular exercises and training schedules, which we may follow on our phones. This element is anticipated to fuel the fitness app market.
The fitness app market is expanding as more individuals realize how important leading a healthy lifestyle is. The increased number of people who are employed and leading busy lives means that there is less time for people to concentrate on their health. Stress-related illnesses including anxiety and depression are thus on the rise. As a result, customers are becoming more motivated to pay attention to their health, which has given rise to the widespread use of fitness apps. Additionally, during the course of the projection period, the fitness app market will rise due to the general public's increasing use of smartphones, tablets, wearable technology, and high-speed internet connectivity.
The capacity to offer wholesome and well-balanced meal planning exists in fitness apps. They keep tabs on your fitness objectives and offer information on the times and details of your workouts. These apps' step monitoring and workout timing feature also help busy people lose weight. Additionally, these applications offer individualized food plans, fitness routines, and one-on-one consultations with health coaches, physicians, and nutritionists. Therefore, the fitness app market is anticipated to grow over the forecast period as a consequence of growing consumer worries about diet-related disorders and a shift toward individualized and healthy diet plans.
Fitness app effectiveness has increased thanks to artificial intelligence and machine learning. There are apps that may, for instance, scan your profile, improve it, and suggest the finest training strategies to help you get healthy, fit, and trimmed. Additionally, machine learning algorithms can offer diet plans, and no-equipment workout routines, and help you keep track of your own fitness objectives. Rapid technological advancements that combine data mining and modeling methods from user source data to produce customized training programs are driving fitness app market growth. Furthermore, a large consumer base is adopting fitness apps at a rapid rate due to the rising prevalence of lifestyle diseases like diabetes, stress, hypertension, and high blood pressure.
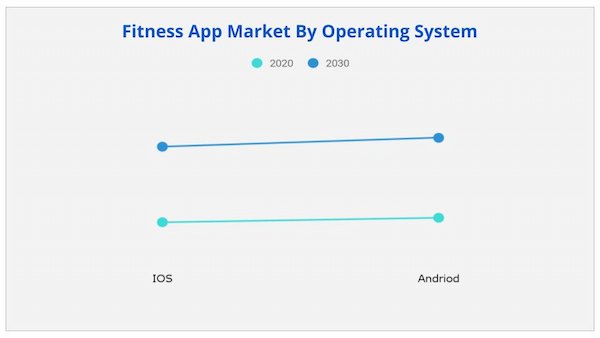
Thanks to the growing consumer adoption of iOS devices, iOS is anticipated to be one of the operating system segments with the highest growth rates for the fitness app market share during the forecast period.
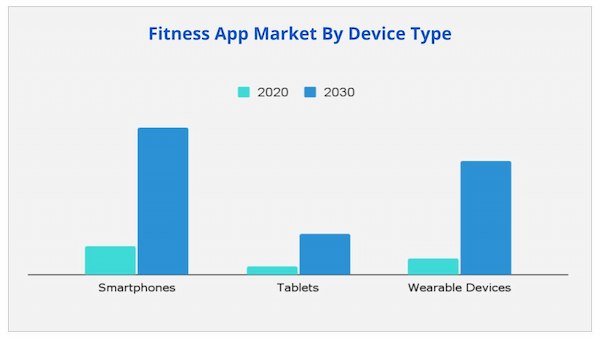
According to device type, smartphones are anticipated to be among the most lucrative segments for market share growth for fitness apps during the forecast period.
Exercise and weight loss are anticipated to be one of the most lucrative segments for growth in the fitness app market share during the forecast period due to the rising prevalence of obesity-related diseases like cardiovascular diseases, cancer, diabetes, and others.
Asia-Pacific is anticipated to have the highest CAGR of 26.3 percent between 2021 and 2030 due to the widespread acceptance rate of fitness apps, rising obesity rates, and growing demand for hassle-free, risk-free fitness services. During the projection period, North America is anticipated to be one of the markets with the highest growth potential for the fitness app market share.
| Report Metric | Details |
| Report Name | Fitness App Market |
| The market size in 2020 | USD 13.78 billion |
| The revenue forecast in 2030 | USD 120.37 billion |
| Growth Rate | CAGR 24.3% |
| Market size available for years | 2021-2030 |
| Forecast units | Value (USD) |
| Segments covered | Type, Application, Industry, Regions |
| Report coverage | Revenue & volume forecast, company share, competitive landscape, growth factors, and trends |
| Geographic regions covered | North America, Europe, Asia Pacific, Latin America, Middle East & Africa |
Ans. The global fitness app market size was valued at US$ 13.78 billion in 2020 and is projected to reach US$ 120.37 billion by 2030 at a Compound Annual Growth Rate (CAGR) of 24.3% from 2021 to 2030.
Ans. Key drivers of the fitness app market are increasing focus on maintaining a healthy lifestyle and rising penetration of smart devices such as smartphones, tablets, and wearables.
Ans. Smartphone is segment is projected as one of the most lucrative segments.
Ans. iOS is projected as one of the most lucrative segments.
Ans. The sample for global fitness app market report can be obtained on demand from the Valuates Reports website. Also, the 24*7 chat support and direct call services are provided to procure the sample report.
Ans. Asia-Pacific would exhibit the highest CAGR of 26.3% during 2021-2030.
Table of Content
CHAPTER 1:INTRODUCTION
1.1.Report description
1.2.Key benefits for stakeholders
1.3.Key market segments
1.4.Research methodology
1.4.1.Primary research
1.4.2.Secondary research
1.4.3.Analyst tools and models
CHAPTER 2:EXECUTIVE SUMMARY
2.1.Key findings
2.1.1.Top impacting factors
2.1.2.Top investment pockets
2.2.CXO perspective
CHAPTER 3:MARKET OVERVIEW
3.1.Market definition and scope
3.2.Key forces shaping fitness apps industry/market
3.3.Market dynamics
3.1.1.Drivers
3.1.1.1.Increasing emphasis on maintaining a healthy lifestyle
3.1.1.2.Increasing use of smartphones, tablets and wearable devices
3.1.1.3.Increasing awareness about diet-related diseases
3.1.2.Restraints
3.1.2.1.Technical issues in apps and the high cost of in app purchases
3.1.2.2.Concerns regarding data security and stringent regulations
3.1.3.Opportunities
3.1.3.1.Technological advancements in AI and machine learning
3.1.3.2.Rising disease prevalence of hypertension, obesity, and cardiac problems
3.1.COVID-19 impact analysis on fitness app market
3.1.1.Impact on market size
3.1.2.Change in consumer trends, preferences, and budget impact due to COVID-19
3.1.3.Economic impact
3.1.4.Key player strategies to tackle negative impact in the industry
3.1.5.Opportunity analysis for fitness app providers
CHAPTER 4:FITNESS APP MARKET, BY DEVICE TYPE
4.1.Overview
4.2.Smartphone
4.2.1.Key market trends, growth factors, and opportunities
4.2.2.Market size and forecast, by region
4.2.3.Market analysis, by country
4.3.Tablets
4.3.1.Key market trends, growth factors, and opportunities
4.3.2.Market size and forecast, by region
4.3.3.Market analysis, by country
4.4.Wearable Devices
4.4.1.Key market trends, growth factors, and opportunities
4.4.2.Market size and forecast, by region
4.4.3.Market analysis, by country
CHAPTER 5:FITNESS APP MARKET, BY OPERATING SYSTEM
5.1.Overview
5.2.iOS
5.2.1.Key market trends, growth factors, and opportunities
5.2.2.Market size and forecast, by region
5.2.3.Market analysis, by country
5.3.Android
5.3.1.Key market trends, growth factors, and opportunities
5.3.2.Market size and forecast, by region
5.3.3.Market analysis, by country
CHAPTER 6:FITNESS APP MARKET, BY TYPE
6.1.Overview
6.2.Exercise & Weight Loss
6.2.1.Key market trends, growth factors, and opportunities
6.2.2.Market size and forecast, by region
6.2.3.Market analysis, by country
6.3.Diet & Nutrition
6.3.1.Key market trends, growth factors, and opportunities
6.3.2.Market size and forecast, by region
6.3.3.Market analysis, by country
6.4.Activity Tracking
6.4.1.Key market trends, growth factors, and opportunities
6.4.2.Market size and forecast, by region
6.4.3.Market analysis, by country
6.5.Others
6.5.1.Key market trends, growth factors, and opportunities
6.5.2.Market size and forecast, by region
6.5.3.Market analysis, by country
CHAPTER 7:FITNESS APP MARKET, BY REGION
7.1.Overview
7.1.1.Market size and forecast, by region
7.2.North America
7.2.1.Key market trends, growth factors, and opportunities
7.2.2.Market size and forecast, by device type
7.2.3.Market size and forecast, by operating system
7.2.4.Market size and forecast, by type
7.2.5.Market analysis, by country
7.2.5.1.U.S.
7.2.5.1.1.Market size and forecast, by device type
7.2.5.1.2.Market size and forecast, by operating system
7.2.5.1.3.Market size and forecast, by type
7.2.5.2.Canada
7.2.5.2.1.Market size and forecast, by device type
7.2.5.2.2.Market size and forecast, by operating system
7.2.5.2.3.Market size and forecast, by type
7.1.Europe
7.1.1.Key market trends, growth factors, and opportunities
7.1.2.Market size and forecast, by device type
7.1.3.Market size and forecast, by operating system
7.1.4.Market size and forecast, by type
7.1.5.Market analysis, by country
7.1.5.1.Germany
7.1.5.1.1.Market size and forecast, by device type
7.1.5.1.2.Market size and forecast, by operating system
7.1.5.1.3.Market size and forecast, by type
7.1.5.2.UK
7.1.5.2.1.Market size and forecast, by device type
7.1.5.2.2.Market size and forecast, by operating system
7.1.5.2.3.Market size and forecast, by type
7.1.5.3.France
7.1.5.3.1.Market size and forecast, by device type
7.1.5.3.2.Market size and forecast, by operating system
7.1.5.3.3.Market size and forecast, by type
7.1.5.4.Italy
7.1.5.4.1.Market size and forecast, by device type
7.1.5.4.2.Market size and forecast, by operating system
7.1.5.4.3.Market size and forecast, by type
7.1.5.5.Spain
7.1.5.5.1.Market size and forecast, by device type
7.1.5.5.2.Market size and forecast, by operating system
7.1.5.5.3.Market size and forecast, by type
7.1.5.6.Rest of Europe
7.1.5.6.1.Market size and forecast, by device type
7.1.5.6.2.Market size and forecast, by operating system
7.1.5.6.3.Market size and forecast, by type
7.2.Asia-Pacific
7.2.1.Key market trends, growth factors, and opportunities
7.2.2.Market size and forecast, by device type
7.2.3.Market size and forecast, by operating system
7.2.4.Market size and forecast, by type
7.2.5.Market analysis, by country
7.2.5.1.CHINA
7.2.5.1.1.Market size and forecast, by device type
7.2.5.1.2.Market size and forecast, by operating system
7.2.5.1.3.Market size and forecast, by type
7.2.5.2.Japan
7.2.5.2.1.Market size and forecast, by device type
7.2.5.2.2.Market size and forecast, by operating system
7.2.5.2.3.Market size and forecast, by type
7.2.5.3.India
7.2.5.3.1.Market size and forecast, by device type
7.2.5.3.2.Market size and forecast, by operating system
7.2.5.3.3.Market size and forecast, by type
7.2.5.4.Australia
7.2.5.4.1.Market size and forecast, by device type
7.2.5.4.2.Market size and forecast, by operating system
7.2.5.4.3.Market size and forecast, by type
7.2.5.5.South Korea
7.2.5.5.1.Market size and forecast, by device type
7.2.5.5.2.Market size and forecast, by operating system
7.2.5.5.3.Market size and forecast, by type
7.2.5.6.Rest of Asia-Pacific
7.2.5.6.1.Market size and forecast, by device type
7.2.5.6.2.Market size and forecast, by operating system
7.2.5.6.3.Market size and forecast, by type
7.3.LAMEA
7.3.1.Key market trends, growth factors, and opportunities
7.3.2.Market size and forecast, by device type
7.3.3.Market size and forecast, by operating system
7.3.4.Market size and forecast, by type
7.3.5.Market analysis, by country
7.3.5.1.Latin America
7.3.5.1.1.Market size and forecast, by device type
7.3.5.1.2.Market size and forecast, by operating system
7.3.5.1.3.Market size and forecast, by type
7.3.5.2.Middle East
7.3.5.2.1.Market size and forecast, by device type
7.3.5.2.2.Market size and forecast, by operating system
7.3.5.2.3.Market size and forecast, by type
7.3.5.3.Africa
7.3.5.3.1.Market size and forecast, by device type
7.3.5.3.2.Market size and forecast, by operating system
7.3.5.3.3.Market size and forecast, by type
CHAPTER 8:COMPETITIVE LANDSCAPE
8.1.Key players positioning analysis, 2020
8.2.Competitive dashboard
8.3.Top winning strategies
CHAPTER 9:COMPANY PROFILE
9.1.Aaptiv Inc
9.1.1.Company overview
9.1.2.Key Executives
9.1.3.Company snapshot
9.1.4.Product portfolio
9.2.Adidas
9.2.1.Company overview
9.2.2.Key executives
9.2.3.Company snapshot
9.2.4.Product portfolio
9.2.5.Business performance
9.2.6.Key strategic moves and developments
9.3.APPLICO INC.
9.3.1.Company overview
9.3.2.Key executives
9.3.3.Company snapshot
9.3.4.Product portfolio
9.4.Azumio, Inc.
9.4.1.Company overview
9.4.2.Key executives
9.4.3.Company snapshot
9.4.4.Product portfolio
9.5.Fitbit LLC.
9.5.1.Company overview
9.5.2.Key Executives
9.5.3.Company snapshot
9.5.4.Product portfolio
9.5.5.R&D expenditure
9.5.6.Business performance
9.5.7.Key strategic moves and developments
9.6.FitnessKeeper
9.6.1.Company overview
9.6.2.Key executives
9.6.3.Company snapshot
9.6.4.Product portfolio
9.7.MyFitnessPal, Inc.
9.7.1.Company overview
9.7.2.Key Executives
9.7.3.Company snapshot
9.7.4.Product portfolio
9.8.Nike, Inc.
9.8.1.Company overview
9.8.2.Key Executives
9.8.3.Company snapshot
9.8.4.Product portfolio
9.8.5.Business performance
9.9.Noom Inc.
9.9.1.Company overview
9.9.2.Key executives
9.9.3.Company snapshot
9.9.4.Product portfolio
9.10.Under Armour, Inc.
9.10.1.Company overview
9.10.2.Key executives
9.10.3.Company snapshot
9.10.4.Product portfolio
9.10.5.Business performance
9.10.6.Key strategic moves and developments
Table 01.Fitness App Market Revenue, By Device Type, 2020–2030 ($Million)
Table 02.Fitness App Market For Smartphone, By Region 2020–2030 ($Million)
Table 03.Fitness App Market For Tablets, By Region 2020–2030 ($Million)
Table 04.Fitness App Market For Wearable Devices, By Region 2020–2030 ($Million)
Table 05.Fitness App Market Revenue, By Operating System, 2020–2030 ($Million)
Table 06.Fitness App Market For Ios, By Region 2020–2030 ($Million)
Table 07.Fitness App Market For Android, By Region 2020–2030 ($Million)
Table 08.Fitness App Market Revenue, By Type, 2020–2030 ($Million)
Table 09.Fitness App Market For Exercise & Weight Loss, By Region 2020–2030 ($Million)
Table 10.Fitness App Market For Diet & Nutrition, By Region 2020–2030 ($Million)
Table 11.Fitness App Market For Activity Tracking, By Region 2020–2030 ($Million)
Table 12.Fitness App Market For Others, By Region 2020–2030 ($Million)
Table 13.Fitness App Market Revenue, By Region, 2020–2030 ($Million)
Table 14.North America Fitness App Market Revenue, By Device Type, 2020–2030 ($Million)
Table 15.North America Fitness App Market Revenue, By Operating System, 2020–2030 ($Million)
Table 16.North America Fitness App Market Revenue, By Type, 2020–2030 ($Million)
Table 17.North America Fitness App Market Revenue, By Country, 2020–2030 ($Million)
Table 18.U.S. Fitness App Market Revenue, By Device Type, 2020–2030 ($Million)
Table 19.U.S. Fitness App Market Revenue, By Operating System, 2020–2030 ($Million)
Table 20.U.S. Fitness App Market Revenue, By Type, 2020–2030 ($Million)
Table 21.Canada Fitness App Market Revenue, By Device Type, 2020–2030 ($Million)
Table 22.Canada Fitness App Market Revenue, By Operating System, 2020–2030 ($Million)
Table 23.Canada Fitness App Market Revenue, By Type, 2020–2030 ($Million)
Table 24.Europe Fitness App Market Revenue, By Device Type, 2020–2030 ($Million)
Table 25.Europe Fitness App Market Revenue, By Operating System, 2020–2030 ($Million)
Table 26.Europe Fitness App Market Revenue, By Type, 2020–2030 ($Million)
Table 27.Europe Fitness App Market Revenue, By Country, 2020–2030 ($Million)
Table 28.Germany Fitness App Market Revenue, By Device Type, 2020–2030 ($Million)
Table 29.Germany Fitness App Market Revenue, By Operating System, 2020–2030 ($Million)
Table 30.Germany Fitness App Market Revenue, By Type, 2020–2030 ($Million)
Table 31.Uk Fitness App Market Revenue, By Device Type, 2020–2030 ($Million)
Table 32.Uk Fitness App Market Revenue, By Operating System, 2020–2030 ($Million)
Table 33.Uk Fitness App Market Revenue, By Type, 2020–2030 ($Million)
Table 34.France Fitness App Market Revenue, By Device Type, 2020–2030 ($Million)
Table 35.France Fitness App Market Revenue, By Operating System, 2020–2030 ($Million)
Table 36.France Fitness App Market Revenue, By Type, 2020–2030 ($Million)
Table 37.Italy Fitness App Market Revenue, By Device Type, 2020–2030 ($Million)
Table 38.Italy Fitness App Market Revenue, By Operating System, 2020–2030 ($Million)
Table 39.Italy Fitness App Market Revenue, By Type, 2020–2030 ($Million)
Table 40.Spain Fitness App Market Revenue, By Device Type, 2020–2030 ($Million)
Table 41.Spain Fitness App Market Revenue, By Operating System, 2020–2030 ($Million)
Table 42.Spain Fitness App Market Revenue, By Type, 2020–2030 ($Million)
Table 43.Rest Of Europe Fitness App Market Revenue, By Device Type, 2020–2030 ($Million)
Table 44.Rest Of Europe Fitness App Market Revenue, By Operating System, 2020–2030 ($Million)
Table 45.Rest Of Europe Fitness App Market Revenue, By Type, 2020–2030 ($Million)
Table 46.Asia-Pacific Fitness App Market Revenue, By Device Type, 2020–2030 ($Million)
Table 47.Asia-Pacific Fitness App Market Revenue, By Operating System, 2020–2030 ($Million)
Table 48.Asia-Pacific Fitness App Market Revenue, By Type, 2020–2030 ($Million)
Table 49.Asia-Pacific Fitness App Market Revenue, By Country, 2020–2030 ($Million)
Table 50.China Fitness App Market Revenue, By Device Type, 2020–2030 ($Million)
Table 51.China Fitness App Market Revenue, By Operating System, 2020–2030 ($Million)
Table 52.China Fitness App Market Revenue, By Type, 2020–2030 ($Million)
Table 53.Japan Fitness App Market Revenue, By Device Type, 2020–2030 ($Million)
Table 54.Japan Fitness App Market Revenue, By Operating System, 2020–2030 ($Million)
Table 55.Japan Fitness App Market Revenue, By Type, 2020–2030 ($Million)
Table 56.India Fitness App Market Revenue, By Device Type, 2020–2030 ($Million)
Table 57.India Fitness App Market Revenue, By Operating System, 2020–2030 ($Million)
Table 58.India Fitness App Market Revenue, By Type, 2020–2030 ($Million)
Table 59.Australia Fitness App Market Revenue, By Device Type, 2020–2030 ($Million)
Table 60.Australia Fitness App Market Revenue, By Operating System, 2020–2030 ($Million)
Table 61.Australia Fitness App Market Revenue, By Type, 2020–2030 ($Million)
Table 62.South Korea Fitness App Market Revenue, By Device Type, 2020–2030 ($Million)
Table 63.South Korea Fitness App Market Revenue, By Operating System, 2020–2030 ($Million)
Table 64.South Korea Fitness App Market Revenue, By Type, 2020–2030 ($Million)
Table 65.Rest Of Asia-Pacific Fitness App Market Revenue, By Device Type, 2020–2030 ($Million)
Table 66.Rest Of Asia-Pacific Fitness App Market Revenue, By Operating System, 2020–2030 ($Million)
Table 67.Rest Of Asia-Pacific Fitness App Market Revenue, By Type, 2020–2030 ($Million)
Table 68.Lamea Fitness App Market Revenue, By Device Type, 2020–2030 ($Million)
Table 69.Lamea Fitness App Market Revenue, By Operating System, 2020–2030 ($Million)
Table 70.Lamea Fitness App Market Revenue, By Type, 2020–2030 ($Million)
Table 71.Lamea Fitness App Market Revenue, By Country, 2020–2030 ($Million)
Table 72.Latin America Fitness App Market Revenue, By Device Type, 2020–2030 ($Million)
Table 73.Latin America Fitness App Market Revenue, By Operating System, 2020–2030 ($Million)
Table 74.Latin America Fitness App Market Revenue, By Type, 2020–2030 ($Million)
Table 75.Middle East Fitness App Market Revenue, By Device Type, 2020–2030 ($Million)
Table 76.Middle East Fitness App Market Revenue, By Operating System, 2020–2030 ($Million)
Table 77.Middle East Fitness App Market Revenue, By Type, 2020–2030 ($Million)
Table 78.Africa Fitness App Market Revenue, By Device Type, 2020–2030 ($Million)
Table 79.Africa Fitness App Market Revenue, By Operating System, 2020–2030 ($Million)
Table 80.Africa Fitness App Market Revenue, By Type, 2020–2030 ($Million)
Table 81.Aaptiv Inc: Key Executives
Table 82.Aaptiv Inc: Company Snapshot
Table 83.Aaptiv Inc: Product Portfolio
Table 84.Adidas: Key Executives
Table 85.Adidas.: Company Snapshot
Table 86.Adidas: Product Portfolio
Table 87.Applico Inc.: Key Executives
Table 88.Applico Inc.: Company Snapshot
Table 89.Applico Inc.: Product Portfolio
Table 90.Azumio, Inc.: Key Executives
Table 91.Azumio, Inc.: Company Snapshot
Table 92.Azumio, Inc.: Product Portfolio
Table 93.Fitbit Llc.: Key Executives
Table 94.Fitbit Llc.: Company Snapshot
Table 95.Fitbit Llc.: Product Portfolio
Table 96.Fitbit Llc.: Key Strategic Moves And Developments
Table 97.Fitnesskeeper: Key Executives
Table 98.Fitnesskeeper: Company Snapshot
Table 99.Fitnesskeeper: Product Portfolio
Table 100.Myfitnesspal, Inc.: Key Executives
Table 101.Myfitnesspal, Inc.: Company Snapshot
Table 102.Myfitnesspal, Inc.: Product Portfolio
Table 103.Nike, Inc.: Key Executives
Table 104.Nike, Inc.: Company Snapshot
Table 105.Nike, Inc.: Product Portfolio
Table 106.Noom Inc.: Key Executives
Table 107.Noom Inc.: Company Snapshot
Table 108.Noom Inc.: Product Portfolio
Table 109.Under Armour, Inc.: Key Executives
Table 110.Under Armour, Inc.: Company Snapshot
Table 111.Under Armour, Inc.: Product Portfolio
Table 112.Under Armour, Inc.: Key Strategic Moves And Developments
List Of Figures
Figure 01.Key Market Segments
Figure 02.Fitness App Market Snapshot, By Segmentation
Figure 03.Fitness App Market Snapshot, By Region
Figure 04.Top Impacting Factors
Figure 05.Top Investment Pockets
Figure 06.Moderate-To-High Bargaining Power Of Supplier
Figure 07.Moderate-To-High Threat Of New Entrants
Figure 08.Moderate Threat Of Substitutes
Figure 09.Moderate Intensity Of Rivalry
Figure 10.Low-To-High Bargaining Power Of Buyers
Figure 11.Fitness App Market Revenue, By Device Type, 2020–2030 ($Million)
Figure 12.Comparative Share Analysis For Fitness App Market For Smartphone, By Country, 2020 & 2030(%)
Figure 13.Comparative Share Analysis For Fitness App Market For Tablets, By Country, 2020 & 2030(%)
Figure 14.Comparative Share Analysis For Fitness App Market For Wearable Devices, By Country, 2020 & 2030(%)
Figure 15.Fitness App Market Revenue, By Operating System, 2020–2030 ($Million)
Figure 16.Comparative Share Analysis For Fitness App Market For Ios, By Country, 2020 & 2030(%)
Figure 17.Comparative Share Analysis For Fitness App Market For Android, By Country, 2020 & 2030(%)
Figure 18.Fitness App Market Revenue, By Type, 2020–2030 ($Million)
Figure 19.Comparative Share Analysis For Fitness App Market For Exercise & Weight Loss, By Country, 2020 & 2030(%)
Figure 20.Comparative Share Analysis For Fitness App Market For Diet & Nutrition, By Country, 2020 & 2030(%)
Figure 21.Comparative Share Analysis For Fitness App Market For Activity Tracking, By Country, 2020 & 2030(%)
Figure 22.Comparative Share Analysis For Fitness App Market For Others, By Country, 2020 & 2030(%)
Figure 23.U.S. Fitness App Market Revenue, 2020–2030 ($Million)
Figure 24.Canada Fitness App Market Revenue, 2020–2030 ($Million)
Figure 25.Germany Fitness App Market Revenue, 2020–2030 ($Million)
Figure 26.Uk Fitness App Market Revenue, 2020–2030 ($Million)
Figure 27.France Fitness App Market Revenue, 2020–2030 ($Million)
Figure 28.Italy Fitness App Market Revenue, 2020–2030 ($Million)
Figure 29.Spain Fitness App Market Revenue, 2020–2030 ($Million)
Figure 30.Rest Of Europe Fitness App Market Revenue, 2020–2030 ($Million)
Figure 31.China Fitness App Market Revenue, 2020–2030 ($Million)
Figure 32.Japan Fitness App Market Revenue, 2020–2030 ($Million)
Figure 33.India Fitness App Market Revenue, 2020–2030 ($Million)
Figure 34.Australia Fitness App Market Revenue, 2020–2030 ($Million)
Figure 35.South Korea Fitness App Market Revenue, 2020–2030 ($Million)
Figure 36.Rest Of Asia-Pacific Fitness App Market Revenue, 2020–2030 ($Million)
Figure 37.Latin America Fitness App Market Revenue, 2020–2030 ($Million)
Figure 38.Middle East Fitness App Market Revenue, 2020–2030 ($Million)
Figure 39.Africa Fitness App Market Revenue, 2020–2030 ($Million)
Figure 40.Key Player Positioning Anlysis: Global Fitness App Market
Figure 41.Competitive Dashboard
Figure 42.Competitive Dashboard
Figure 43.Competitive Heatmap Of Key Players
Figure 44.Top Winning Strategies, By Year, 2019-2021
Figure 45.Top Winning Strategies, By Development, 2019-2021
Figure 46.Top Winning Strategies, By Company, 2019-2021
Figure 47.Adidas: Revenue, 2018–2020 ($Million)
Figure 48.Adidas: Revenue Share By Region, 2020 (%)
Figure 49.R&D Expenditure, 2018–2020 ($Million)
Figure 50.Alphabet Inc.: Revenue, 2018–2020 ($Million)
Figure 51.Alphabet Inc.: Revenue Share By Segment, 2020 (%)
Figure 52.Alphabet Inc.: Revenue Share By Region, 2020 (%)
Figure 53.Nike, Inc.: Revenue, 2018–2020 ($Million)
Figure 54.Nike, Inc.: Revenue Share By Geography, 2020 (%)
Figure 55.Fitnesskeeper: Revenue, 2018–2020 ($Million)
Figure 56.Alphabet Inc.: Revenue Share By Region, 2020 (%)
$5244
$7999
HAVE A QUERY?
OUR CUSTOMER

Add to Cart
Add to Cart
Add to Cart
Add to Cart