
The Japan wired charging market size was valued at $0.8 billion in 2020, and is projected to reach $1.2 billion by 2030, growing at a CAGR of 3.8% from 2020 to 2030. Wired charging is done using a wire and is primarily used in the charging of consumer electronics such as mobile phones, laptops, tablets and other, electric vehicle and many other products used in healthcare, energy & power sectors. Wired charging plays an important role in the daily lives of human beings, as everyone is surrounded by chargeable gadgets. Rise in demand for mobile & laptops in this decade led to increase in demand for wired chargers, which acts as the major driving factor for the market.
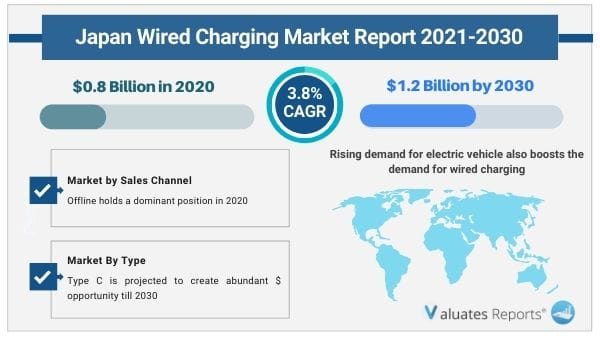
In addition, rising demand for electric vehicle also boosts the demand for wired charging. Moreover, the Japan market plays a significant role in the wired charging, as Japan is the world's third largest light-duty plug-in vehicle country market after China and the U.S. Furthermore, the government of Japan wants new cars to be electrified to become carbon neutral by 2050, electric vehicles have become more of a necessity for the country to meet these targets. Japan is a leading emitter of greenhouse gas emissions and automobiles account for a significant share in them.
In addition, huge investment plans of Japanese government with respect to electric vehicle charging system led to boost the wired charging market in Japan. Currently, there are three charging methods in Japan for electric-powered vehicles: basic charging, where a car is charged at private homes or condominiums; destination charging, where a car is charged at locations such as shopping malls, do-it-yourself (DIY) stores and family restaurants for the return trip home; and en-route charging at locations including expressway roadside service areas, roadside stations (michi no eki), gas stations, and convenience stores. In both destination and en-route charging, normal charging is suitable for longer-duration stops, while quick charging is appropriate for shorter stops.
Moreover, Japan is one of the countries that was early to the EV game, with the launch of Mitsubishi i-MIEV and Nissan LEAF more than a decade ago. The cars were supported by incentives, and the rollout of AC charging points and DC fast chargers that utilize the Japanese CHAdeMO standard (for several years the standard was spreading globally, including in Europe and North America).
The Japan wired charging market is segmented on the basis of type, charging type, application and sales channel.
Depending on type, the market is categorized into Type C, Micro USB, lightning and others. On the basis of charging type, it is divided into standard and fast charging. On the basis of application, it is classified into personal care, consumer electronics, automotive, energy & power, healthcare and others. Sales channel-wise, it is categorized into online and offline.
The Japan wired charging market analysis covers in-depth information about the major industry participants. The key players operating and profiled in the Japan wired charging industry report include ABB, AOYAMA Elevator Co., Ltd, Apple Inc., Dell Technologies Inc., Delta Electronics, Inc., Huawei Technology Co., Ltd., Samsung Electronics Co., Ltd., Sunvalley Group, Tesla and Webasto.
By Type, the type C segment dominated the Japan wired charging market in 2020, and is projected to remain the fastest-growing segment during the forecast period. This is attributed to its compatible nature and easy availability. In addition, Type C is more portable than other wired cable, since it is easier to fit and has long life than other cables which also act as the major driving factor for the market
By charging type, the standard segment dominated the Japan wired charging market in 2020, and is projected to remain the fastest-growing segment during the forecast period. This is attributed to effective price across the globe. In addition, standard charging provides better input to gadget which provide extra safety to battery free from ran out.
By application, the consumer electronics segment dominated Japan's wired charging market in 2020 and is projected to remain the fastest-growing segment during the forecast period. This is attributed due to the increase in demand for mobile, laptops and other electronic gadgets across the globe. In addition, rising laptop demand due to work from culture also led to increasing the demand of consumer electronics
By sales channel, the offline segment dominated Japan wired charging market in 2020, and is projected to remain the fastest-growing segment during the forecast period. This is attributed to easy availability and quick service. In addition, electric charger requires installation by company operating team which is also the main growth factor of offline sales channel.
|
Report Metric |
Details |
|
Report Name |
Japan Wired Charging Market |
|
The market size in 2020 |
USD 0.8 Billion |
|
The revenue forecast in 2030 |
USD 1.2 Billion |
|
Growth Rate |
Compound Annual Growth Rate (CAGR) of 3.8% from 2021 to 2030 |
|
Market size available for years |
2021-2030 |
|
Forecast units |
Value (USD) |
|
Segments covered |
Type, Charger Type, Sales Channel, End-User |
|
Report coverage |
Revenue & volume forecast, company share, competitive landscape, growth factors, and trends |
|
Geographic regions covered |
North America, Europe, Asia Pacific, Latin America, Middle East & Africa |
Ans. The Japan wired charging market size was valued at $0.8 billion in 2020, and is projected to reach $1.2 billion by 2030, growing at a CAGR of 3.8% from 2020 to 2030.
Ans. ABB, AOYAMA Elevator Co., Ltd, Apple Inc., Dell Technologies Inc., Delta Electronics, Inc., Huawei Technology Co., Ltd., Samsung Electronics Co., Ltd., Sunvalley Group, Tesla and Webasto Group
Ans. Consumer Electronics segment holds the maximum share of the Japan Wired Charging Market
Ans. The report provides an extensive qualitative and quantitative analysis of the current trends and future estimations of the Japan wired charging market from 2020 to 2030 to determine the prevailing opportunities.
Ans. Increase in demand for electric vehicle and other consumer electronic gadgets is the current trend expected to influence the Japan Wired Charging Market in the next few years
CHAPTER 1:INTRODUCTION
1.1.Report description
1.2.Key market segments
1.3.Key benefits for stakeholders
1.4.Research methodology
1.4.1.Primary research
1.4.2.Secondary research
1.4.3.Analyst tools and models
CHAPTER 2:EXECUTIVE SUMMARY
2.1.Key findings
2.2.CXO perspective
CHAPTER 3:MARKET OVERVIEW
3.1.Market definition and scope
3.2.Key findings
3.2.1.Top investment pockets
3.3.Key forces shaping the market
3.4.Market dynamics
3.4.1.Drivers
3.4.1.1.Rise in demand and sustainable development in electronics gadgets
3.4.1.2.Rise in demand for electric cars
3.4.1.3.Rise in demand for daily use electronic products
3.4.2.Restraints
3.4.2.1.Introduction of wireless charging
3.4.2.2.Low range of electric vehicle
3.4.2.3.Decomposition of wires and toxic effects of gadgets on human body
3.4.3.Opportunities
3.4.3.1.Rise in pollution by crude products and high oil prices led to enhance EV market
3.4.3.2.Rise in urbanization and tourism development
3.5.Pricing Analysis
3.6.Value Chain Analysis
3.7.Impact of key regulations on the Japan Wired Charging market
3.8.Impact of CORONA (COVID-19) outbreak on the market
CHAPTER 4:JAPAN WIRED CHARGING, BY TYPE
4.1.Overview
4.1.1.Market size and forecast, by Type
4.2.Type C
4.2.1.Key market trends, growth factors, and opportunities
4.2.2.Market size and forecast, 2020-2030 ($Million)
4.3.Micro USB
4.3.1.Key market trends, growth factors, and opportunities
4.3.2.Market size and forecast, 2020-2030 ($Million)
4.4.Lightning
4.4.1.Key market trends, growth factors, and opportunities
4.4.2.Market size and forecast, 2020-2030 ($Million)
4.5.Others
4.5.1.Key market trends, growth factors, and opportunities
4.5.2.Market size and forecast, 2020-2030 ($Million)
CHAPTER 5:JAPAN WIRED CHARGING, BY CHARGING TYPE
5.1.Overview
5.1.1.Market size and forecast, by charging type
5.2.Standard
5.2.1.Key market trends, growth factors, and opportunities
5.2.2.Market size and forecast, 2020-2030 ($Million)
5.3.Fast
5.3.1.Key market trends, growth factors, and opportunities
5.3.2.Market size and forecast, 2020-2030 ($Million)
CHAPTER 6:JAPAN WIRED CHARGING, BY APPLICATION
6.1.Overview
6.1.1.Market size and forecast, by application
6.2.Personal care
6.2.1.Key market trends, growth factors, and opportunities
6.2.2.Market size and forecast, 2020-2030 ($Million)
6.3.Consumer electronics
6.3.1.Key market trends, growth factors, and opportunities
6.3.2.Market size and forecast, 2020-2030 ($Million)
6.4.Automotive
6.4.1.Key market trends, growth factors, and opportunities
6.4.2.Market size and forecast, 2020-2030 ($Million)
6.5.Energy & power
6.5.1.Key market trends, growth factors, and opportunities
6.5.2.Market size and forecast, 2020-2030 ($Million)
6.6.Healthcare
6.6.1.Key market trends, growth factors, and opportunities
6.6.2.Market size and forecast, 2020-2030 ($Million)
6.7.Other
6.7.1.Key market trends, growth factors, and opportunities
6.7.2.Market size and forecast, 2020-2030 ($Million)
CHAPTER 7:JAPAN WIRED CHARGING MARKET, BY SALES CHANNEL
7.1.Overview
7.1.1.Market size and forecast, by application
7.2.Online
7.2.1.Key market trends, growth factors, and opportunities
7.2.2.Market size and forecast, 2020-2030 ($Million)
7.3.Offline
7.3.1.Key market trends, growth factors, and opportunities
7.3.2.Market size and forecast, 2020-2030 ($Million)
CHAPTER 8:COMPETITIVE LANDSCAPE
8.1.Introduction
8.1.1.Market player positioning, 2020
8.1.2.Company share analysis, 2020
8.2.Top winning strategies
8.2.1.Top winning strategies, by year
8.2.2.Top winning strategies, by development
8.2.3.Top winning strategies, by company
8.3.Product mapping of top 10 players
8.4.Competitive heatmap
8.5.Key developments
8.5.1.New product launches
8.5.2.Expansions
CHAPTER 9:COMPANY PROFILES
9.1.ABB
9.1.1.Company overview
9.1.2.Company snapshot
9.1.3.Key executives
9.1.4.Operating business segments
9.1.5.Product portfolio
9.1.6.Business performance
9.1.7.Key strategic moves and developments
9.1.8.ABB- SWOT Analysis
9.2.AOYAMA ELEVATOR CO., LTD
9.2.1.Company overview
9.2.2.Company snapshot
9.2.3.Product portfolio
9.2.4.AOYAMA Elevator Co., Ltd - SWOT Analysis
9.3.APPLE INC.
9.3.1.Company overview
9.3.2.Company snapshot
9.3.3.Key executives
9.3.4.Product portfolio
9.3.5.Business performance
9.3.6.Apple Inc. - SWOT Analysis
9.4.DELL TECHNOLOGIES INC.
9.4.1.Company overview
9.4.2.Company snapshot
9.4.3.Key executives
9.4.4.Operating business segments
9.4.5.Product portfolio
9.4.6.Business performance
9.4.7.Dell Technologies Inc. - SWOT Analysis
9.5.DELTA ELECTRONICS, INC.
9.5.1.Company overview
9.5.2.Company snapshot
9.5.3.Key executives
9.5.4.Operating business segments
9.5.5.Product portfolio
9.5.6.Business performance
9.5.7.Key strategic moves and developments
9.5.8.Delta Electronics, Inc. - SWOT Analysis
9.6.HUAWEI TECHNOLOGY CO., LTD.
9.6.1.Company overview
9.6.2.Company snapshot
9.6.3.Key executives
9.6.4.Operating business segments
9.6.5.Product portfolio
9.6.6.Business performance
9.6.7.Key strategic moves and developments
9.6.8.Huawei Technology Co., Ltd. - SWOT Analysis
9.7.SAMSUNG ELECTRONICS CO., LTD.
9.7.1.Company overview
9.7.2.Company snapshot
9.7.3.Key executives
9.7.4.Operating business segments
9.7.5.Product portfolio
9.7.6.Business performance
9.7.7.Samsung Electronics Co., Ltd. - SWOT Analysis
9.8.SUNVALLEY GROUP
9.8.1.Company overview
9.8.2.Company snapshot
9.8.3.Key executives
9.8.4.Product portfolio
9.8.5.Sunvalley Group - SWOT Analysis
9.9.TESLA
9.9.1.Company overview
9.9.2.Company snapshot
9.9.3.Key executives
9.9.4.Operating business segments
9.9.5.Product portfolio
9.9.6.Business performance
9.9.7.Key strategic moves and developments
9.9.8.Tesla - SWOT Analysis
9.10.WEBASTO GROUP
9.10.1.Company overview
9.10.2.Company snapshot
9.10.3.Key executives
9.10.4.Operating business segments
9.10.5.Product portfolio
9.10.6.Business performance
9.10.7.Key strategic moves and developments
9.10.8.Webasto Group - SWOT Analysis
Table 01.Japan Wired Charging, By Type 2020–2030 ($Million)
Table 02.Japan Wired Charging, By Type 2020–2030 (Million Units)
Table 03.Japan Wired Charging, By Charging Type 2020–2030 ($Million)
Table 04.Japan Wired Charging, By Charging Type 2020–2030 (Million Units)
Table 05.Japan Wired Charging, By Application 2020–2030 ($Million)
Table 06.Japan Wired Charging, By Application 2020–2030 (Million Units)
Table 07.Japan Wired Charging, By Sales Channel 2020–2030 ($Million)
Table 08.Japan Wired Charging, By Sales Channel 2020–2030 (Million Units)
Table 09.Key New Product Launches (2017–2021)
Table 10.Key Expansions (2017–2021)
Table 11.Abb: Company Snapshot
Table 12.Abb: Key Executives
Table 13.Abb: Operating Segments
Table 14.Abb: Product Portfolio
Table 15.Overall Financial Status ($Million)
Table 16.Abb: Key Strategic Moves And Developments
Table 17.Abb: Swot Analysis
Table 18.Aoyama Elevator Co., Ltd.: Company Snapshot
Table 19.Aoyama Elevator Co., Ltd.: Product Portfolio
Table 20.Aoyama Elevator Co., Ltd.: Swot Analysis
Table 21.Apple Inc.: Company Snapshot
Table 22.Apple Inc.: Key Executives
Table 23.Apple Inc.: Product Portfolio
Table 24.Overall Financial Status ($Million)
Table 25.Apple Inc.: Swot Analysis
Table 26.Dell Technologies Inc.: Company Snapshot
Table 27.Dell Technologies Inc.: Key Executives
Table 28.Dell Technologies Inc..: Operating Segments
Table 29.Dell Technologies Inc.: Product Portfolio
Table 30.Overall Financial Status ($Million)
Table 31.Dell Technologies Inc.: Swot Analysis
Table 32.Delta Electronics, Inc.: Company Snapshot
Table 33.Delta Electronics, Inc.: Key Executives
Table 34.Delta Electronics, Inc.: Operating Segments
Table 35.Delta Electronics, Inc.: Product Portfolio
Table 36.Overall Financial Status ($Million)
Table 37.Delta Electronics, Inc.: Key Strategic Moves And Developments
Table 38.Delta Electronics, Inc.: Swot Analysis
Table 39.Huawei Technology Co., Ltd.: Company Snapshot
Table 40.Huawei Technology Co., Ltd.: Key Executives
Table 41.Huawei Technology Co., Ltd.: Operating Segments
Table 42.Huawei Technology Co., Ltd.: Product Portfolio
Table 43.Overall Financial Status ($Million)
Table 44.Huawei Technology Co., Ltd.: Key Strategic Moves And Developments
Table 45.Huawei Technology Co., Ltd.: Swot Analysis
Table 46.Samsung Electronics Co., Ltd.: Company Snapshot
Table 47.Samsung Electronics Co., Ltd.: Key Executives
Table 48.Samsung Electronics Co., Ltd..: Operating Segments
Table 49.Samsung Electronics Co., Ltd.: Product Portfolio
Table 50.Overall Financial Status ($Million)
Table 51.Samsung Electronics Co., Ltd.: Swot Analysis
Table 52.Sunvalley Group: Company Snapshot
Table 53.Sunvalley Group: Key Executives
Table 54.Sunvalley Group: Product Portfolio
Table 55.Sunvalley Group: Swot Analysis
Table 56.Tesla: Company Snapshot
Table 57.Tesla: Key Executives
Table 58.Tesla: Operating Segments
Table 59.Tesla: Product Portfolio
Table 60.Overall Financial Status ($Million)
Table 61.Tesla: Key Strategic Moves And Developments
Table 62.Tesla: Swot Analysis
Table 63.Webasto Group: Company Snapshot
Table 64.Webasto Group: Key Executives
Table 65.Webasto Group: Operating Segments
Table 66.Webasto Group: Product Portfolio
Table 67.Overall Financial Status ($Million)
Table 68.Webasto Group: Key Strategic Moves And Developments
Table 69.Webasto Group: Swot Analysis
List Of Figures
Figure 01.Japan Wired Charging Market Snapshot, By Segmentation, 2021–2030
Figure 02.Japan Wired Charging Market Segmentation
Figure 03.Top Investment Pockets
Figure 04.Moderate Bargaining Power Of Suppliers
Figure 05.High Threat Of New Entrants
Figure 06.Low Threat Of Substitutes
Figure 07.Moderate Intensity Of Competitive Rivalry
Figure 08.Moderate Bargaining Power Of Buyers
Figure 09.Japan Wired Charging Dynamics
Figure 10.Pricing Analysis
Figure 11.Value Chain Analysis
Figure 12.Japan Wired Charging Revenue, By Type ($Million)
Figure 13.Market Size And Forecast, 2020-2030 ($Million)
Figure 14.Market Size And Forecast, 2020-2030 ($Million)
Figure 15.Market Size And Forecast, 2020-2030 ($Million)
Figure 16.Market Size And Forecast, 2020-2030 ($Million)
Figure 17.Japan Wired Charging Revenue, By Charging Type ($Million)
Figure 18.Market Size And Forecast, 2020-2030 ($Million)
Figure 19.Market Size And Forecast, 2020-2030 ($Million)
Figure 20.Japan Wired Charging Revenue, By Application ($Million)
Figure 21.Market Size And Forecast, 2020-2030 ($Million)
Figure 22.Market Size And Forecast, 2020-2030 ($Million)
Figure 23.Market Size And Forecast, 2020-2030 ($Million)
Figure 24.Market Size And Forecast, 2020-2030 ($Million)
Figure 25.Market Size And Forecast, 2020-2030 ($Million)
Figure 26.Market Size And Forecast, 2020-2030 ($Million)
Figure 27.Japan Wired Charging Market Revenue, By Sales Channel ($Million)
Figure 28.Market Size And Forecast, 2020-2030 ($Million)
Figure 29.Market Size And Forecast, 2020-2030 ($Million)
Figure 30.Market Player Positioning, 2020
Figure 31.Company Share Analysis, 2020
Figure 32.Top Winning Strategies, By Year, 2017–2021
Figure 33.Top Winning Strategies, By Development, 2017–2021 (%)
Figure 34.Top Winning Strategies, By Company, 2017–2021
Figure 35.Product Mapping Of Top 10 Players
Figure 36.Competitive Heatmap Of Key Players
Figure 37.Abb: Revenue, 2018-2020 ($Million)
Figure 38.Abb: Revenue Share By Segment, 2020 (%)
Figure 39.Abb: Revenue Share By Region, 2020 (%)
Figure 40.Apple Inc.: Revenue, 2018-2020 ($Million)
Figure 41.Apple Inc.: Revenue Share By Segment, 2020 (%)
Figure 42.Apple Inc.: Revenue Share By Region, 2020 (%)
Figure 43.Dell Technologies Inc.: Net Sales, 2018–2020 ($Million)
Figure 44.Dell Technologies Inc.: Revenue Share, By Segment, 2020 (%)
Figure 45.Dell Technologies Inc.: Revenue Share, By Region, 2020 (%)
Figure 46.Delta Electronics, Inc.: Net Sales, 2018–2020 ($Million)
Figure 47.Delta Electronics, Inc.: Revenue Share By Segment, 2020 (%)
Figure 48.Delta Electronics, Inc.: Revenue Share By Region, 2020 (%)
Figure 49.Huawei Technology Co., Ltd.: Revenue, 2018-2020 ($Million)
Figure 50.Huawei Technology Co., Ltd.: Revenue Share By Segment, 2020 (%)
Figure 51.Huawei Technology Co., Ltd.: Revenue Share By Region, 2020 (%)
Figure 52.Samsung Electronics Co., Ltd.: Net Sales, 2018–2020 ($Million)
Figure 53.Samsung Electronics Co., Ltd.: Revenue Share, By Segment, 2020 (%)
Figure 54.Samsung Electronics Co., Ltd.: Revenue Share, By Region, 2020 (%)
Figure 55.Tesla.: Net Sales, 2018–2020 ($Million)
Figure 56.Tesla: Revenue Share By Segment, 2020 (%)
Figure 57.Webasto Group: Revenue, 2018–2020 ($Million)
Figure 58.Webasto Group: Revenue Share By Segment, 2020(%)
Figure 59.Webasto Group: Revenue Share By Region, 2020 (%)
$5769
$9995
HAVE A QUERY?
OUR CUSTOMER

Add to Cart
Add to Cart
Add to Cart
Add to Cart