
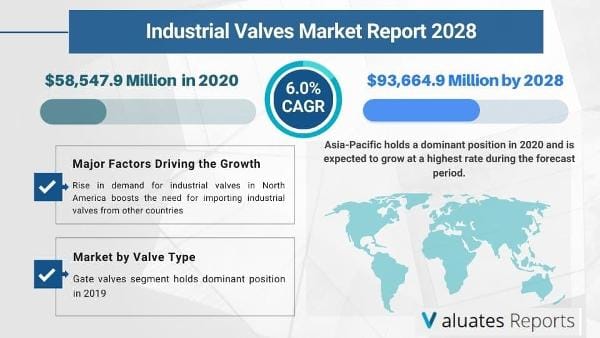
The global industrial valves market size is expected to reach $93,664.9 million in 2028, from $58,547.9 million in 2020, growing at a CAGR of 6.0% from 2021 to 2028. The industrial valves market is a saturated market with slow organic growth. However, under ‘Industry 4.0,’ major industries are switching toward automation of industrial processes, which is likely to create a demand for industrial valves globally. The automated regulation and control of valves in industrial applications can upgrade the global industrial valves market substantially during the forecast period.
Industrial valves are used in process industries for direction, regulation, and control of gases, slurries, liquids, vapors, and others. Industrial valves are mainly manufactured using carbon steel, cast iron, stainless steel, and other high functioning metal alloys to obtain efficient flow control in industries such as water & waste water, oil & power, food & beverages, chemicals, and others.
The COVID-19 pandemic has hindered the demand for industrial valves in North America and Europe, however, China exhibited significant growth in demand during the outbreak of COVID-19 pandemic.
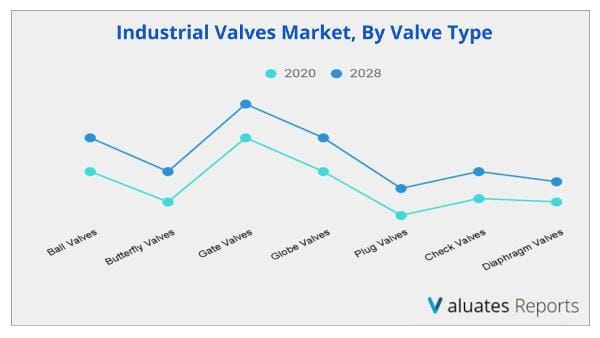
Moreover, a valve mainly consists of a main body, a stem, and a seat that are generally manufactured using different materials including polymers, rubber, metals, and others to avoid wastage of liquid flowing through the valve. Valves are mainly differentiated by their operating mechanisms. The most widely used valves in industries are globe valves, butterfly valves, ball valves, gate vales, plug valves, pinch valves, diaphragm valves, and check valves.
This is expected to create massive demand for industrial valves, which in turn will boost the growth of the market.
Furthermore, the oil & gas industry is the largest consumer of industrial valves globally, and includes the use of industrial valves in downstream, midstream, and upstream process applications. Rise in demand for industrial valves in North America boosts the need for importing industrial valves from other countries; thereby, driving the industrial valves market growth. Moreover, the food & beverages processing industry is largely saturated in the developed countries, including the European Union countries, the U.S., and China.
 >
>
On the contrary, the integration of artificial intelligence and internet of things (IoT) in manufacturing processes under the “Industry 4.0” upgradation is anticipated to provide lucrative opportunities for the growth of the industrial valves market globally.
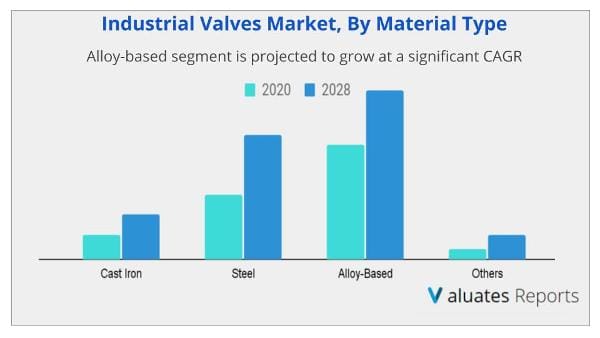
The global industrial valves market is segmented on the basis of material type, valve type, application, and region. By material type, the market is categorized into cast iron, steel, alloy-based, and others.
However, rise in demand for food from developing nations such as Brazil, India, and others boosts the agriculture industry, which in turn fuels the growth of the food & beverage processing industry. This is further expected to drive the demand for industrial valves; thereby, fostering the growth of the industrial valves industry.
However, the U.S. administration increased the tariffs on derivative aluminum and steel imports, effective from February 8, 2020. This hike includes 25% surge on steel and 10% surge on aluminum imports, which has negatively affected the U.S. manufacturing sector. Although the tariff is aimed at gaining more revenues from imports, the global trade for industrial valves has been affected negatively. Industrial valves manufacturing utilizes steel on a large scale, and the tariff on steel is anticipated to hinder the growth of the market.
Asia-Pacific is the largest contributor in the industrial valves industry with the highest share during 2020. The industrial valves market has lucrative growth opportunities in China and India, which are likely to exhibit significant growth during the forecast period. This is due to the low material costs and extensive growth in industrial infrastructure during the past years.
Depending on valve type, gate valves segment held a major share in the industrial valves market during 2020. Although the gate, globe, and check valves are largely popular for food & beverages, oil & power, and other industrial applications. Considering the application segment, oil & power industry has significantly contributed to industrial valves market share during the base period. The oil & gas industry mainly includes downstream, midstream, and upstream applications and require industrial valves on a large scale. In addition, major countries in Europe and Asia-Pacific are now switching toward clean power sources, which has created a large demand for valves during infrastructural upgradation processes.
The global industrial valves market is segmented into material type, valve type, application, and region. By material type, the market is categorized into cast iron, steel, alloy based, and others. Depending on valve type, it is segregated into ball valves, butterfly valves, gate valves, globe valves, plug valves, check valves, and diaphragm valves. On the basis of application, it is differentiated into oil & power, water & wastewater, chemical, food & beverage, and others.
The global industrial valves market is analyzed across North America (the U.S., Canada, and Mexico), Europe (the UK, Germany, France, Italy, and rest of Europe), Asia-Pacific (China, India, Japan, and rest of Asia-Pacific), and LAMEA (Latin America, the Middle East, and Africa). North America is expected to hold the largest market share throughout the study period, and Asia-Pacific is expected to grow at the fastest rate.
The major players operating in the industrial valves industry include AVK Holding A/S, Avcon Controls Private Limited, Schlumberger Limited, Crane Co., Emerson Electric Co., Flowserve Corporation, Forbes Marshall, IMI plc, Metso Corporation, and The Weir Group plc.
Many competitors in the industrial valves market adopted acquisition as their key developmental strategy to expand their geographical foothold and upgrade their product technologies. For instance, in June 2019, Crane Co. acquired Circor International Corporation, which is a U.S.-based manufacturer of flow and motion control products. It provides products such as pumps, valves, actuators, and others for industrial applications, and the acquisition has aided Crane Co. to improve its foothold in the U.S. Similarly, in August 2019, IMI plc acquired PBM Inc., which is a specialty valve manufacturer and offers a wide portfolio of industrial valves and other flow control products.
Ans. On the basis of valve type, the gate valves segment is expected to be the most influencing segment growing in the global industrial valves market report.
Ans. Based on the end-user industry, in 2020, the oil & power segment generated the highest revenue, accounting for 35.5% of the market and is projected to grow at a CAGR of 6.8% from 2020 to 2027.
Ans. The global industrial valves market size is expected to reach $93,664.9 million in 2028 from $58,547.9 million in 2020, growing at a CAGR of 6.0% from 2021 to 2028. In 2020
Ans. Rise in demand for food from developing nations such as Brazil, India, and others boosts the agriculture industry, which in turn fuels the growth of the food & beverage processing industry. This is further expected to drive the demand for industrial valves
Ans. The major players operating in the industrial valves industry include AVK Holding A/S, Avcon Controls Private Limited, Schlumberger Limited, Crane Co., Emerson Electric Co., Flowserve Corporation, Forbes Marshall, IMI plc, Metso Corporation, and The Weir Group plc.
Ans. The forecast period considered for the global industrial valves market is 2021 to 2028, wherein, 2020 is the base year, 2021 is the estimated year, and 2028 is the forecast year.
CHAPTER 1:INTRODUCTION
1.1.Report description
1.2.Key benefits for stakeholders
1.3.Key market segments
1.4.Research methodology
1.4.1.Primary research
1.4.2.Secondary research
1.4.3.Analyst tools and models
CHAPTER 2:EXECUTIVE SUMMARY
2.1.Key findings of the study
2.2.CXO perspective
CHAPTER 3:MARKET OVERVIEW
3.1.Market definition and scope
3.2.Key findings
3.2.1.Top impacting factors
3.2.2.Top investment pockets
3.3.Porter's five forces analysis
3.4.Value chain analysis
3.5.Market dynamics
3.5.1.Drivers
3.5.1.1.Growth in demand for automation in control industrial valves
3.5.1.2.Surge in investments for oil & gas industry in North America
3.5.1.3.Growth in food & beverage processing industry in developing countries
3.5.2.Restraints
3.5.2.1.Increased tariff on trade of raw materials
3.5.3.Opportunity
3.5.3.1.Demand for high technology valves
CHAPTER 4:INDUSTRIAL VALVES MARKET, BY MATERIAL TYPE
4.1.Market overview
4.1.1.Market size and forecast, by material type
4.2.Cast Iron
4.2.1.Key market trends, growth factors, and opportunities
4.2.2.Market size and forecast, by region
4.2.3.Market analysis by country
4.3.Steel
4.3.1.Key market trends, growth factors, and opportunities
4.3.2.Market size and forecast, by region
4.3.3.Market analysis by country
4.4.Alloy based
4.4.1.Key market trends, growth factors, and opportunities
4.4.2.Market size and forecast, by region
4.4.3.Market analysis by country
4.5.Others
4.5.1.Key market trends, growth factors, and opportunities
4.5.2.Market size and forecast, by region
4.5.3.Market analysis by country
CHAPTER 5:INDUSTRIAL VALVES MARKET, BY VALVE TYPE
5.1.Overview
5.1.1.Market size and forecast, by valve type
5.2.Ball valves
5.2.1.Key market trends, growth factors, and opportunities
5.2.2.Market size and forecast, by region
5.2.3.Market analysis, by country
5.3.Butterfly valves
5.3.1.Key market trends, growth factors, and opportunities
5.3.2.Market size and forecast, by region
5.3.3.Market analysis, by country
5.4.Gate valves
5.4.1.Key growth factors and opportunities
5.4.2.Market size and forecast, by region
5.4.3.Market analysis, by country
5.5.Globe valves
5.5.1.Key growth factors and opportunities
5.5.2.Market size and forecast, by region
5.5.3.Market analysis, by country
5.6.Plug valves
5.6.1.Key growth factors and opportunities
5.6.2.Market size and forecast, by region
5.6.3.Market analysis, by country
5.7.Check valves
5.7.1.Key growth factors and opportunities
5.7.2.Market size and forecast, by region
5.7.3.Market analysis, by country
5.8.Diaphragm valves
5.8.1.Key growth factors and opportunities
5.8.2.Market size and forecast, by region
5.8.3.Market analysis, by country
CHAPTER 6:INDUSTRIAL VALVES MARKET, BY APPLICATION
6.1.Overview
6.1.1.Market size and forecast, by application
6.2.Oil & power industry
6.2.1.Key market trends, growth factors, and opportunities
6.2.2.Market size and forecast, by region
6.2.3.Market analysis, by country
6.3.Water & Wastewater
6.3.1.Key market trends, growth factors, and opportunities
6.3.2.Market size and forecast, by region
6.3.3.Market analysis, by country
6.4.Chemical
6.4.1.Key market trends, growth factors, and opportunities
6.4.2.Market size and forecast, by region
6.4.3.Market analysis, by country
6.5.Food & beverage
6.5.1.Key market trends, growth factors, and opportunities
6.5.2.Market size and forecast, by region
6.5.3.Market analysis, by country
6.6.Others
6.6.1.Key market trends, growth factors, and opportunities
6.6.2.Market size and forecast, by region
6.6.3.Market analysis, by country
CHAPTER 7:INDUSTRIAL VALVES MARKET, BY REGION
7.1.Overview
7.1.1.Market size and forecast, by region
7.2.North America
7.2.1.Key market trends and opportunities
7.2.2.Market size and forecast, by material type
7.2.3.Market size and forecast, by valve type
7.2.4.Market size and forecast, by application
7.2.5.Market analysis, by country
7.2.5.1.U.S.
7.2.5.1.1.Market size and forecast, by material type
7.2.5.1.2.Market size and forecast, by valve type
7.2.5.1.3.Market size and forecast, by application
7.2.5.2.Canada
7.2.5.2.1.Market size and forecast, by material type
7.2.5.2.2.Market size and forecast, by valve type
7.2.5.2.3.Market size and forecast, by application
7.2.5.3.Mexico
7.2.5.3.1.Market size and forecast, by material type
7.2.5.3.2.Market size and forecast, by valve type
7.2.5.3.3.Market size and forecast, by application
7.3.Europe
7.3.1.Key market trends, growth factors, and opportunities
7.3.2.Market size and forecast, by material type
7.3.3.Market size and forecast, by valve type
7.3.4.Market size and forecast, by application
7.3.5.Europe Market size and forecast, by country
7.3.5.1.UK
7.3.5.1.1.Market size and forecast, by material type
7.3.5.1.2.Market size and forecast, by valve type
7.3.5.1.3.Market size and forecast, by application
7.3.5.2.Germany
7.3.5.2.1.Market size and forecast, by material type
7.3.5.2.2.Market size and forecast, by valve type
7.3.5.2.3.Market size and forecast, by application
7.3.5.3.France
7.3.5.3.1.Market size and forecast, by material type
7.3.5.3.2.Market size and forecast, by valve type
7.3.5.3.3.Market size and forecast, by application
7.3.5.4.Italy
7.3.5.4.1.Market size and forecast, by material type
7.3.5.4.2.Market size and forecast, by valve type
7.3.5.4.3.Market size and forecast, by application
7.3.5.5.Rest of Europe
7.3.5.5.1.Market size and forecast, by material type
7.3.5.5.2.Market size and forecast, by valve type
7.3.5.5.3.Market size and forecast, by application
7.4.Asia-Pacific
7.4.1.Key market trends, growth factors, and opportunities
7.4.2.Market size and forecast, by material type
7.4.3.Market size and forecast, by valve type
7.4.4.Market size and forecast, by application
7.4.5.Market size and forecast, by country
7.4.5.1.China
7.4.5.1.1.Market size and forecast, by material type
7.4.5.1.2.Market size and forecast, by valve type
7.4.5.1.3.Market size and forecast, by application
7.4.5.2.Japan
7.4.5.2.1.Market size and forecast, by material type
7.4.5.2.2.Market size and forecast, by valve type
7.4.5.2.3.Market size and forecast, by application
7.4.5.3.India
7.4.5.3.1.Market size and forecast, by material type
7.4.5.3.2.Market size and forecast, by valve type
7.4.5.3.3.Market size and forecast, by application
7.4.5.4.Rest of Asia-Pacific
7.4.5.4.1.Market size and forecast, by material type
7.4.5.4.2.Market size and forecast, by valve type
7.4.5.4.3.Market size and forecast, by application
7.5.LAMEA
7.5.1.Key market trends, growth factors, and opportunities
7.5.2.Market size and forecast, by material type
7.5.3.Market size and forecast, by valve type
7.5.4.Market size and forecast, by application
7.5.5.Market size and forecast, by country
7.5.5.1.Latin America
7.5.5.1.1.Market size and forecast, by material type
7.5.5.1.2.Market size and forecast, by valve type
7.5.5.1.3.Market size and forecast, by application
7.5.5.2.Middle East
7.5.5.2.1.Market size and forecast, by material type
7.5.5.2.2.Market size and forecast, by valve type
7.5.5.2.3.Market size and forecast, by application
7.5.5.3.Africa
7.5.5.3.1.Market size and forecast, by material type
7.5.5.3.2.Market size and forecast, by valve type
7.5.5.3.3.Market size and forecast, by application
CHAPTER 8:COMPETITIVE LANDSCAPE
8.1.Introduction
8.1.1.Market player positioning, 2019
8.2.Top winning strategies
CHAPTER 9:COMPANY PROFILES: INDUSTRIAL VALVES MARKET
9.1.AVK Holdings A/S
9.1.1.Company overview
9.1.2.Key executives
9.1.3.Company snapshot
9.1.4.Operating segments
9.1.5.Product portfolio
9.1.6.Business performance
9.1.7.Key strategic moves and developments
9.2.Avcon Controls Systems Pvt. Ltd.
9.2.1.Company overview
9.2.2.Key executives
9.2.3.Company snapshot
9.2.4.Operating segments
9.2.5.Product portfolio
9.2.6.Key strategic moves and developments
9.3.Schlumberger Ltd.
9.3.1.Company overview
9.3.2.Key executives
9.3.3.Company snapshot
9.3.4.Operating business segments
9.3.5.Product portfolio
9.3.6.R&D expenditure
9.3.7.Business Performance
9.3.8.Key strategic moves and developments
9.4.Crane Co.
9.4.1.Company overview
9.4.2.Key executive
9.4.3.Company snapshot
9.4.4.Operating business segments
9.4.5.Product portfolio
9.4.6.R&D expenditure
9.4.7.Business performance
9.4.8.Key strategic moves and developments
9.5.Emerson Electric Co.
9.5.1.Company overview
9.5.2.Key executives
9.5.3.Company snapshot
9.5.4.Operating business segments
9.5.5.Product portfolio
9.5.6.R&D expenditure
9.5.7.Business performance
9.5.8.Key strategic moves and developments
9.6.Flowserve Corporation
9.6.1.Company overview
9.6.2.Key executives
9.6.3.Company snapshot
9.6.4.Operating business segments
9.6.5.Product portfolio
9.6.6.R&D expenditure
9.6.7.Business performance
9.7.Forbes Marshall
9.7.1.Company overview
9.7.2.Key executives
9.7.3.Company snapshot
9.7.4.Operating segments
9.7.5.Product portfolio
9.8.IMI Plc
9.8.1.Company overview
9.8.2.Key executives
9.8.3.Company snapshot
9.8.4.Operating business segments
9.8.5.Product portfolio
9.8.6.R&D expenditure
9.8.7.Business performance
9.8.8.Key strategic moves and developments
9.9.Metso Corporation.
9.9.1.Company overview
9.9.2.Key executives
9.9.3.Company snapshot
9.9.4.Operating business segments
9.9.5.Product portfolio
9.9.6.R&D expenditure
9.9.7.Business performance
9.9.8.Key strategic moves and developments
9.10.The Weir Group Plc.
9.10.1.Company overview
9.10.2.Key executive
9.10.3.Company snapshot
9.10.4.Operating Segments
9.10.5.Product portfolio
9.10.6.R&D expenditure
9.10.7.Business performance
9.10.8.Key strategic moves and developments
Table 01.Global Industrial Valves Market, By Material Type, 2019-2027 ($Million)
Table 02.Cast Iron Industrial Valves Market Revenue, By Region, 2020-2027 ($Million)
Table 03.Steel Industrial Valves Market Revenue, By Region, 2020-2027 ($Million)
Table 04.Alloy-based Industrial Valves Market Revenue, By Region, 2020-2027 ($Million)
Table 05.Other Industrial Valves Market Revenue, By Region, 2020-2027 ($Million)
Table 06.Global Industrial Valves Market Revenue, By Valve Type, 2019-2027 ($Million)
Table 07.Industrial Valves Market Revenue For Ball Valves, By Region 2020-2028 ($Million)
Table 08.Industrial Valves Market Revenue For Butterfly Valves, By Region 2020-2028 ($Million)
Table 09.Industrial Valves Market Revenue For Gate Valves, By Region 2019-2027($Million)
Table 10.Industrial Valves Market Revenue For Globe Valves, By Region 2019-2027($Million)
Table 11.Industrial Valves Market Revenue For Plug Valves, By Region 2019-2027($Million)
Table 12.Industrial Valves Market Revenue For Check Valves, By Region 2019-2027($Million)
Table 13.Industrial Valves Market Revenue For Diaphragm Valves, By Region 2019-2027($Million)
Table 14.Global Industrial Valves Market Revenue, By Application, 2019-2027 ($Million)
Table 15.Industrial Valves Market Revenue For Oil & Power, By Region 2020-2028 ($Million)
Table 16.Industrial Valves Market Revenue For Water & Wastewater, By Region 2020-2028 ($Million)
Table 17.Industrial Valves Market Revenue For Chemicals, By Region 2020-2028 ($Million)
Table 18.Industrial Valves Market Revenue For Food & Beverage, By Region 2020-2028 ($Million)
Table 19.Industrial Valves Market Revenue For Others, By Region 2020-2028 ($Million)
Table 20.Global Industrial Valves Market Revenue, By Region 2020-2027 ($Million)
Table 21.North America Smoke Detector Market Revenue, By Material Type 2020-2028 ($Million)
Table 22.North America Smoke Detector Market Revenue, By Valve Type, 2020-2028 ($Million)
Table 23.North America Smoke Detector Market Revenue, By Application 2020-2028 ($Million)
Table 24.North America Smoke Detector Market Revenue, By Country 2020-2028 ($Million)
Table 25.U.S. Industrial Valves Market Revenue, By Material Type 2020-2028 ($Million)
Table 26.U.S. Industrial Valves Market Revenue, By Valve Type 2020-2028 ($Million)
Table 27.U.S. Industrial Valves Market Revenue, By Application 2020-2028 ($Million)
Table 28.Canada Industrial Valves Market Revenue, By Material Type 2020-2028 ($Million)
Table 29.Canada Industrial Valves Market Revenue, By Valve Type 2020-2028 ($Million)
Table 30.Canada Industrial Valves Market Revenue, By Application 2020-2028 ($Million)
Table 31.Mexico Industrial Valves Market Revenue, By Material Type 2020-2028 ($Million)
Table 32.Mexico Industrial Valves Market Revenue, By Valve Type 2020-2028 ($Million)
Table 33.Mexico Industrial Valves Market Revenue, By Application 2020-2028 ($Million)
Table 34.Europe Smoke Detector Market Revenue, By Material Type 2020-2028 ($Million)
Table 35.Europe Industrial Valves Market Revenue, By Valve Type, 2020-2028 ($Million)
Table 36.Europe Industrial Valves Market Revenue, By Application 2020-2028 ($Million)
Table 37.Europe Industrial Valves Market Revenue, By Country 2020-2028 ($Million)
Table 38.Uk Smoke Detector Market Revenue, By Material Type 2020-2028 ($Million)
Table 39.Uk Industrial Valves Market Revenue, By Valve Type 2020-2028 ($Million)
Table 40.Uk Smoke Detector Market Revenue, By Application 2020-2028 ($Million)
Table 41.Germany Industrial Valves Market Revenue, By Material Type 2020-2028 ($Million)
Table 42.Germany Industrial Valves Market Revenue, By Valve Type 2020-2028 ($Million)
Table 43.Germany Industrial Valves Market Revenue, By Application 2020-2028 ($Million)
Table 44.France Industrial Valves Market Revenue, By Material Type 2020-2028 ($Million)
Table 45.France Industrial Valves Market Revenue, By Valve Type 2020-2028 ($Million)
Table 46.France Industrial Valves Market Revenue, By Application 2020-2028 ($Million)
Table 47.Italy Industrial Valves Market Revenue, By Material Type 2020-2028 ($Million)
Table 48.Italy Industrial Valves Market Revenue, By Valve Type 2020-2028 ($Million)
Table 49.Italy Industrial Valves Market Revenue, By Application 2020-2028 ($Million)
Table 50.Rest Of Europe Industrial Valves Market Revenue, By Material Type 2020-2028 ($Million)
Table 51.Rest Of Europe Industrial Valves Market Revenue, By Valve Type 2020-2028 ($Million)
Table 52.Rest Of Europe Industrial Valves Market Revenue, By Application 2020-2028 ($Million)
Table 53.Asia-pacific Idnustrial Valves Market Revenue, By Material Type 2020-2028 ($Million)
Table 54.Asia-pacific Industrial Valves Market Revenue, By Valve Type, 2020-2028 ($Million)
Table 55.Asia-pacific Industrial Valves Market Revenue, By Application 2020-2028 ($Million)
Table 56.Asia-pacific Industrial Valves Market Revenue, By Country 2020-2028 ($Million)
Table 57.China Industrial Valves Market Revenue, By Material Type 2020-2028 ($Million)
Table 58.China Industrial Valves Market Revenue, By Valve Type 2020-2028 ($Million)
Table 59.China Industrial Valves Market Revenue, By Application 2020-2028 ($Million)
Table 60.Japan Industrial Valves Market Revenue, By Material Type 2020-2028 ($Million)
Table 61.Japan Industrial Valves Market Revenue, By Valves Type 2020-2028 ($Million)
Table 62.Japan Industrial Valves Market Revenue, By Application 2020-2028 ($Million)
Table 63.India Industrial Valves Market Revenue, By Material Type 2020-2028 ($Million)
Table 64.India Industrial Valves Market Revenue, By Valve Type 2020-2028 ($Million)
Table 65.India Industrial Valves Market Revenue, By Application 2020-2028 ($Million)
Table 66.Rest Of Asia-pacific Industrial Valves Market Revenue, By Material Type 2020-2028 ($Million)
Table 67.Rest Of Asia-pacific Industrial Valves Market Revenue, By Valve Type 2020-2028 ($Million)
Table 68.Rest Of Asia-pacific Industrial Valves Market Revenue, By Application 2020-2028 ($Million)
Table 69.Lamea Industrial Valves Market Revenue, By Material Type 2020-2028 ($Million)
Table 70.Lamea Industrial Valves Market Revenue, By Valve Type, 2020-2028 ($Million)
Table 71.Lamea Industrial Valves Market Revenue, By Application 2020-2028 ($Million)
Table 72.Lamea Industrial Valves Market Revenue, By Country 2020-2028 ($Million)
Table 73.Latin America Industrial Valves Market Revenue, By Material Type 2020-2028 ($Million)
Table 74.Latin America Industrial Valves Market Revenue, By Valve Type 2020-2028 ($Million)
Table 75.Latin America Industrial Valves Market Revenue, By Application 2020-2028 ($Million)
Table 76.Middle East Industrial Valves Market Revenue, By Material Type 2020-2028 ($Million)
Table 77.Middle East Industrial Valves Market Revenue, By Valve Type 2020-2028 ($Million)
Table 78.Middle East Industrial Valves Market Revenue, By Application 2020-2028 ($Million)
Table 79.Africa Industrial Valves Market Revenue, By Material Type 2020-2028 ($Million)
Table 80.Africa Industrial Valves Market Revenue, By Valve Type 2020-2028 ($Million)
Table 81.Africa Industrial Valves Market Revenue, By Application 2020-2028 ($Million)
Table 82.Avk Holding A/S: Key Executives
Table 83.Avk Holding A/S: Company Snapshot
Table 84.Akg Holdings A/S: Operating Segments
Table 85.Avk Holdings A/S: Product Portfolio
Table 86.Avcon Controls Systems Pvt Ltd: Key Executive
Table 87.Avcon Controls Pvt Ltd: Company Snapshot
Table 88.Avcon Controls Pvt Ltd: Operating Segments
Table 89.Avcon Controls Pvt Ltd: Product Portfolio
Table 90.Schlumberger Limited: Key Executives
Table 91.Schlumberger Limited: Company Snapshot
Table 92.Schlumberger: Operating Segments
Table 93.Schlumberger Ltd: Product Portfolio
Table 94.Crane Co.: Key Executive
Table 95.Crane Co.: Company Snapshot
Table 96.Crane Co.: Operating Segments
Table 97.Crane Co: Product Portfolio
Table 98.Emerson Electric Co.: Key Executives
Table 99.Ememrson Electric Co.: Company Snapshot
Table 100.Emerson Electric Co.: Operating Segments
Table 101.Emerson Electric Co.: Product Portfolio
Table 102.Flowserve Corporation: Key Executives
Table 103.Flowserve Corporation: Company Snapshot
Table 104.Flowserve Corporation: Operating Segments
Table 105.Flowserve Corporation: Product Portfolio
Table 106.Forbes Marshall: Key Executives
Table 107.Forbes Marshall: Company Snapshot
Table 108.Forbes Marshall: Operating Segments
Table 109.Forbes Marshall: Product Portfolio
Table 110.Imi Plc: Key Executives
Table 111.Imi Plc: Company Snapshot
Table 112.Imi Plc: Operating Segments
Table 113.Imi Plc: Product Portfolio
Table 114.Metso Corporation: Key Executives
Table 115.Metso Corporation: Company Snapshot
Table 116.Metso Corporation: Operating Segments
Table 117.Metso Corporation: Product Portfolio
Table 118.The Weir Group Plc: Key Executive
Table 119.The Weir Group Plc: Company Snapshot
Table 120.The Weir Group Plc: Operating Segments
Table 121.The Weir Group Plc: Product Portfolio
List Of Figures
Figure 01.Key Market Segments
Figure 02.Executive Summary
Figure 03.Top Impacting Factors
Figure 04.Top Investment Pockets
Figure 05.Moderate To High Bargaining Power Of Suppliers
Figure 06.Low To Moderate Bargaining Power Of Buyers
Figure 07.Moderate To High Threat Of Substitutes
Figure 08.Low To Moderate Threat Of New Entrants
Figure 09.Moderate Intensity Of Rivalry
Figure 10.Value Chain Analysis
Figure 11.Global Industrial Valves Market, By Material Type, 2020-2027
Figure 12.Comparative Share Analysis Of Industrial Valves Market Revenue For Cast Iron, By Country, 2020 & 2028 (%)
Figure 13.Comparative Share Analysis Of Industrial Valves Market Revenue For Steel, By Country, 2020 & 2028 (%)
Figure 14.Comparative Share Analysis Of Alloy-based Industrial Valves Market Revenue, By Country, 2020 & 2028 (%)
Figure 15.Comparative Share Analysis Of Other Industrial Valves Market Revenue, By Country, 2020 & 2028 (%)
Figure 16.Comparative Share Analysis Of Industrial Valves Market For Ball Valves, By Country, 2020 & 2028 (%)
Figure 17.Comparative Share Analysis Of Industrial Valves Market For Butterfly Valves, By Country, 2020 & 2028 (%)
Figure 18.Comparative Share Analysis Of Industrial Valves Market For Gate Valves, By Country, 2020 & 2028 (%)
Figure 19.Comparative Share Analysis Of Industrial Valves Market For Globe Valves, By Country, 2020 & 2028 (%)
Figure 20.Comparative Share Analysis Of Industrial Valves Market For Plug Valves, By Country, 2020 & 2028 (%)
Figure 21.Comparative Share Analysis Of Industrial Valves Market For Check Valves, By Country, 2020 & 2028 (%)
Figure 22.Comparative Share Analysis Of Industrial Valves Market For Diaphragm Valves, By Country, 2020 & 2028 (%)
Figure 23.Global Industrial Valves Market, By Application, 2020-2027
Figure 24.Comparative Share Analysis Of Industrial Valves Market For Oil & Power, By Country, 2020 & 2028 (%)
Figure 25.Comparative Share Analysis Of Industrial Valves Market For Water & Wastewater, By Country, 2020 & 2028 (%)
Figure 26.Comparative Share Analysis Of Industrial Valves Market For Chemicals, By Country, 2020 & 2028 (%)
Figure 27.Comparative Share Analysis Of Industrial Valves Market For Food & Beverage, By Country, 2020 & 2028 (%)
Figure 28.Comparative Share Analysis Of Industrial Valves Market For Others, By Country, 2020 & 2028 (%)
Figure 29.Global Industrial Valves Market, By Region, 2020-2027
Figure 30.U.S. Industrial Valves Market Revenue, 2020-2028 ($Million)
Figure 31.Canada Industrial Valves Market Revenue, 2020-2028 ($Million)
Figure 32.Mexico Industrial Valves Market Revenue, 2020-2028 ($Million)
Figure 33.Uk Industrial Valves Market Revenue, 2020-2028 ($Million)
Figure 34.Germany Industrial Valves Market Revenue, 2020-2028 ($Million)
Figure 35.France Industrial Valves Market Revenue, 2020-2028 ($Million)
Figure 36.Italy Industrial Valves Market Revenue, 2020-2028 ($Million)
Figure 37.Rest Of Europe Industrial Valves Market Revenue, 2020-2028 ($Million)
Figure 38.China Industrial Valves Market Revenue, 2020-2028 ($Million)
Figure 39.Japan Industrial Valves Market Revenue, 2020-2028 ($Million)
Figure 40.India Industrial Valves Market Revenue, 2020-2028 ($Million)
Figure 41.Rest Of Asia-pacific Industrial Valves Market Revenue, 2020-2028 ($Million)
Figure 42.Latin America Industrial Valves Market Revenue, 2020-2028 ($Million)
Figure 43.Middle East Industrial Valves Market Revenue, 2020-2028 ($Million)
Figure 44.Africa Industrial Valves Market Revenue, 2020-2028 ($Million)
Figure 45.Market Player Positioning, 2019
Figure 46.Top Winning Strategies, By Year, 2017-2019
Figure 47.Top Winning Strategies, By Development, 2017–2019 (%)
Figure 48.Top Winning Strategies, By Company, 2017–2019 (%)
Figure 49.Avk Holdings As: Net Sales, 2018–2020 ($Million)
Figure 50.Schlumberger Ltd: R&D Expenditure, 2018-2020 ($Million)
Figure 51.Schlumberger Ltd:Net Sales, 2018-2020 ($Million)
Figure 52.Schlumberger Ltd: Revenue Share By Segments, 2020 (%)
Figure 53.Schlumberger Limited: Revenue Share By Region, 2020 (%)
Figure 54.Crane Co.: R&D Expenditure, 2018–2020 ($Million)
Figure 55.Crane Co.: Revenue, 2018–2020 ($Million)
Figure 56.Crane Co.: Revenue Share By Segment, 2020 (%)
Figure 57.Crane Co.: Revenue Share By Region, 2020 (%)
Figure 58.Emerson Electric Co.: R&D Expenditure, 2018–2020 ($Million)
Figure 59.Emerson Electric Co.: Revenue, 2018–2020 ($Million)
Figure 60.Emerson Electric Co.: Revenue Share By Segment, 2020 (%)
Figure 61.Emerson Electric Co.: Revenue Share By Region, 2020 (%)
Figure 62.Flowserve Corporation: R&D Expenditure, 2018–2020 ($Million)
Figure 63.Flowserve Corporation: Revenue, 2018–2020 ($Million)
Figure 64.Flowserve Corporation: Revenue Share By Segment, 2020 (%)
Figure 65.Flowserve Corporation: Revenue Share By Region, 2020 (%)
Figure 66.Imi Plc: R&D Expenditure, 2018–2020 ($Million)
Figure 67.Imi Plc: Revenue, 2018–2020 ($Million)
Figure 68.Imi Plc: Revenue Share By Segment, 2020 (%)
Figure 69.Imi Plc: Revenue Share By Region, 2020 (%)
Figure 70.Metso Corporation: R&D Expenditure, 2018–2020 ($Million)
Figure 71.Metso Corporation: Revenue, 2018–2020 ($Million)
Figure 72.Metso Corporation: Revenue Share By Segment, 2019 (%)
Figure 73.Metso Corporation: Revenue Share By Region, 2019 (%)
Figure 74.The Weir Group: R&D Expenditure, 2018–2020 ($Million)
Figure 75.The Weir Group Plc: Revenue, 2018–2020 ($Million)
Figure 77.The Weir Group: Revenue Share By Segments, 2020 (%)
Figure 78.The Weir Group Plc: Revenue Share By Region, 2020 (%)
$5769
$8995
HAVE A QUERY?
OUR CUSTOMER
