
Over The Top (OTT) Market Statistics 2027
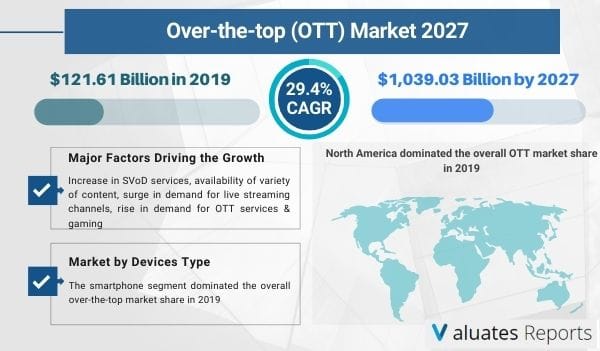
The global OTT market size was valued at USD 121.61 Billion in 2019 and is projected to reach USD 1,039.03 Billion by 2027, growing at a CAGR of 29.4% from 2020 to 2027. Rise in demand for OTT services in developing regions, increase of subscription video-on-demand (SVoD) services, availability of a variety of content, the surge in demand for live streaming channels, the emergence of new OTT markets, and new developments in OTT technology are the factors that majorly boost the growth of the market.
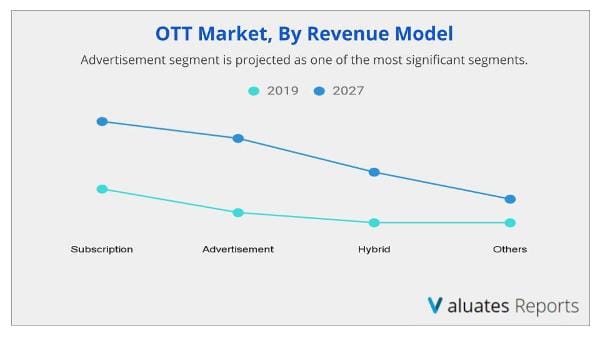
Ad-supported VoD platforms is experiencing strong growth in ad revenues, thereby making the advertisement-based revenue model popular amidst the COVID-19 pandemic. For instance, five of the major ad-supported streaming platforms such as Hulu, Peacock, Roku, Pluto TV, and Tubi, ad revenue reached 31% year-over-year in the second quarter of 2020.
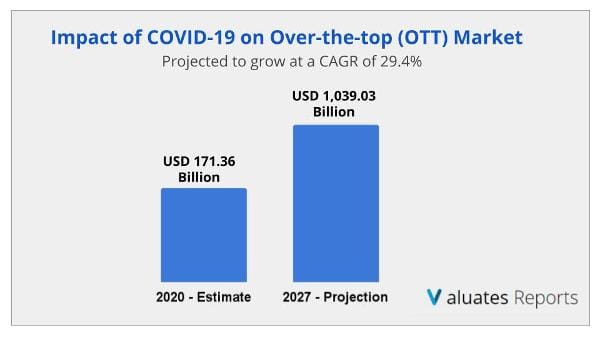
Post COVID-19, the size of the Over the Top Market size is estimated to grow from $171.36 billion in 2020 and projected to reach $1,039.03 billion by 2027, at a CAGR of 29.4%. The current estimation of 2027 is projected to be higher than pre-COVID-19 estimates.
The COVID-19 outbreak has a positive impact on the growth of the global Over the Top Market, due to constantly rising demand for Over the Top services. This demand is majorly attributed to continuous growth in online communications services, owing to the lockdown imposed, as more number of viewers are communicating through various online platforms. Moreover, the consumption of online entertainment platforms is increasing remarkably in developing economies such as India and China, which is positively impacting the growth of the market. According to the survey by InMobi, a mobile marketing platform, 46% viewers are watching more online content, while another consumer survey has revealed that OTT consumption primetime has moved to 7 pm onwards, as opposed to 10 pm–12 am before.
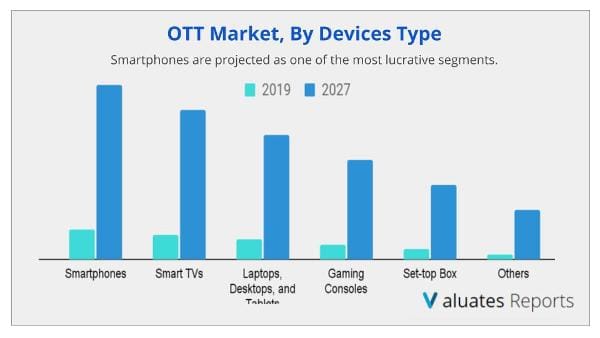
The smartphone segment dominated the overall over-the-top market share in 2019 and is expected to remain dominant during the forecast period, due to increase in adoption of smartphones to stream over-the-top services and growth in the potential market for larger screen smartphones in developing economies. In addition, the segment is expected to witness high growth rate in the upcoming years, due to the advent of affordable Android-based smartphones, which have democratized online gaming and brought the gameplay to millions of smartphone users.
The media & entertainment industry dominated the over-the-top market share in 2019 and is expected to remain dominant during the forecast period, due to a rise in a number of digital video consumers. This is expected to increase the demand for Over the Top services in the media & entertainment industry. However, the IT & telecom industry is expected to witness highest CAGR during the forecast period, due to upsurge in demand for over-the-top services in the telecommunication industry for video calling, voice, and messaging services.
North America dominated the overall Over the Top Market share in 2019, as the region is equipped with high broadband access as well as a number of services, which have already moved on to providing several videos in HD and 4K. Moreover, new services such as AT&T, ESPN, Turner Sports, and Crown Family Media Networks experienced strong traction in the U.S., which fuels the growth of the market. However, Asia-Pacific is expected to grow at the highest CAGR, as telecommunication providers offer OTT services with their data plans, which fuels the over-the-top market growth. In addition, the increase in penetration of mobile devices and government policies regarding regulating the content on video streaming platforms are enabling the exponential rise of adoption of Over the Top services.
The report focuses on the growth prospects, restraints, and over-the-top market analysis. The study provides Porter’s five forces analysis of the online/virtual fitness industry to understand the impact of various factors such as bargaining power of suppliers, competitive intensity of competitors, the threat of new entrants, the threat of substitutes, and bargaining power of buyers on the over-the-top market trends.
The global over-the-top market is segmented into component, device type, content type, revenue model, user type, end-user, and region. On the basis of component, the market is bifurcated into solutions and services. Depending on device type, it is classified into smart devices, laptops, desktops & tablets, gaming consoles, set-top box, and others. By content type, it is fragmented into video, audio, games, communication, and others. According to the revenue model, it is categorized into a subscription, advertisement, hybrid, and other. As per industry vertical, the over-the-top industry is segregated into media & entertainment, education & training, health & fitness, sports & live events, IT & telecom, e-commerce, BFSI, government, and others. Region-wise, it is analyzed across North America, Europe, Asia-Pacific, and LAMEA.
The growth of the global over-the-top market is driven by factors such as rise in demand for OTT services in developing regions, increase in SVoD services, availability of a variety of content, the surge in demand for live streaming channels, rise in demand for OTT services & gaming during the lockdown period implemented due to the COVID-19 outbreak, and availability of freemium models in price-sensitive markets. In addition, the emergence of new Over the Top Markets and new developments in OTT technology are expected to notably impact the growth of the market. Lack of data network infrastructure and latency issues further affect the growth of the market. However, each of these factors is anticipated to have a definite impact on the market growth during the forecast period.
Owing to the outbreak of COVID-19, governments of almost every country have enforced lockdown, which has resulted in the massive growth of OTT platforms. According to the CXOs, viewership on the OTT platforms is expected to grow further during the over-the-top market forecast period, as television channels are running out of content. Owing to the lockdown imposed, TV channels are running old content, as they have been unable to shoot. This has drifted viewers toward OTT to watch fresh content, which is expected to notably drive the growth of the market.
Moreover, as the demand for new OTT entertainment content has grown tremendously, the number of OTT service providers are offering some of their content for free and are launching new content on their platform. For instance, to cater to the continuously growing demand of consumers, platforms such as Zee5 and Amazon Prime Video have made few of their shows free to watch under its #BeCalmBeEntertained initiative. In addition, the Indian OTT service provider, Zee5 platform has witnessed almost an 80% increase in subscriptions and over 50% growth in time spent recently. Furthermore, Amazon Prime Video recently has made some of the kids’ content on its platform free in India.
OTT operators are expected to offer more live streaming channels in the future. In addition, OTT content will witness a major transformation with breaking news reaching Periscope, Facebook Live, and even YouTube. Broadcasters in the U.S. are collaborating with multichannel video programming distributors (MVPDs) to offer a ready version of live and linear feeds, which can be packaged as OTT offerings, thereby fueling the growth of the market. As the COVID-19 pandemic began and the lockdown was implemented, streaming of live content increased tremendously, which is opportunistic for the market. For instance, the live-streaming sector grew by 45% between March and April in 2020, and these gains are directly attributable to the outbreak of coronavirus. Moreover, viewers are live streaming Twitch concerts, Zoom lectures, office meetings, and virtual book launches, which is expected to provide lucrative opportunities for the market.
Solution
Services
Smartphones
Smart TVs
Laptops, Desktops, and Tablets
Gaming Consoles
Set-top Box
Others
Video
Audio/VoIP
Games
Communication
Others
Subscription
Advertisement
Hybrid
Others
Personal
Commercial
Media & Entertainment
Education & Training
Health & Fitness
IT & Telecom
E-commerce
BFSI
Government
Others
North America
U.S.
Canada
Europe
Germany
France
UK
Italy
Spain
Catalonia
Rest of Europe
Asia-Pacific
Japan
China
Australia
India
South Korea
Indonesia
Rest of Asia-Pacific
LAMEA
Brazil
Mexico
Argentina
Turkey
Saudi Arabia
South Africa
Rest of LAMEA
Ans. Some of the key market players profiled in the report include Amazon Web Services (AWS), Netflix, Hulu, LLC, Google LLC, Apple Inc., Facebook, Telestra, Rakuten Inc., Microsoft Corporation, and Tencent Holdings Ltd. This study includes OTT market trends, over-the-top market size, over-the-top market analysis, and future estimations to determine the imminent investment pockets.
Ans. By Device Type, Smartphones are projected as one of the most lucrative segments
Ans. North America dominated the overall OTT market share in 2019, as the region is equipped with high broadband access as well as number of services, which have already moved on to providing several videos in HD and 4K
Ans. The forecast period for over the top market is 2020 to 2027
Ans. The global over the top market size was valued at $121.61 billion in 2019, and is projected to reach $1,039.03 billion by 2027, growing at a CAGR of 29.4% from 2020 to 2027
Ans. The growth of the global over-the-top market is driven by factors such as rise in demand for OTT services in developing regions, increase in SVoD services, availability of variety of content, surge in demand for live streaming channels, rise in demand for OTT services & gaming.
CHAPTER 1:INTRODUCTION
1.1.REPORT DESCRIPTION
1.2.KEY BENEFITS FOR STAKEHOLDERS
1.3.KEY MARKET SEGMENTS
1.4.RESEARCH METHODOLOGY
1.4.1.Secondary research
1.4.2.Primary research
1.4.3.Analyst tools & models
CHAPTER 2:EXECUTIVE SUMMARY
2.1.KEY FINDINGS
2.1.1.Top impacting factors
2.1.2.Top investment pockets
2.2.CXO PERSPECTIVE
CHAPTER 3:MARKET OVERVIEW
3.1.MARKET DEFINITION AND SCOPE
3.2.KEY FORCES SHAPING OVER-THE-TOP MARKET
3.3.VALUE CHAIN ANALYSIS
3.4.MARKET EVOLUTION/INDUSTRY ROADMAP
3.5.CASE STUDIES
3.5.1.Case study 01
3.5.2.Case study 02
3.5.3.Case study 03
3.6.MARKET DYNAMICS
3.6.1.Drivers
3.6.1.1.Surge in demand for OTT services in developing regions
3.6.1.2.Rise in SVoD services in emerging markets
3.6.1.3.Availability of variety of content
3.6.1.4.Surge in demand for live streaming channels
3.6.1.5.Rise in demand for OTT services and gaming during lockdown
3.6.2.Restraints
3.6.2.1.Lack of data network infrastructure
3.6.2.2.Latency issues
3.6.3.Opportunities
3.6.3.1.Emergence of new OTT markets
3.6.3.2.New developments in OTT technology
3.1.COVID-19 IMPACT ANALYSIS ON GLOBAL OVER-THE-TOP MARKET
3.1.1.Impact on market size
3.1.2.Consumer trends, preferences, and budget impact
3.1.3.Regulatory framework
3.1.4.Economic impact
3.1.5.Key player strategies to tackle negative impact
3.1.6.Opportunity window
CHAPTER 4:OVER-THE-TOP MARKET, BY COMPONENT
4.1.OVERVIEW
4.2.SOLUTION
4.2.1.Key market trends, growth factors, and opportunities
4.2.2.Market size and forecast, by region
4.2.3.Market analysis, by country
4.3.SERVICES
4.3.1.Key market trends, growth factors, and opportunities
4.3.2.Market size and forecast, by region
4.3.3.Market Analysis, by country
CHAPTER 5:OVER-THE-TOP MARKET, BY DEVICE TYPE
5.1.OVERVIEW
5.2.SMARTPHONES
5.2.1.Key market trends, growth factors, and opportunities
5.2.2.Market size and forecast, by region
5.2.3.Market analysis, by country
5.3.SMART TVS
5.3.1.Key market trends, growth factors, and opportunities
5.3.2.Market size and forecast, by region
5.3.3.Market analysis, by country
5.4.LAPTOPS, DESKTOPS, & TABLETS
5.4.1.Key market trends, growth factors, and opportunities
5.4.2.Market size and forecast, by region
5.4.3.Market analysis, by country
5.5.GAMING CONSOLES
5.5.1.Key market trends, growth factors, and opportunities
5.5.2.Market size and forecast, by region
5.5.3.Market analysis, by country
5.6.SET-TOP BOX
5.6.1.Key market trends, growth factors, and opportunities
5.6.2.Market size and forecast, by region
5.6.3.Market analysis, by country
5.7.OTHERS
5.7.1.Key market trends, growth factors, and opportunities
5.7.2.Market size and forecast, by region
5.7.3.Market analysis, by country
CHAPTER 6:OVER-THE-TOP MARKET, BY CONTENT TYPE
6.1.OVERVIEW
6.2.VIDEO
6.2.1.Key market trends, growth factors, and opportunities
6.2.2.Market size and forecast, by region
6.2.3.Market analysis, by country
6.3.AUDIO
6.3.1.Key market trends, growth factors, and opportunities
6.3.2.Market size and forecast, by region
6.3.3.Market analysis, by country
6.4.GAMES
6.4.1.Key market trends, growth factors, and opportunities
6.4.2.Market size and forecast, by region
6.4.3.Market analysis, by country
6.5.COMMUNICATION
6.5.1.Key market trends, growth factors, and opportunities
6.5.2.Market size and forecast, by region
6.5.3.Market analysis, by country
6.6.OTHERS
6.6.1.Key market trends, growth factors, and opportunities
6.6.2.Market size and forecast, by region
6.6.3.Market analysis, by country
CHAPTER 7:OVER-THE-TOP MARKET, BY REVENUE MODEL
7.1.OVERVIEW
7.2.SUBSCRIPTION
7.2.1.Key market trends, growth factors, and opportunities
7.2.2.Market size and forecast, by region
7.2.3.Market analysis, by country
7.3.ADVERTISEMENT
7.3.1.Key market trends, growth factors, and opportunities
7.3.2.Market size and forecast, by region
7.3.3.Market analysis, by country
7.4.HYBRID
7.4.1.Key market trends, growth factors, and opportunities
7.4.2.Market size and forecast, by region
7.4.3.Market analysis, by country
7.5.OTHERS
7.5.1.Key market trends, growth factors, and opportunities
7.5.2.Market size and forecast, by region
7.5.3.Market analysis, by country
CHAPTER 8:OVER-THE-TOP MARKET, BY USER TYPE
8.1.OVERVIEW
8.2.PERSONAL
8.2.1.Key market trends, growth factors, and opportunities
8.2.2.Market size and forecast, by region
8.2.3.Market analysis, by country
8.3.COMMERCIAL
8.3.1.Key market trends, growth factors, and opportunities
8.3.2.Market size and forecast, by region
8.3.3.Market analysis, by country
CHAPTER 9:OVER-THE-TOP MARKET, BY END USER
9.1.OVERVIEW
9.2.MEDIA & ENTERTAINMENT
9.2.1.Key market trends, growth factors, and opportunities
9.2.2.Market size and forecast, by region
9.2.3.Market analysis, by country
9.3.EDUCATION & TRAINING
9.3.1.Key market trends, growth factors, and opportunities
9.3.2.Market size and forecast, by region
9.3.3.Market analysis, by country
9.4.HEALTH & FITNESS
9.4.1.Key market trends, growth factors, and opportunities
9.4.2.Market size and forecast, by region
9.4.3.Market analysis, by country
9.5.IT & TELECOM
9.5.1.Key market trends, growth factors, and opportunities
9.5.2.Market size and forecast, by region
9.5.3.Market analysis, by country
9.6.E-COMMERCE
9.6.1.Key market trends, growth factors, and opportunities
9.6.2.Market size and forecast, by region
9.6.3.Market analysis, by country
9.7.BFSI
9.7.1.Key market trends, growth factors, and opportunities
9.7.2.Market size and forecast, by region
9.7.3.Market analysis, by country
9.8.GOVERNMENT
9.8.1.Key market trends, growth factors, and opportunities
9.8.2.Market size and forecast, by region
9.8.3.Market analysis, by country
9.9.OTHERS
9.9.1.Key market trends, growth factors, and opportunities
9.9.2.Market size and forecast, by region
9.9.3.Market analysis, by country
CHAPTER 10:OVER-THE-TOP MARKET, BY REGION
10.1.OVERVIEW
10.2.NORTH AMERICA
10.2.1.Key market trends, growth factors, and opportunities
10.2.2.Market size and forecast, by component
10.2.3.Market size and forecast, by device type
10.2.4.Market size and forecast, by content type
10.2.5.Market size and forecast, by revenue model
10.2.6.Market size and forecast, by user type
10.2.7.Market size and forecast, by end user
10.2.8.Market analysis by country
10.2.8.1.U.S.
10.2.8.1.1.Market size and forecast, by component
10.2.8.1.2.Market size and forecast, by device type
10.2.8.1.3.Market size and forecast, by content type
10.2.8.1.4.Market size and forecast, by revenue model
10.2.8.1.5.Market size and forecast, by user type
10.2.8.1.6.Market size and forecast, by end user
10.2.8.2.Canada
10.2.8.2.1.Market size and forecast, by component
10.2.8.2.2.Market size and forecast, by device type
10.2.8.2.3.Market size and forecast, by content type
10.2.8.2.4.Market size and forecast, by revenue model
10.2.8.2.5.Market size and forecast, by user type
10.2.8.2.6.Market size and forecast, by end user
10.3.EUROPE
10.3.1.Key market trends, growth factors, and opportunities
10.3.2.Market size and forecast, by component
10.3.3.Market size and forecast, by device type
10.3.4.Market size and forecast, by content type
10.3.5.Market size and forecast, by revenue model
10.3.6.Market size and forecast, by user type
10.3.7.Market size and forecast, by end user
10.3.8.Market analysis by country
10.3.8.1.Germany
10.3.8.1.1.Market size and forecast, by component
10.3.8.1.2.Market size and forecast, by device type
10.3.8.1.3.Market size and forecast, by content type
10.3.8.1.4.Market size and forecast, by revenue model
10.3.8.1.5.Market size and forecast, by user type
10.3.8.1.6.Market size and forecast, by end user
10.3.8.2.France
10.3.8.2.1.Market size and forecast, by component
10.3.8.2.2.Market size and forecast, by device type
10.3.8.2.3.Market size and forecast, by content type
10.3.8.2.4.Market size and forecast, by revenue model
10.3.8.2.5.Market size and forecast, by user type
10.3.8.2.6.Market size and forecast, by end user
10.3.8.3.UK
10.3.8.3.1.Market size and forecast, by component
10.3.8.3.2.Market size and forecast, by device type
10.3.8.3.3.Market size and forecast, by content type
10.3.8.3.4.Market size and forecast, by revenue model
10.3.8.3.5.Market size and forecast, by user type
10.3.8.3.6.Market size and forecast, by end user
10.3.8.4.Italy
10.3.8.4.1.Market size and forecast, by component
10.3.8.4.2.Market size and forecast, by device type
10.3.8.4.3.Market size and forecast, by content type
10.3.8.4.4.Market size and forecast, by revenue model
10.3.8.4.5.Market size and forecast, by user type
10.3.8.4.6.Market size and forecast, by end user
10.3.8.5.Spain
10.3.8.5.1.Market size and forecast, by component
10.3.8.5.2.Market size and forecast, by device type
10.3.8.5.3.Market size and forecast, by content type
10.3.8.5.4.Market size and forecast, by revenue model
10.3.8.5.5.Market size and forecast, by user type
10.3.8.5.6.Market size and forecast, by end user
10.3.8.6.Catalonia
10.3.8.6.1.Market size and forecast, by component
10.3.8.6.2.Market size and forecast, by device type
10.3.8.6.3.Market size and forecast, by content type
10.3.8.6.4.Market size and forecast, by revenue model
10.3.8.6.5.Market size and forecast, by user type
10.3.8.6.6.Market size and forecast, by end user
10.3.8.7.Rest of Europe
10.3.8.7.1.Market size and forecast, by component
10.3.8.7.2.Market size and forecast, by device type
10.3.8.7.3.Market size and forecast, by content type
10.3.8.7.4.Market size and forecast, by revenue model
10.3.8.7.5.Market size and forecast, by user type
10.3.8.7.6.Market size and forecast, by end user
10.4.ASIA-PACIFIC
10.4.1.Key market trends, growth factors, and opportunities
10.4.2.Market size and forecast, by component
10.4.3.Market size and forecast, by device type
10.4.4.Market size and forecast, by content type
10.4.5.Market size and forecast, by revenue model
10.4.6.Market size and forecast, by user type
10.4.7.Market size and forecast, by end user
10.4.8.Market analysis by country
10.4.8.1.Japan
10.4.8.1.1.Market size and forecast, by component
10.4.8.1.2.Market size and forecast, by device type
10.4.8.1.3.Market size and forecast, by content type
10.4.8.1.4.Market size and forecast, by revenue model
10.4.8.1.5.Market size and forecast, by user type
10.4.8.1.6.Market size and forecast, by end user
10.4.8.2.China
10.4.8.2.1.Market size and forecast, by component
10.4.8.2.2.Market size and forecast, by device type
10.4.8.2.3.Market size and forecast, by content type
10.4.8.2.4.Market size and forecast, by revenue model
10.4.8.2.5.Market size and forecast, by user type
10.4.8.2.6.Market size and forecast, by end user
10.4.8.4.Australia
10.4.8.4.1.Market size and forecast, by component
10.4.8.4.2.Market size and forecast, by device type
10.4.8.4.3.Market size and forecast, by content type
10.4.8.4.4.Market size and forecast, by revenue model
10.4.8.4.5.Market size and forecast, by user type
10.4.8.4.6.Market size and forecast, by end user
10.4.8.5.India
10.4.8.5.1.Market size and forecast, by component
10.4.8.5.2.Market size and forecast, by device type
10.4.8.5.3.Market size and forecast, by content type
10.4.8.5.4.Market size and forecast, by revenue model
10.4.8.5.5.Market size and forecast, by user type
10.4.8.5.6.Market size and forecast, by end user
10.4.8.6.South Korea
10.4.8.6.1.Market size and forecast, by component
10.4.8.6.2.Market size and forecast, by device type
10.4.8.6.3.Market size and forecast, by content type
10.4.8.6.4.Market size and forecast, by revenue model
10.4.8.6.5.Market size and forecast, by user type
10.4.8.6.6.Market size and forecast, by end user
10.4.8.7.Indonesia
10.4.8.7.1.Market size and forecast, by component
10.4.8.7.2.Market size and forecast, by device type
10.4.8.7.3.Market size and forecast, by content type
10.4.8.7.4.Market size and forecast, by revenue model
10.4.8.7.5.Market size and forecast, by user type
10.4.8.7.6.Market size and forecast, by end user
10.4.8.8.Rest of Asia-Pacific
10.4.8.8.1.Market size and forecast, by component
10.4.8.8.2.Market size and forecast, by device type
10.4.8.8.3.Market size and forecast, by content type
10.4.8.8.4.Market size and forecast, by revenue model
10.4.8.8.5.Market size and forecast, by user type
10.4.8.8.5.1.Market size and forecast, by end user
10.5.LAMEA
10.5.1.Key market trends, growth factors, and opportunities
10.5.2.Market size and forecast, by component
10.5.3.Market size and forecast, by device type
10.5.4.Market size and forecast, by content type
10.5.5.Market size and forecast, by revenue model
10.5.6.Market size and forecast, by user type
10.5.7.Market size and forecast, by end user
10.5.8.Market analysis by country
10.5.8.1.Brazil
10.5.8.1.1.Market size and forecast, by component
10.5.8.1.2.Market size and forecast, by device type
10.5.8.1.3.Market size and forecast, by content type
10.5.8.1.4.Market size and forecast, by revenue model
10.5.8.1.5.Market size and forecast, by user type
10.5.8.1.6.Market size and forecast, by end user
10.5.8.2.Mexico
10.5.8.2.1.Market size and forecast, by component
10.5.8.2.2.Market size and forecast, by device type
10.5.8.2.3.Market size and forecast, by content type
10.5.8.2.4.Market size and forecast, by revenue model
10.5.8.2.5.Market size and forecast, by user type
10.5.8.2.6.Market size and forecast, by end user
10.5.8.3.Argentina
10.5.8.3.1.Market size and forecast, by component
10.5.8.3.2.Market size and forecast, by device type
10.5.8.3.3.Market size and forecast, by content type
10.5.8.3.4.Market size and forecast, by revenue model
10.5.8.3.5.Market size and forecast, by user type
10.5.8.3.6.Market size and forecast, by end user
10.5.8.4.Turkey
10.5.8.4.1.Market size and forecast, by component
10.5.8.4.2.Market size and forecast, by device type
10.5.8.4.3.Market size and forecast, by content type
10.5.8.4.4.Market size and forecast, by revenue model
10.5.8.4.5.Market size and forecast, by user type
10.5.8.4.6.Market size and forecast, by end user
10.5.8.5.Saudi Arabia
10.5.8.5.1.Market size and forecast, by component
10.5.8.5.2.Market size and forecast, by device type
10.5.8.5.3.Market size and forecast, by content type
10.5.8.5.4.Market size and forecast, by revenue model
10.5.8.5.5.Market size and forecast, by user type
10.5.8.5.6.Market size and forecast, by end user
10.5.8.6.South Africa
10.5.8.6.1.Market size and forecast, by component
10.5.8.6.2.Market size and forecast, by device type
10.5.8.6.3.Market size and forecast, by content type
10.5.8.6.4.Market size and forecast, by revenue model
10.5.8.6.5.Market size and forecast, by user type
10.5.8.6.6.Market size and forecast, by end user
10.5.8.7.Rest of LAMEA
10.5.8.7.1.Market size and forecast, by component
10.5.8.7.2.Market size and forecast, by device type
10.5.8.7.3.Market size and forecast, by content type
10.5.8.7.4.Market size and forecast, by revenue model
10.5.8.7.5.Market size and forecast, by user type
10.5.8.7.6.Market size and forecast, by end user
CHAPTER 11:COMPETITIVE LANDSCAPE
11.1.KEY PLAYER POSITIONING ANALYSIS, 2019
11.2.TOP WINNING STRATEGIES
11.3.COMPETITIVE DASHBOARD
11.4.KEY DEVELOPMENTS
11.4.1.New product launches
11.4.2.Product development
11.4.3.Collaboration
11.4.4.Acquisition
11.4.5.Partnership
11.4.6.Business expansion
11.4.7.Agreement
CHAPTER 12:COMPANY PROFILES
12.1.AMAZON WEB SERVICES, INC.
12.1.1.Company overview
12.1.2.Key executive
12.1.3.Company snapshot
12.1.4.Operating business segments
12.1.5.Product portfolio
12.1.6.Business performance
12.1.7.Key Strategic Move(s)s and developments
12.2.APPLE INC.
12.2.1.Company overview
12.2.2.Key executive
12.2.3.Company snapshot
12.2.4.Operating business segments
12.2.5.Product portfolio
12.2.6.R&D expenditure
12.2.7.Business performance
12.2.8.Key Strategic Move(s)s and developments
12.3.FACEBOOK, INC.
12.3.1.Company overview
12.3.2.Key executive
12.3.3.Company snapshot
12.3.4.Product portfolio
12.3.5.R&D expenditure
12.3.6.Business performance
12.3.7.Key strategic moves and developments
12.4.GOOGLE, LLC.
12.4.1.Company overview
12.4.2.Key executive
12.4.3.Company snapshot
12.4.4.Operating business segments
12.4.5.Product portfolio
12.4.6.R&D expenditure
12.4.7.Business performance
12.4.8.Key strategic moves and developments
12.5.HULU, LLC
12.5.1.Company overview
12.5.2.Key executive
12.5.3.Company snapshot
12.5.4.Operating business segments
12.5.5.Product portfolio
12.5.6.Business performance
12.5.7.Key Strategic Move(s)s and developments
12.6.MICROSOFT CORPORATION
12.6.1.Company overview
12.6.2.Key executive
12.6.3.Company snapshot
12.6.4.Operating business segments
12.6.5.Product portfolio
12.6.6.R&D expenditure
12.6.7.Business performance
12.6.8.Key strategic moves and developments
12.7.NETFLIX, INC.
12.7.1.Company overview
12.7.2.Key executive
12.7.3.Company snapshot
12.7.4.Product portfolio
12.7.5.R&D expenditure
12.7.6.Business performance
12.7.7.Key Strategic Move(s)s and developments
12.8.RAKUTEN, INC.
12.8.1.Company overview
12.8.2.Key executive
12.8.3.Company snapshot
12.8.4.Operating business segments
12.8.5.Product portfolio
12.8.6.Business performance
12.8.7.Key Strategic Move(s)s and developments
12.9.TELSTRA CORPORATION LIMITED
12.9.1.Company overview
12.9.2.Key executive
12.9.3.Company snapshot
12.9.4.Operating business segments
12.9.5.Product portfolio
12.9.6.Business performance
12.9.7.Key Strategic Move(s)s and developments
12.10.TENCENT HOLDINGS LTD.
12.10.1.Company overview
12.10.2.Key executive
12.10.3.Company snapshot
12.10.4.Operating business segments
12.10.5.Product portfolio
12.10.6.R&D expenditure
12.10.7.Business performance
12.10.8.Key strategic moves and developments
Table 01.Global Over-the-top Market, By Component, 2019-2027($Billion)
Table 02.Over-the-top Solution Market Revenue, By Region, 2019-2027 ($Billion)
Table 03.Over-the-top Services Market Revenue , By Region, 2019-2027 ($Billion)
Table 04.Global Over-the-top Market Revenue, By Device Type, 2019-2027($Billion)
Table 05.Over-the-top Market Revenue For Smartphones, By Region, 2019-2027 ($Billion)
Table 06.Over-the-top Market Revenue For Smart Tv, By Region, 2019-2027 ($Billion)
Table 07.Over-the-top Market Revenue For Laptops, Desktops, & Tablets, By Region, 2019-2027 ($Billion)
Table 08.Over-the-top Market Revenue For Gaming Consoles, By Region, 2019-2027 ($Billion)
Table 09.Over-the-top Market Revenue For Set-top Box, By Region, 2019-2027 ($Billion)
Table 10.Over-the-top Market Revenue For Others, By Region, 2019-2027 ($Billion)
Table 11.Global Over-the-top Market Revenue, By Content Type, 2019-2027($Billion)
Table 12.Over-the-top Market Revenue For Video, By Region, 2019-2027 ($Billion)
Table 13.Over-the-top Market Revenue For Audio, By Region, 2019-2027 ($Billion)
Table 14.Over-the-top Market Revenue For Games, By Region, 2019-2027 ($Billion)
Table 15.Over-the-top Market Revenue For Communication, By Region, 2019-2027 ($Billion)
Table 16.Over-the-top Market Revenue For Others, By Region, 2019-2027 ($Billion)
Table 17.Global Over-the-top Market Revenue, By Revenue Model, 2019-2027($Billion)
Table 18.Over-the-top Market Revenue For Subscription, By Region, 2019-2027 ($Billion)
Table 19.Over-the-top Market Revenue For Advertisement, By Region, 2019-2027 ($Billion)
Table 20.Over-the-top Market Revenue For Hybrid, By Region, 2019-2027 ($Billion)
Table 21.Over-the-top Market Revenue For Others, By Region, 2019-2027 ($Billion)
Table 22.Global Over-the-top Market Revenue, By User Type, 2019-2027($Billion)
Table 23.Over-the-top Market Revenue For Personal User, By Region, 2019-2027 ($Billion)
Table 24.Over-the-top Market Revenue For Commercial User, By Region, 2019-2027 ($Billion)
Table 25.Global Over-the-top Market Revenue, By End User, 2019-2027($Billion)
Table 26.Over-the-top Market Revenue For Media & Entertainment, By Region, 2019-2027 ($Billion)
Table 27.Over-the-top Market Revenue For Education & Training, By Region, 2019-2027 ($Billion)
Table 28.Over-the-top Market Revenue For Health & Fitness, By Region, 2019-2027 ($Billion)
Table 29.Over-the-top Market Revenue For It & Telecom, By Region, 2019-2027 ($Billion)
Table 30.Over-the-top Market Revenue For E-commerce, By Region, 2019-2027 ($Billion)
Table 31.Over-the-top Market Revenue For Bfsi, By Region, 2019-2027 ($Billion)
Table 32.Over-the-top Market Revenue For Government, By Region, 2019-2027 ($Billion)
Table 33.Over-the-top Market Revenue For Others, By Region, 2019-2027 ($Billion)
Table 34.Over-the-top Market, By Region, 2019–2027 ($Billion)
Table 35.North America Over-the-top Market Revenue, By Component, 2019-2027 ($Billion)
Table 36.North America Over-the-top Market Revenue, By Device Type, 2019-2027 ($Billion)
Table 37.North America Ott Market Revenue For Smart Tv, By Operating System, 2019-2027 ($Million)
Table 38.North America Ott Market Revenue For Smart Tv, By Device Type, 2019-2027 ($Million)
Table 39.North America Over-the-top Market Value, By Content Type, 2019-2027 ($Billion)
Table 40.North America Over-the-top Market Value, By Revenue Model, 2019-2027 ($Billion)
Table 41.North America Over-the-top Market Value, By User Type, 2019-2027 ($Billion)
Table 42.North America Over-the-top Market Revenue, By End User, 2019-2027 ($Billion)
Table 43.North America Over-the-top Market Value, By Country, 2019-2027 ($Billion)
Table 44.U.S. Over-the-top Market Revenue, By Component, 2019-2027 ($Billion)
Table 45.U.S. Over-the-top Market Revenue, By Device Type, 2019-2027 ($Billion)
Table 46.U.S. Ott Market Revenue For Smart Tv, By Operating System, 2019-2027 ($Million)
Table 47.U.S. Ott Market Revenue For Smart Tv, By Device Type, 2019-2027 ($Million)
Table 48.U.S. Over-the-top Market Revenue, By Content Type, 2019-2027 ($Billion)
Table 49.U.S. Over-the-top Market Revenue, By Revenue Model, 2019-2027 ($Billion)
Table 50.U.S. Over-the-top Market Revenue, By User Type, 2019-2027 ($Billion)
Table 51.U.S. Over-the-top Market Revenue, By End User, 2019-2027 ($Billion)
Table 52.Canada Over-the-top Market Revenue, By Component, 2019-2027 ($Billion)
Table 53.Canada Over-the-top Market Revenue, By Device Type, 2019-2027 ($Billion)
Table 54.Canada Ott Market Revenue For Smart Tv, By Operating System, 2019-2027 ($Million)
Table 55.Canada Ott Market Revenue For Smart Tv, By Device Type, 2019-2027 ($Million)
Table 56.Canada Over-the-top Market Revenue, By Content Type, 2019-2027 ($Billion)
Table 57.Canada Over-the-top Market Revenue, By Revenue Model, 2019-2027 ($Billion)
Table 58.Canada Over-the-top Market Revenue, By User Type, 2019-2027 ($Billion)
Table 59.Canada Over-the-top Market Revenue, By End User, 2019-2027 ($Billion)
Table 60.Europe Over-the-top Market Revenue, By Component, 2019-2027 ($Billion)
Table 61.Europe Over-the-top Market Revenue, By Device Type, 2019-2027 ($Billion)
Table 62.Europe Ott Market Revenue For Smart Tv, By Operating System, 2019-2027 ($Million)
Table 63.Europe Ott Market Revenue For Smart Tv, By Device Type, 2019-2027 ($Million)
Table 64.Europe Over-the-top Market Value, By Content Type, 2019-2027 ($Billion)
Table 65.Europe Over-the-top Market Value, By Revenue Model, 2019-2027 ($Billion)
Table 66.Europe Over-the-top Market Value, By User Type, 2019-2027 ($Billion)
Table 67.Europe Over-the-top Market Revenue, By End User, 2019-2027 ($Billion)
Table 68.Europe Over-the-top Market Value, By Country, 2019-2027 ($Billion)
Table 69.Germany Over-the-top Market Revenue, By Component, 2019-2027 ($Billion)
Table 70.Germany Over-the-top Market Revenue, By Device Type, 2019-2027 ($Billion)
Table 71.Ott Market Revenue For Smart Tv, By Operating System, 2019-2027 ($Million)
Table 72.Germany Ott Market Revenue For Smart Tv, By Device Type, 2019-2027 ($Million)
Table 73.Germany Over-the-top Market Revenue, By Content Type, 2019-2027 ($Billion)
Table 74.Germany Over-the-top Market Revenue, By Revenue Model, 2019-2027 ($Billion)
Table 75.Germany Over-the-top Market Revenue, By User Type, 2019-2027 ($Billion)
Table 76.Germany Over-the-top Market Revenue, By End User, 2019-2027 ($Billion)
Table 77.France Over-the-top Market Revenue, By Component, 2019-2027 ($Billion)
Table 78.France Over-the-top Market Revenue, By Device Type, 2019-2027 ($Billion)
Table 79.France Ott Market Revenue For Smart Tv, By Operating System, 2019-2027 ($Million)
Table 80.France Ott Market Revenue For Smart Tv, By Device Type, 2019-2027 ($Million)
Table 81.France Over-the-top Market Revenue, By Content Type, 2019-2027 ($Billion)
Table 82.France Over-the-top Market Revenue, By Revenue Model, 2019-2027 ($Billion)
Table 83.France Over-the-top Market Revenue, By User Type, 2019-2027 ($Billion)
Table 84.France Over-the-top Market Revenue, By End User, 2019-2027 ($Billion)
Table 85.Uk Over-the-top Market Revenue, By Component, 2019-2027 ($Billion)
Table 86.Uk Over-the-top Market Revenue, By Device Type, 2019-2027 ($Billion)
Table 87.Uk Ott Market Revenue For Smart Tv, By Operating System, 2019-2027 ($Million)
Table 88.Uk Ott Market Revenue For Smart Tv, By Device Type, 2019-2027 ($Million)
Table 89.Uk Over-the-top Market Revenue, By Content Type, 2019-2027 ($Billion)
Table 90.Uk Over-the-top Market Revenue, By Revenue Model, 2019-2027 ($Billion)
Table 91.Uk Over-the-top Market Revenue, By User Type, 2019-2027 ($Billion)
Table 92.Uk Over-the-top Market Revenue, By End User, 2019-2027 ($Billion)
Table 93.Italy Over-the-top Market Revenue, By Component, 2019-2027 ($Billion)
Table 94.Italy Over-the-top Market Revenue, By Device Type, 2019-2027 ($Billion)
Table 95.Italy Ott Market Revenue For Smart Tv, By Operating System, 2019-2027 ($Million)
Table 96.Italy Ott Market Revenue For Smart Tv, By Device Type, 2019-2027 ($Million)
Table 97.Italy Over-the-top Market Revenue, By Content Type, 2019-2027 ($Billion)
Table 98.Italy Over-the-top Market Revenue, By Revenue Model, 2019-2027 ($Billion)
Table 99.Italy Over-the-top Market Revenue, By User Type, 2019-2027 ($Billion)
Table 100.Italy Over-the-top Market Revenue, By End User, 2019-2027 ($Billion)
Table 101.Spain Over-the-top Market Revenue, By Component, 2019-2027 ($Billion)
Table 102.Spain Over-the-top Market Revenue, By Device Type, 2019-2027 ($Billion)
Table 103.Spain Ott Market Revenue For Smart Tv, By Operating System, 2019-2027 ($Million)
Table 104.Spain Ott Market Revenue For Smart Tv, By Device Type, 2019-2027 ($Million)
Table 105.Spain Over-the-top Market Revenue, By Content Type, 2019-2027 ($Billion)
Table 106.Spain Over-the-top Market Revenue, By Revenue Model, 2019-2027 ($Billion)
Table 107.Spain Over-the-top Market Revenue, By User Type, 2019-2027 ($Billion)
Table 108.Spain Over-the-top Market Revenue, By End User, 2019-2027 ($Billion)
Table 109.Catalonia Over-the-top Market Revenue, By Component, 2019-2027 ($Billion)
Table 110.Catalonia Over-the-top Market Revenue, By Device Type, 2019-2027 ($Billion)
Table 111.Catalonia Ott Market Revenue For Smart Tv, By Operating System, 2019-2027 ($Million)
Table 112.Catalonia Ott Market Revenue For Smart Tv, By Device Type, 2019-2027 ($Million)
Table 113.Catalonia Over-the-top Market Revenue, By Content Type, 2019-2027 ($Billion)
Table 114.Catalonia Over-the-top Market Revenue, By Revenue Model, 2019-2027 ($Billion)
Table 115.Catalonia Over-the-top Market Revenue, By User Type, 2019-2027 ($Billion)
Table 116.Catalonia Over-the-top Market Revenue, By End User, 2019-2027 ($Billion)
Table 117.Rest Of Europe Over-the-top Market Revenue, By Component, 2019-2027 ($Billion)
Table 118.Rest Of Europe Over-the-top Market Revenue, By Device Type, 2019-2027 ($Billion)
Table 119.Rest Of Europe Ott Market Revenue For Smart Tv, By Operating System, 2019-2027 ($Million)
Table 120.Rest Of Europe Ott Market Revenue For Smart Tv, By Device Type, 2019-2027 ($Million)
Table 121.Rest Of Europe Over-the-top Market Revenue, By Content Type, 2019-2027 ($Billion)
Table 122.Rest Of Europe Over-the-top Market Revenue, By Revenue Model, 2019-2027 ($Billion)
Table 123.Rest Of Europe Over-the-top Market Revenue, By User Type, 2019-2027 ($Billion)
Table 124.Rest Of Europe Over-the-top Market Revenue, By End User, 2019-2027 ($Billion)
Table 125.Asia-pacific Over-the-top Market Revenue, By Component, 2019-2027 ($Billion)
Table 126.Asia-pacific Over-the-top Market Revenue, By Device Type, 2019-2027 ($Billion)
Table 127.Asia-pacific Ott Market Revenue For Smart Tv, By Operating System, 2019-2027 ($Million)
Table 128.Asia-pacific Ott Market Revenue For Smart Tv, By Device Type, 2019-2027 ($Million)
Table 129.Asia-pacific Over-the-top Market Value, By Content Type, 2019-2027 ($Billion)
Table 130.Asia-pacific Over-the-top Market Value, By Revenue Model, 2019-2027 ($Billion)
Table 131.Asia-pacific Over-the-top Market Value, By User Type, 2019-2027 ($Billion)
Table 132.Asia-pacific Over-the-top Market Revenue, By End User, 2019-2027 ($Billion)
Table 133.Asia-pacific Over-the-top Market Value, By Country, 2019-2027 ($Billion)
Table 134.Japan Over-the-top Market Revenue, By Component, 2019-2027 ($Billion)
Table 135.Japan Over-the-top Market Revenue, By Device Type, 2019-2027 ($Billion)
Table 136.Japan Ott Market Revenue For Smart Tv, By Operating System, 2019-2027 ($Million)
Table 137.Japan Ott Market Revenue For Smart Tv, By Device Type, 2019-2027 ($Million)
Table 138.Japan Over-the-top Market Revenue, By Content Type, 2019-2027 ($Billion)
Table 139.Japan Over-the-top Market Revenue, By Revenue Model, 2019-2027 ($Billion)
Table 140.Japan Over-the-top Market Revenue, By User Type, 2019-2027 ($Billion)
Table 141.Japan Over-the-top Market Revenue, By End User, 2019-2027 ($Billion)
Table 142.China Over-the-top Market Revenue, By Component, 2019-2027 ($Billion)
Table 143.China Over-the-top Market Revenue, By Device Type, 2019-2027 ($Billion)
Table 144.China Ott Market Revenue For Smart Tv, By Operating System, 2019-2027 ($Million)
Table 145.China Ott Market Revenue For Smart Tv, By Device Type, 2019-2027 ($Million)
Table 146.China Over-the-top Market Revenue, By Content Type, 2019-2027 ($Billion)
Table 147.China Over-the-top Market Revenue, By Revenue Model, 2019-2027 ($Billion)
Table 148.China Over-the-top Market Revenue, By User Type, 2019-2027 ($Billion)
Table 149.China Over-the-top Market Revenue, By End User, 2019-2027 ($Billion)
Table 150.Australia Over-the-top Market Revenue, By Component, 2019-2027 ($Billion)
Table 151.Australia Over-the-top Market Revenue, By Device Type, 2019-2027 ($Billion)
Table 152.Australia Ott Market Revenue For Smart Tv, By Operating System, 2019-2027 ($Million)
Table 153.Australia Ott Market Revenue For Smart Tv, By Device Type, 2019-2027 ($Million)
Table 154.Australia Over-the-top Market Revenue, By Content Type, 2019-2027 ($Billion)
Table 155.Australia Over-the-top Market Revenue, By Revenue Model, 2019-2027 ($Billion)
Table 156.Australia Over-the-top Market Revenue, By User Type, 2019-2027 ($Billion)
Table 157.Australia Over-the-top Market Revenue, By End User, 2019-2027 ($Billion)
Table 158.India Over-the-top Market Revenue, By Component, 2019-2027 ($Billion)
Table 159.India Over-the-top Market Revenue, By Device Type, 2019-2027 ($Billion)
Table 160.India Ott Market Revenue For Smart Tv, By Operating System, 2019-2027 ($Million)
Table 161.India Ott Market Revenue For Smart Tv, By Device Type, 2019-2027 ($Million)
Table 162.India Over-the-top Market Revenue, By Content Type, 2019-2027 ($Billion)
Table 163.India Over-the-top Market Revenue, By Revenue Model, 2019-2027 ($Billion)
Table 164.India Over-the-top Market Revenue, By User Type, 2019-2027 ($Billion)
Table 165.India Over-the-top Market Revenue, By End User, 2019-2027 ($Billion)
Table 166.South Korea Over-the-top Market Revenue, By Component, 2019-2027 ($Billion)
Table 167.South Korea Over-the-top Market Revenue, By Device Type, 2019-2027 ($Billion)
Table 168.South Korea Ott Market Revenue For Smart Tv, By Operating System, 2019-2027 ($Million)
Table 169.South Korea Ott Market Revenue For Smart Tv, By Device Type, 2019-2027 ($Million)
Table 170.South Korea Over-the-top Market Revenue, By Content Type, 2019-2027 ($Billion)
Table 171.South Korea Over-the-top Market Revenue, By Revenue Model, 2019-2027 ($Billion)
Table 172.South Korea Over-the-top Market Revenue, By User Type, 2019-2027 ($Billion)
Table 173.South Korea Over-the-top Market Revenue, By End User, 2019-2027 ($Billion)
Table 174.Indonesia Over-the-top Market Revenue, By Component, 2019-2027 ($Billion)
Table 175.Indonesia Over-the-top Market Revenue, By Device Type, 2019-2027 ($Billion)
Table 176.Indonesia Ott Market Revenue For Smart Tv, By Operating System, 2019-2027 ($Million)
Table 177.Indonesia Ott Market Revenue For Smart Tv, By Device Type, 2019-2027 ($Million)
Table 178.Indonesia Over-the-top Market Revenue, By Content Type, 2019-2027 ($Billion)
Table 179.Indonesia Over-the-top Market Revenue, By Revenue Model, 2019-2027 ($Billion)
Table 180.Indonesia Over-the-top Market Revenue, By User Type, 2019-2027 ($Billion)
Table 181.Indonesia Over-the-top Market Revenue, By End User, 2019-2027 ($Billion)
Table 182.Rest Of Asia-pacific Over-the-top Market Revenue, By Component, 2019-2027 ($Billion)
Table 183.Rest Of Asia-pacific Over-the-top Market Revenue, By Device Type, 2019-2027 ($Billion)
Table 184.Rest Of Asia-pacific Ott Market Revenue For Smart Tv, By Operating System, 2019-2027 ($Million)
Table 185.Rest Of Asia-pacific Ott Market Revenue For Smart Tv, By Device Type, 2019-2027 ($Million)
Table 186.Rest Of Asia-pacific Over-the-top Market Revenue, By Content Type, 2019-2027 ($Billion)
Table 187.Rest Of Asia-pacific Over-the-top Market Revenue, By Revenue Model, 2019-2027 ($Billion)
Table 188.Rest Of Asia-pacific Over-the-top Market Revenue, By User Type, 2019-2027 ($Billion)
Table 189.Rest Of Asia-pacific Over-the-top Market Revenue, By End User, 2019-2027 ($Billion)
Table 190.Lamea Over-the-top Market Revenue, By Component, 2019-2027 ($Billion)
Table 191.Lamea Over-the-top Market Revenue, By Device Type, 2019-2027 ($Billion)
Table 192.Lamea Ott Market Revenue For Smart Tv, By Operating System, 2019-2027 ($Million)
Table 193.Lamea Ott Market Revenue For Smart Tv, By Device Type, 2019-2027 ($Million)
Table 194.Lamea Over-the-top Market Value, By Content Type, 2019-2027 ($Billion)
Table 195.Lamea Over-the-top Market Value, By Revenue Model, 2019-2027 ($Billion)
Table 196.Lamea Over-the-top Market Value, By User Type, 2019-2027 ($Billion)
Table 197.Lamea Over-the-top Market Revenue, By End User, 2019-2027 ($Billion)
Table 198.Lamea Over-the-top Market Value, By Country, 2019-2027 ($Billion)
Table 199.Brazil Over-the-top Market Revenue, By Component, 2019-2027 ($Billion)
Table 200.Brazil Over-the-top Market Revenue, By Device Type, 2019-2027 ($Billion)
Table 201.Brazil Ott Market Revenue For Smart Tv, By Operating System, 2019-2027 ($Million)
Table 202.Brazil Ott Market Revenue For Smart Tv, By Device Type, 2019-2027 ($Million)
Table 203.Brazil Over-the-top Market Revenue, By Content Type, 2019-2027 ($Billion)
Table 204.Brazil Over-the-top Market Revenue, By Revenue Model, 2019-2027 ($Billion)
Table 205.Brazil Over-the-top Market Revenue, By User Type, 2019-2027 ($Billion)
Table 206.Brazil Over-the-top Market Revenue, By End User, 2019-2027 ($Billion)
Table 207.Mexico Over-the-top Market Revenue, By Component, 2019-2027 ($Billion)
Table 208.Mexico Over-the-top Market Revenue, By Device Type, 2019-2027 ($Billion)
Table 209.Mexico Ott Market Revenue For Smart Tv, By Operating System, 2019-2027 ($Million)
Table 210.Mexico Ott Market Revenue For Smart Tv, By Device Type, 2019-2027 ($Million)
Table 211.Mexico Over-the-top Market Revenue, By Content Type, 2019-2027 ($Billion)
Table 212.Mexico Over-the-top Market Revenue, By Revenue Model, 2019-2027 ($Billion)
Table 213.Mexico Over-the-top Market Revenue, By User Type, 2019-2027 ($Billion)
Table 214.Mexico Over-the-top Market Revenue, By End User, 2019-2027 ($Billion)
Table 215.Argentina Over-the-top Market Revenue, By Component, 2019-2027 ($Billion)
Table 216.Argentina Over-the-top Market Revenue, By Device Type, 2019-2027 ($Billion)
Table 217.Argentina Ott Market Revenue For Smart Tv, By Operating System, 2019-2027 ($Million)
Table 218.Argentina Ott Market Revenue For Smart Tv, By Device Type, 2019-2027 ($Million)
Table 219.Argentina Over-the-top Market Revenue, By Content Type, 2019-2027 ($Billion)
Table 220.Argentina Over-the-top Market Revenue, By Revenue Model, 2019-2027 ($Billion)
Table 221.Argentina Over-the-top Market Revenue, By User Type, 2019-2027 ($Billion)
Table 222.Argentina Over-the-top Market Revenue, By End User, 2019-2027 ($Billion)
Table 223.Turkey Over-the-top Market Revenue, By Component, 2019-2027 ($Billion)
Table 224.Turkey Over-the-top Market Revenue, By Device Type, 2019-2027 ($Billion)
Table 225.Turkey Ott Market Revenue For Smart Tv, By Operating System, 2019-2027 ($Million)
Table 226.Turkey Ott Market Revenue For Smart Tv, By Device Type, 2019-2027 ($Million)
Table 227.Turkey Over-the-top Market Revenue, By Content Type, 2019-2027 ($Billion)
Table 228.Turkey Over-the-top Market Revenue, By Revenue Model, 2019-2027 ($Billion)
Table 229.Turkey Over-the-top Market Revenue, By User Type, 2019-2027 ($Billion)
Table 230.Turkey Over-the-top Market Revenue, By End User, 2019-2027 ($Billion)
Table 231.Saudi Arabia Over-the-top Market Revenue, By Component, 2019-2027 ($Billion)
Table 232.Saudi Arabia Over-the-top Market Revenue, By Device Type, 2019-2027 ($Billion)
Table 233.Saudi Arabia Ott Market Revenue For Smart Tv, By Operating System, 2019-2027 ($Million)
Table 234.Saudi Arabia Ott Market Revenue For Smart Tv, By Device Type, 2019-2027 ($Million)
Table 235.Saudi Arabia Over-the-top Market Revenue, By Content Type, 2019-2027 ($Billion)
Table 236.Saudi Arabia Over-the-top Market Revenue, By Revenue Model, 2019-2027 ($Billion)
Table 237.Saudi Arabia Over-the-top Market Revenue, By User Type, 2019-2027 ($Billion)
Table 238.Saudi Arabia Over-the-top Market Revenue, By End User, 2019-2027 ($Billion)
Table 239.South Africa Over-the-top Market Revenue, By Component, 2019-2027 ($Billion)
Table 240.South Africa Over-the-top Market Revenue, By Device Type, 2019-2027 ($Billion)
Table 241.South Africa Ott Market Revenue For Smart Tv, By Operating System, 2019-2027 ($Million)
Table 242.South Africa Ott Market Revenue For Smart Tv, By Device Type, 2019-2027 ($Million)
Table 243.South Africa Over-the-top Market Revenue, By Content Type, 2019-2027 ($Billion)
Table 244.South Africa Over-the-top Market Revenue, By Revenue Model, 2019-2027 ($Billion)
Table 245.South Africa Over-the-top Market Revenue, By User Type, 2019-2027 ($Billion)
Table 246.South Africa Over-the-top Market Revenue, By End User, 2019-2027 ($Billion)
Table 247.Rest Of Lamea Over-the-top Market Revenue, By Component, 2019-2027 ($Billion)
Table 248.Rest Of Lamea Over-the-top Market Revenue, By Device Type, 2019-2027 ($Billion)
Table 249.Rest Of Lamea Ott Market Revenue For Smart Tv, By Operating System, 2019-2027 ($Million)
Table 250.Rest Of Lamea Ott Market Revenue For Smart Tv, By Device Type, 2019-2027 ($Million)
Table 251.Rest Of Lamea Over-the-top Market Revenue, By Content Type, 2019-2027 ($Billion)
Table 252.Rest Of Lamea Over-the-top Market Revenue, By Revenue Model, 2019-2027 ($Billion)
Table 253.Rest Of Lamea Over-the-top Market Revenue, By User Type, 2019-2027 ($Billion)
Table 254.Rest Of Lamea Over-the-top Market Revenue, By End User, 2019-2027 ($Billion)
Table 255.Key New Product Launches (2017-2020)
Table 256.Product Development (2017-2020)
Table 257.Collaboration (2017-2020)
Table 258.Acquistion (2017-2020)
Table 259.Partnership (2017-2020)
Table 260.Business Expansion (2017-2020)
Table 261.Agreement (2017-2020)
Table 262.Amazon.Com Inc.: Key Executive
Table 263.Amazon Web Services, Inc.: Company Snapshot
Table 264.Amazon.Com Inc.: Operating Segments
Table 265.Amazon Web Services, Inc.: Product Portfolio
Table 266.Apple Inc.: Key Executive
Table 267.Apple Inc.: Company Snapshot
Table 268.Apple Inc.: Product Categories
Table 269.Apple Inc.: Product Portfolio
Table 270.Key Executive
Table 271.Facebook, Inc.: Company Snapshot
Table 272.Facebook, Inc.: Product Portfolio
Table 273.Google Llc: Key Executive
Table 274.Google Llc: Company Snapshot
Table 275.Alphabet Inc.: Operating Segments
Table 276.Alphabet Inc.: Product Portfolio
Table 277.Hulu, Llc: Key Executive
Table 278.Hulu, Llc: Company Snapshot
Table 279.The Walt Disney Company: Operating Segments
Table 280.Hulu, Llc: Product Portfolio
Table 281.Microsoft Corporation : Key Executive
Table 282.Microsoft Corporation : Company Snapshot
Table 283.Microsoft Corporation : Operating Segments
Table 284.Microsoft Corporation : Product Portfolio
Table 285.Key Executive
Table 286.Netflix, Inc.: Company Snapshot
Table 287.Netflix, Inc.: Product Portfolio
Table 288.Key Executive
Table 289.Rakuten, Inc.: Company Snapshot
Table 290.Rakuten, Inc.: Operating Segments
Table 291.Rakuten, Inc.: Product Portfolio
Table 292.Key Executive
Table 293.Telstra Corporation Limited: Company Snapshot
Table 294.Telstra Corporation Limited: Operating Segments
Table 295.Telstra Corporation Limited: Product Portfolio
Table 296.Tencent Holdings Ltd.: Key Executive
Table 297.Tencent Holdings Ltd.: Company Snapshot
Table 298.Tencent Holdings Ltd.: Operating Segments
Table 299.Tencent Holdings Ltd.: Product Portfolio
List Of Figures
Figure 01.Key Market Segments
Figure 02.Global Over-the-top Market Snapshot, By Segmentation, 2019–2027
Figure 03.Global Over-the-top Market Snapshot, By Segmentation, 2019–2027
Figure 04.Over-the-top Market Snapshot, By Country, 2019–2027
Figure 05.Top Impacting Factors
Figure 06.Top Investment Pockets
Figure 07.Moderate-to-high Bargaining Power Of Suppliers
Figure 08.High Bargaining Power Of Buyers
Figure 09.Moderate Threat Of Substitutes
Figure 10.High Threat Of New Entrants
Figure 11.High Competitive Rivalry
Figure 12.Value Chain Analysis
Figure 13.Market Evolution/Industry Roadmap
Figure 14.Market Dynamics: Global Over-the-top Market
Figure 15.Global Over-the-top Market Revenue, By Component, 2019–2027($Billion)
Figure 16.Comparative Share Analysis Of Over-the-top Solution Market, By Country, 2019 & 2027(%)
Figure 17.Comparative Share Analysis Of Over-the-top Services Market, By Country, 2019 & 2027 (%)
Figure 18.Global Over-the-top Market, By Device Type, 2019-2027($Billion)
Figure 19.Comparative Share Analysis Of Over-the-top Market For Smartphones, By Country, 2019 & 2027(%)
Figure 20.Comparative Share Analysis Of Over-the-top Market For Smart Tv, By Country, 2019 & 2027(%)
Figure 21.Comparative Share Analysis Of Over-the-top Market For Laptops, Desktops, & Tablets, By Country, 2019 & 2027(%)
Figure 22.Comparative Share Analysis Of Over-the-top Market For Gaming Consoles, By Country, 2019 & 2027(%)
Figure 23.Comparative Share Analysis Of Over-the-top Market For Set-top Box, By Country, 2019 & 2027(%)
Figure 24.Comparative Share Analysis Of Over-the-top Market For Others, By Country, 2019 & 2027(%)
Figure 25.Global Over-the-top Market, By Content Type, 2019-2027
Figure 26.Comparative Share Analysis Of Over-the-top Market For Video, By Country, 2019 & 2027(%)
Figure 27.Comparative Share Analysis Of Over-the-top Market For Audio, By Country, 2019 & 2027(%)
Figure 28.Comparative Share Analysis Of Over-the-top Market For Games, By Country, 2019 & 2027(%)
Figure 29.Comparative Share Analysis Of Over-the-top Market For Communication, By Country, 2019 & 2027(%)
Figure 30.Comparative Share Analysis Of Over-the-top Market For Others, By Country, 2019 & 2027(%)
Figure 31.Global Over-the-top Market, By Revenue Model, 2019-2027
Figure 32.Comparative Share Analysis Of Over-the-top Market For Subscription, By Country, 2019 & 2027(%)
Figure 33.Comparative Share Analysis Of Over-the-top Market For Advertisement, By Country, 2019 & 2027(%)
Figure 34.Comparative Share Analysis Of Over-the-top Market For Hybrid, By Country, 2019 & 2027(%)
Figure 35.Comparative Share Analysis Of Over-the-top Market For Others, By Country, 2019 & 2027(%)
Figure 36.Global Over-the-top Market, By User Type, 2019-2027
Figure 37.Comparative Share Analysis Of Over-the-top Market For Personal User, By Country, 2019 & 2027(%)
Figure 38.Comparative Share Analysis Of Over-the-top Market For Commercial User, By Country, 2019 & 2027(%)
Figure 39.Global Over-the-top Market, By End User, 2019-2027
Figure 40.Comparative Share Analysis Of Over-the-top Market For Media & Entertainment, By Country, 2019 & 2027(%)
Figure 41.Comparative Share Analysis Of Over-the-top Market For Education & Training, By Country, 2019 & 2027(%)
Figure 42.Comparative Share Analysis Of Over-the-top Market For Health & Fitness, By Country, 2019 & 2027(%)
Figure 43.Comparative Share Analysis Of Over-the-top Market For It & Telecom, By Country, 2019 & 2027(%)
Figure 44.Comparative Share Analysis Of Over-the-top Market For E-commerce, By Country, 2019 & 2027(%)
Figure 45.Comparative Share Analysis Of Over-the-top Market For Bfsi, By Country, 2019 & 2027(%)
Figure 46.Comparative Share Analysis Of Over-the-top Market For Government, By Country, 2019 & 2027(%)
Figure 47.Comparative Share Analysis Of Over-the-top Market For Others, By Country, 2019 & 2027(%)
Figure 48.U.S. Over-the-top Market Revenue, 2019-2027($Billion)
Figure 49.Canada Over-the-top Market Revenue, 2019-2027($Billion)
Figure 50.Germany Over-the-top Market Revenue, 2019-2027($Billion)
Figure 51.France Over-the-top Market Revenue, 2019-2027($Billion)
Figure 52.Uk Over-the-top Market Revenue, 2019-2027($Billion)
Figure 53.Italy Over-the-top Market Revenue, 2019-2027($Billion)
Figure 54.Spain Over-the-top Market Revenue, 2019-2027($Billion)
Figure 55.Catalonia Over-the-top Market Revenue, 2019-2027($Billion)
Figure 56.Rest Of Europe Over-the-top Market Revenue, 2019-2027($Billion)
Figure 57.Japan Over-the-top Market Revenue, 2019-2027($Billion)
Figure 58.China Over-the-top Market Revenue, 2019-2027($Billion)
Figure 59.Australia Over-the-top Market Revenue, 2019-2027($Billion)
Figure 60.India Over-the-top Market Revenue, 2019-2027($Billion)
Figure 61.South Korea Over-the-top Market Revenue, 2019-2027($Billion)
Figure 62.Indonesia Over-the-top Market Revenue, 2019-2027($Billion)
Figure 63.Rest Of Asia-pacific Over-the-top Market Revenue, 2019-2027($Billion)
Figure 64.Brazil Over-the-top Market Revenue, 2019-2027($Billion)
Figure 65.Mexico Over-the-top Market Revenue, 2019-2027($Billion)
Figure 66.Argentina Over-the-top Market Revenue, 2019-2027($Billion)
Figure 67.Turkey Over-the-top Market Revenue, 2019-2027($Billion)
Figure 68.Saudi Arabia Over-the-top Market Revenue, 2019-2027($Billion)
Figure 69.South Africa Over-the-top Market Revenue, 2019-2027($Billion)
Figure 70.Rest Of Lamea Over-the-top Market Revenue, 2019-2027($Billion)
Figure 71.Key Player Positioning Anlysis: Global Ove-the-top Market
Figure 72.Top Winning Strategies, By Year, 2017-2020
Figure 73.Top Winning Strategies, By Development, 2017-2020
Figure 74.Top Winning Strategies, By Company, 2017-2020
Figure 75.Competitive Dashboard
Figure 76.Competitive Dashboard
Figure 77.Competitive Heatmap Of Key Players
Figure 78.Amazon.Com, Inc.: Revenue, 2017–2019 ($Million)
Figure 79.Amazon.Com, Inc.: Revenue Share By Segment, 2019 (%)
Figure 80.Amazon.Com, Inc.: Revenue Share By Region, 2019 (%)
Figure 81.R&D Expenditure, 2017–2019 ($Million)
Figure 82.Apple Inc.: Revenue, 2017–2019 ($Million)
Figure 83.Apple Inc.: Revenue Share By Segment, 2019 (%)
Figure 84.Apple Inc.: Revenue Share By Region, 2019 (%)
Figure 85.R&D Expenditure, 2017–2019 ($Million)
Figure 86.Facebook, Inc.: Revenue, 2017–2019 ($Million)
Figure 87.Facebook, Inc.: Revenue Share By Region, 2019
Figure 88.R&D Expenditure, 2017–2019 ($Million)
Figure 89.Alphabet Inc.: Revenue, 2017–2019 ($Million)
Figure 90.Alphabet Inc.: Revenue Share By Segment, 2019 (%)
Figure 91.Alphabet Inc.: Revenue Share By Region, 2019 (%)
Figure 92.The Walt Disney Company: Revenue, 2017–2019 ($Million)
Figure 93.The Walt Disney Company: Revenue Share By Segment, 2019 (%)
Figure 94.The Walt Disney Company: Revenue Share By Region, 2019 (%)
Figure 95.R&D Expenditure, 2017–2019 ($Million)
Figure 96.Microsoft Corporation : Revenue, 2017–2019 ($Million)
Figure 97.Microsoft Corporation: Revenue Share By Segment, 2019 (%)
Figure 98.Microsoft Corporation: Revenue Share By Region, 2019 (%)
Figure 99.R&D Expenditure, 2017–2019 ($Million)
Figure 100.Netflix, Inc.: Revenue, 2017–2019 ($Million)
Figure 101.Netflix, Inc.: Revenue Share By Region, 2019 (%)
Figure 102.Rakuten, Inc.: Revenue, 2017–2019 ($Million)
Figure 103.Rakuten, Inc.: Revenue Share By Segment, 2019 (%)
Figure 104.Telstra Corporation Limited: Revenue, 2017–2019 ($Million)
Figure 105.Telstra Corporation Limited: Revenue Share By Segment, 2019 (%)
Figure 106.R&D Expenditure, 2017–2019 ($Million)
Figure 107.Tencent Holdings Ltd.: Revenue, 2017–2019 ($Million)
Figure 108.Tencent Holdings Ltd.: Revenue Share By Segment, 2019 (%)
Figure 109.Tencent Holdings Ltd.: Revenue Share By Region, 2019 (%)
$6469
$10167
HAVE A QUERY?
OUR CUSTOMER
