
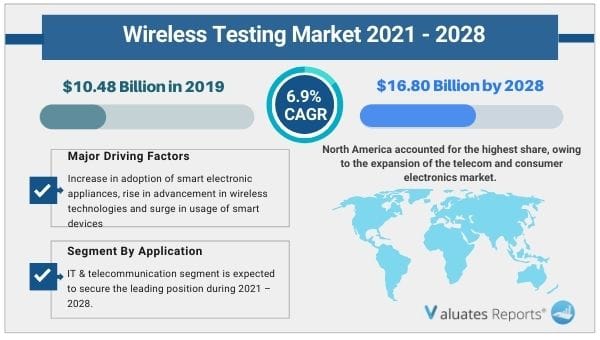
The global wireless testing market size is expected to reach US$ 16.80 billion by 2028 from US$ 10.48 billion in 2019 growing at a CAGR of 6.9% from 2021 to 2028. Key drivers of the wireless testing market include the advent of smart electronic appliances and devices.
The rapid improvements in wireless technologies will fuel the growth of the wireless testing market in the coming years. However, a lack of a skilled workforce and huge costs will hamper the market penetration during the review period. On the other hand, IoT technology will create considerable growth opportunities for the wireless testing market in the upcoming years.
Adoption of smart devices
The world is transitioning towards digitization at a rapid pace. Wireless smart devices have proliferated across the entire world. Headphones, speakers, earphones, smartwatches, etc have been adopted for increasing the convenience of the globalized world. The surge in internet penetration has further augmented the need for faster-connected devices. This necessitates the demand for rapid testing and certified regulatory standards on performance, network operability, reliability, safety, and environmental hazard. Then there are newer testing measures for digital car keys technology for pre-testing and verification. This will surge the demand for the wireless testing market during the forecast period.
Innovations in wireless technologies
With the advent of wifi, Bluetooth, 2G, 3G, and 4G data transmission and sharing have become seamless and fast. However, the next stage of wireless network technology advancements is already underway. The next generation 5G infrastructure, Lifi, or wireless charging, LTE will make connectivity and data supply much faster than its predecessors. Cybersecurity, dependability, and speed will be core focus areas moving forward. This in turn will boost the growth of the wireless testing market during the review period.
Rising costs
The gradual rise in device complexity has automatically surged the complications in the testing process. Additional wifi technologies such as 802.11p, 802.11ad, 802.11ah, and 802.11ax, 5G testing will require higher frequencies, antenna ports, and more testing infrastructure. This is expected to hinder the growth of the wireless testing market in the upcoming years.
IoT adoption
The rapid spurt in IoT technology has changed the overall testing landscape. Automated testing is crucial for faster implementation and deployment of IoT in every industry vertical. Threat assessment, simulation, and user experience testing have emerged in the increasingly connected world dependent on sensors and smart devices. It will involve device interaction, metrics-driven execution, etc. These rapidly changing developments will surge the growth of the wireless testing market in the upcoming years.
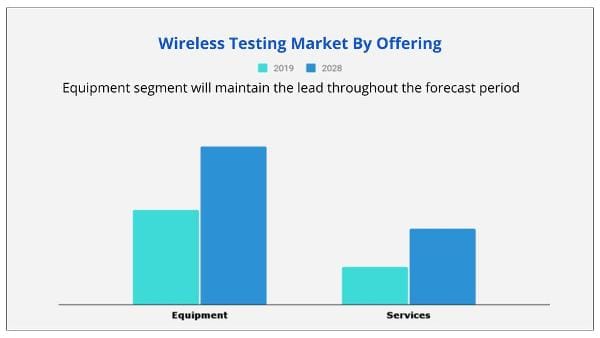
Based on offering, the equipment segment will be the most lucrative in the wireless testing market share during the forecast period.
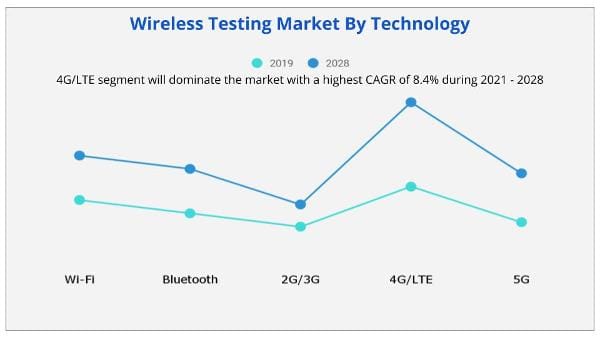
Based on technology, the 4g/LTE segment will dominate at a CAGR of 8.4%. On the other hand, the wifi segment will grow the fastest at a CAGR of 5.8% during the forecast period.
Based on region, North America will witness significant growth in the wireless testing market share. The Asia-pacific region will grow at a fast rate due to the increasing penetration of smart devices, mobile phones, and wireless technologies. While Germany will contribute the highest in Europe at 30% market share.
COVID-19 is having a large impact on both consumer and the economy. Several sectors have been temporarily working at low efficiency to contain the COVID-19 spread. This has majorly affected the supply chain of the market by creating shortages of materials, components, and finished goods. Lack of business continuity has ensured significant negative impacts on shareholder returns, and revenue, which are expected to create financial disruptions in the market.
North America is one of the key regions for the adoption and growth of advance technologies. Hence, any impact on the growth of industries is expected to affect the economic growth of the region in a negative manner. This pandemic and situation in the worlds impact the wireless testing market size with the China and U.S. being one of the important markets for wireless testing growth.
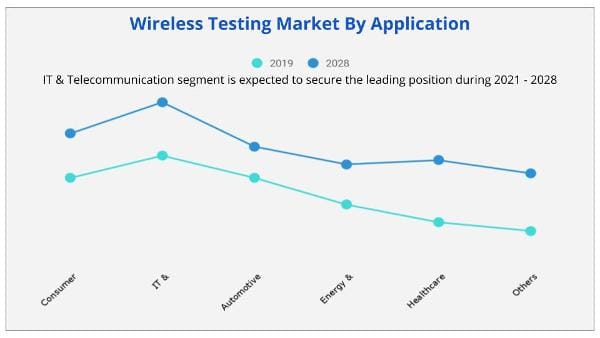
The prominent factors that drive the growth of the wireless testing market include increase in adoption of smart electronic appliances, rise in advancement in wireless technologies, and surge in usage of smart devices. However, lack of skilled workforce and high cost restrict the market growth. Conversely, high adoption of Internet of Things (IoT) technologies creates lucrative opportunities for the industry.
Competitive analysis and profiles of the major SGS Group, Anritsu Corporation, Bureau Veritas, DEKRA SE, Rohde & Schwarz GmbH & Co., Intertek Group Plc., TUV Rheinland, Viavi Solutions Inc., Electro Magnetic Test, Inc., and EXFO Inc. are provided in wireless testing market report. These key players have adopted various strategies, such as product portfolio expansion, mergers & acquisitions, agreements, geographical expansion, and collaborations, to increase their market penetration and strengthen their foothold in the industry.
| Report Metric | Details |
| Report Name | Wireless Testing Market |
| The market size in 2019 | USD 10.48 Billion |
| The revenue forecast in 2028 | USD 16.80 Billion |
| Growth Rate | Compound Annual Growth Rate (CAGR) of 6.9% from 2021 to 2028 |
| Market size available for years | 2021-2028 |
| Forecast units | Value (USD) |
| Segments covered | Type, Application and Region |
| Report coverage | Revenue & volume forecast, company share, competitive landscape, growth factors, and trends |
| Geographic regions covered | North America, Europe, Asia Pacific, Latin America, Middle East & Africa |
Ans. The global wireless testing market size is expected to reach $16.80 billion by 2028 from $10.48 billion in 2019.
Ans. The global wireless testing market is expected to grow at a compound annual growth rate of 16.9% from 2021 to 2028.
Ans. Some of the major companies are SGS Group, Anritsu Corporation, Bureau Veritas, DEKRA SE, Rohde & Schwarz GmbH & Co., Intertek Group Plc., TUV Rheinland, Viavi Solutions Inc., Electro Magnetic Test, Inc., and EXFO Inc.
CHAPTER 1:INTRODUCTION
1.1.Report description
1.2.Key benefits for stakeholders
1.3.Key market segments
1.4.Research methodology
1.4.1.Primary research
1.4.2.Secondary research
1.4.3.Analyst tools and models
CHAPTER 2:EXECUTIVE SUMMARY
2.1.CXO perspective
CHAPTER 3:MARKET OVERVIEW
3.1.Market definition and scope
3.2.COVID-19 Impact Analysis
3.2.1.COVID-19 Outbreak
3.2.2.Impact on market size
3.3.Key findings
3.3.1.Top impacting factors
3.3.2.Top investment pockets
3.4.Porter’s five forces analysis
3.5.Patent analysis
3.5.1.By region, 2012–2020
3.5.2.By applicant, 2012–2020
3.6.Market dynamics
3.6.1.Drivers
3.6.1.1.Increase in adoption of smart electronic appliances
3.6.1.2.Rise in advancement in wireless technologies
3.6.1.3.Surge in usage of smart devices
3.6.2.Restraint
3.6.2.1.Lack of skilled workforce and high cost
3.6.3.Opportunities
3.6.3.1.High adoption of Internet of Things (IoT) technologies
CHAPTER 4:GLOBAL WIRELESS TESTING MARKET, BY OFFERING
4.1.Overview
4.2.Equipment
4.2.1.Key market trends, growth factors, and opportunities
4.2.2.Market size and forecast, by region
4.2.3.Market analysis, by country
4.3.Services
4.3.1.Key market trends, growth factors, and opportunities
4.3.2.Market size and forecast, by region
4.3.3.Market analysis, by country
CHAPTER 5:GLOBAL WIRELESS TESTING MARKET, BY TECHNOLOGY
5.1.Overview
5.2.Wi-Fi
5.2.1.Key market trends, growth factors, and opportunities
5.2.2.Market size and forecast, by region
5.2.3.Market analysis, by country
5.3.Bluetooth
5.3.1.Key market trends, growth factors, and opportunities
5.3.2.Market size and forecast, by region
5.3.3.Market analysis, by country
5.4.2G/3G
5.4.1.Key market trends, growth factors, and opportunities
5.4.2.Market size and forecast, by region
5.4.3.Market analysis, by country
5.5.4G/LTE106
5.5.1.Key market trends, growth factors, and opportunities
5.5.2.Market size and forecast, by region
5.5.3.Market analysis, by country
5.6.5G
5.6.1.Key market trends, growth factors, and opportunities
5.6.2.Market size and forecast, by region
5.6.3.Market analysis, by country
CHAPTER 6:GLOBAL WIRELESS TESTING MARKET, BY APPLICATION
6.1.Overview
6.2.Consumer Electronics
6.2.1.Key market trends, growth factors, and opportunities
6.2.2.Market size and forecast, by region
6.2.3.Market analysis, by country
6.3.IT & Telecommunication
6.3.1.Key market trends, growth factors, and opportunities
6.3.2.Market size and forecast, by region
6.3.3.Market analysis, by country
6.4.Automotive
6.4.1.Key market trends, growth factors, and opportunities
6.4.2.Market size and forecast, by region
6.4.3.Market analysis, by country
6.5.Energy & Power
6.5.1.Key market trends, growth factors, and opportunities
6.5.2.Market size and forecast, by region
6.5.3.Market analysis, by country
6.6.Healthcare
6.6.1.Key market trends, growth factors, and opportunities
6.6.2.Market size and forecast, by region
6.6.3.Market analysis, by country
6.7.Others
6.7.1.Key market trends, growth factors, and opportunities
6.7.2.Market size and forecast, by region
6.7.3.Market analysis, by country
CHAPTER 7:WIRELESS TESTING MARKET, BY REGION
7.1.Overview
7.2.North America
7.2.1.Key market trends, growth factors, and opportunities
7.2.2.Market size and forecast, by offering
7.2.3.Market size and forecast, by technology
7.2.4.Market size and forecast, by application
7.2.5.Market analysis, by country
7.2.5.1.U.S.
7.2.5.1.1.Market size and forecast, by offering
7.2.5.1.2.Market size and forecast, by technology
7.2.5.1.3.Market size and forecast, by application
7.2.5.2.Canada
7.2.5.2.1.Market size and forecast, by offering
7.2.5.2.2.Market size and forecast, by technology
7.2.5.2.3.Market size and forecast, by application
7.2.5.3.Mexico
7.2.5.3.1.Market size and forecast, by offering
7.2.5.3.2.Market size and forecast, by technology
7.2.5.3.3.Market size and forecast, by application
7.3.Europe
7.3.1.Key market trends, growth factors, and opportunities
7.3.2.Market size and forecast, by offering
7.3.3.Market size and forecast, by technology
7.3.4.Market size and forecast, by application
7.3.5.Market analysis, by country
7.3.5.1.Germany
7.3.5.1.1.Market size and forecast, by offering
7.3.5.1.2.Market size and forecast, by technology
7.3.5.1.3.Market size and forecast, by application
7.3.5.2.UK
7.3.5.2.1.Market size and forecast, by offering
7.3.5.2.2.Market size and forecast, by technology
7.3.5.2.3.Market size and forecast, by application
7.3.5.3.France
7.3.5.3.1.Market size and forecast, by offering
7.3.5.3.2.Market size and forecast, by technology
7.3.5.3.3.Market size and forecast, by application
7.3.5.4.Italy
7.3.5.4.1.Market size and forecast, by offering
7.3.5.4.2.Market size and forecast, by technology2
7.3.5.4.3.Market size and forecast, by application
7.3.5.5.Rest of Europe
7.3.5.5.1.Market size and forecast, by offering
7.3.5.5.2.Market size and forecast, by technology
7.3.5.5.3.Market size and forecast, by application
7.4.Asia-Pacific
7.4.1.Key market trends, growth factors, and opportunities
7.4.2.Market size and forecast, by offering
7.4.3.Market size and forecast, by technology
7.4.4.Market size and forecast, by application
7.4.5.Market analysis, by country
7.4.5.1.China
7.4.5.1.1.Market size and forecast, by offering
7.4.5.1.2.Market size and forecast, by technology
7.4.5.1.3.Market size and forecast, by application
7.4.5.2.Japan
7.4.5.2.1.Market size and forecast, by offering
7.4.5.2.2.Market size and forecast, by technology
7.4.5.2.3.Market size and forecast, by application
7.4.5.3.South Korea
7.4.5.3.1.Market size and forecast, by offering
7.4.5.3.2.Market size and forecast, by technology
7.4.5.3.3.Market size and forecast, by application
7.4.5.4.India
7.4.5.4.1.Market size and forecast, by offering
7.4.5.4.2.Market size and forecast, by technology
7.4.5.4.3.Market size and forecast, by application
7.4.5.5.Rest of Asia-Pacific
7.4.5.5.1.Market size and forecast, by offering
7.4.5.5.2.Market size and forecast, by technology
7.4.5.5.3.Market size and forecast, by application
7.5.LAMEA
7.5.1.Key market trends, growth factors, and opportunities
7.5.2.Market size and forecast, by offering
7.5.3.Market size and forecast, by technology
7.5.4.Market size and forecast, by application
7.5.5.Market analysis, by country
7.5.5.1.Latin America3
7.5.5.1.1.Market size and forecast, by offering
7.5.5.1.2.Market size and forecast, by technology
7.5.5.1.3.Market size and forecast, by application
7.5.5.2.Middle East8
7.5.5.2.1.Market size and forecast, by offering
7.5.5.2.2.Market size and forecast, by technology
7.5.5.2.3.Market size and forecast, by application
7.5.5.3.Africa
7.5.5.3.1.Market size and forecast, by offering
7.5.5.3.2.Market size and forecast, by technology
7.5.5.3.3.Market size and forecast, by application
CHAPTER 8:COMPETITIVE LANDSCAPE
8.1.Introduction
8.1.1.Market player positioning, 2020
8.2.Top winning strategies
8.3.Product mapping of top 10 player
8.4.Competitive dashboard7
8.5.Competitive heatmap
CHAPTER 9:COMPANY PROFILES
9.1.SGS GROUP
9.1.1.Company overview
9.1.2.Company snapshot
9.1.3.Operating business segments
9.1.4.Product portfolio
9.1.5.R&D Expenditure
9.1.6.Business performance4
9.1.7.Key strategic moves and developments286
9.2.BUREAU VERITAS
9.2.1.Company overview
9.2.2.Key executives
9.2.3.Company snapshot
9.2.4.Operating business segments
9.2.5.Product portfolio
9.2.6.R&D expenditure
9.2.7.Business performance
9.2.8.Key strategic moves and developments
9.3.DEKRA SE
9.3.1.Company overview
9.3.2.Operating business segments
9.3.3.Product portfolio
9.3.4.R&D Expenditure
9.3.5.Business performance
9.3.6.Key strategic moves and developments
9.4.ROHDE & SCHWARZ GMBH & CO. LIMITED
9.4.1.Company overview
9.4.2.Company snapshot
9.4.3.Operating business segments
9.4.4.Product portfolio
9.4.5.R&D Expenditure
9.4.6.Business performance
9.5.INTERTEK GROUP PLC.
9.5.1.Company overview
9.5.2.Company snapshot
9.5.3.Operating business segments
9.5.4.Product portfolio
9.5.5.R&D Expenditure
9.5.6.Business performance
9.5.7.Key strategic moves and developments
9.6.TUV Rheinland
9.6.1.Company overview
9.6.2.Company snapshot
9.6.3.Operating business segments
9.6.4.Product portfolio
9.6.5.R&D expenditure
9.6.6.Business performance
9.7.Viavi Solutions Inc.
9.7.1.Company overview
9.7.2.Company snapshot
9.7.3.Product portfolio
9.7.4.Business performance
9.7.5.Key strategic moves and developments
9.8.Electro Magnetic Test, Inc.
9.8.1.Company overview
9.8.2.Company snapshot
9.8.3.Product portfolio
9.8.4.Key strategic moves and developments
9.9.ANRITSU CORPORATION
9.9.1.Company overview
9.9.2.Company snapshot
9.9.3.Product portfolio
9.10.EXFO Inc.
9.10.1.Company overview
9.10.2.Company snapshot
9.10.3.Product portfolio
9.10.4.Key strategic moves and developments
Tables & Figures :
TABLE 01.GLOBAL WIRELESS TESTING MARKET, BY OFFERING, 2019-2028 ($MILLION)
TABLE 02.GLOBAL WIRELESS TESTING MARKET FOR EQUIPMENT, BY REGION, 2019-2028 ($MILLION)
TABLE 03.WIRELESS TESTING MARKET FOR SERVICE, BY REGION, 2019-2028 ($MILLION)
TABLE 06.GLOBAL WIRELESS TESTING MARKET, BY TECHNOLOGY, 2019-2028 ($MILLION)
TABLE 07.WIRELESS TESTING MARKET FOR WI-FI, BY REGION, 2019-2028 ($MILLION)
TABLE 08.WIRELESS TESTING MARKET FOR BLUETOOTH, BY REGION, 2019-2028 ($MILLION)
TABLE 09.WIRELESS TESTING MARKET FOR 2G/3G, BY REGION, 2019-2028 ($MILLION)
TABLE 10.WIRELESS TESTING MARKET FOR 4G/LTE, BY REGION, 2019-2028 ($MILLION)
TABLE 11.WIRELESS TESTING MARKET FOR 5G, BY REGION, 2019-2028 ($MILLION)
TABLE 12.GLOBAL WIRELESS TESTING MARKET, BY APPLICATION, 2019-2028 ($MILLION)
TABLE 13.WIRELESS TESTING MARKET FOR CONSUMER ELECTRONICS, BY REGION, 2019-2028 ($MILLION)
TABLE 14.WIRELESS TESTING MARKET FOR IT & TELECOMMUNICATION, BY REGION, 2019-2028 ($MILLION)
TABLE 15.WIRELESS TESTING MARKET FOR AUTOMOTIVE, BY REGION, 2019-2028 ($MILLION)
TABLE 16.WIRELESS TESTING MARKET FOR ENERGY & POWER, BY REGION, 2019-2028 ($MILLION)
TABLE 17.WIRELESS TESTING MARKET FOR HEALTHCARE, BY REGION, 2019-2028 ($MILLION)
TABLE 18.WIRELESS TESTING MARKET FOR OTHER, BY REGION, 2019-2028 ($MILLION)
TABLE 19.WIRELESS TESTING MARKET REVENUE, BY REGION, 2019–2027 ($MILLION)
TABLE 20.NORTH AMERICA WIRELESS TESTING MARKET, BY OFFERING, 2019–2027 ($MILLION)
TABLE 21.NORTH AMERICA WIRELESS TESTING MARKET, BY TECHNOLOGY, 2019–2027 ($MILLION)
TABLE 22.NORTH AMERICA WIRELESS TESTING MARKET, BY APPLICATION, 2019–2027 ($MILLION)
TABLE 23.U.S. WIRELESS TESTING MARKET, BY OFFERING, 2019–2027 ($MILLION)
TABLE 24.U.S. WIRELESS TESTING MARKET, BY TECHNOLOGY, 2019–2027 ($MILLION)
TABLE 25.U.S. WIRELESS TESTING MARKET, BY APPLICATION, 2019-2028 ($MILLION)
TABLE 26.CANADA WIRELESS TESTING MARKET, BY OFFERING, 2019–2027 ($MILLION)
TABLE 27.CANADA WIRELESS TESTING MARKET, BY TECHNOLOGY, 2019–2027 ($MILLION)
TABLE 28.CANADA WIRELESS TESTING MARKET, BY APPLICATION, 2019-2028 ($MILLION)
TABLE 29.MEXICO WIRELESS TESTING MARKET, BY OFFERING, 2019–2027 ($MILLION)
TABLE 30.MEXICO WIRELESS TESTING MARKET, BY TECHNOLOGY, 2019–2028 ($MILLION)
TABLE 31.MEXICO WIRELESS TESTING MARKET, BY APPLICATION, 2019-2028 ($MILLION)
TABLE 32.EUROPE WIRELESS TESTING MARKET, BY OFFERING, 2019–2028 ($MILLION)
TABLE 33.EUROPE WIRELESS TESTING MARKET, BY TECHNOLOGY, 2019–2028 ($MILLION)
TABLE 34.EUROPE WIRELESS TESTING MARKET, BY APPLICATION, 2019–2028 ($MILLION)
TABLE 35.GERMANY WIRELESS TESTING MARKET, BY OFFERING, 2019–2028 ($MILLION)
TABLE 36.GERMANY WIRELESS TESTING MARKET, BY TECHNOLOGY, 2019–2028 ($MILLION)
TABLE 37.GERMANY WIRELESS TESTING MARKET, BY APPLICATION, 2019-2028 ($MILLION)
TABLE 38.UK WIRELESS TESTING MARKET, BY OFFERING, 2019–2028 ($MILLION)
TABLE 39.UK WIRELESS TESTING MARKET, BY TECHNOLOGY, 2019–2028 ($MILLION)
TABLE 40.UK WIRELESS TESTING MARKET, BY APPLICATION, 2019-2028 ($MILLION)
TABLE 41.FRANCE WIRELESS TESTING MARKET, BY OFFERING, 2019–2028 ($MILLION)
TABLE 42.FRANCE WIRELESS TESTING MARKET, BY TECHNOLOGY, 2019–2028 ($MILLION)
TABLE 43.FRANCE WIRELESS TESTING MARKET, BY APPLICATION, 2019-2028 ($MILLION)
TABLE 44.ITALY WIRELESS TESTING MARKET, BY OFFERING, 2019–2028 ($MILLION)
TABLE 45.ITALY WIRELESS TESTING MARKET, BY TECHNOLOGY, 2019–2028 ($MILLION)
TABLE 46.ITALY WIRELESS TESTING MARKET, BY APPLICATION, 2019-2028 ($MILLION)
TABLE 47.REST OF EUROPE WIRELESS TESTING MARKET, BY OFFERING, 2019–2028 ($MILLION)
TABLE 48.REST OF EUROPE WIRELESS TESTING MARKET, BY TECHNOLOGY, 2019–2028 ($MILLION)
TABLE 49.REST OF EUROPE WIRELESS TESTING MARKET, BY APPLICATION, 2019-2028 ($MILLION)
TABLE 50.ASIA-PACIFIC WIRELESS TESTING MARKET, BY OFFERING, 2019–2028 ($MILLION)
TABLE 51.ASIA-PACIFIC WIRELESS TESTING MARKET, BY TECHNOLOGY, 2019–2028 ($MILLION)
TABLE 52.ASIA-PACIFIC WIRELESS TESTING MARKET, BY APPLICATION, 2019–2028 ($MILLION)
TABLE 53.CHINA WIRELESS TESTING MARKET, BY OFFERING, 2019–2028 ($MILLION)
TABLE 54.CHINA WIRELESS TESTING MARKET, BY TECHNOLOGY, 2019–2028 ($MILLION)
TABLE 55.CHINA WIRELESS TESTING MARKET, BY APPLICATION, 2019-2028 ($MILLION)
TABLE 56.JAPAN WIRELESS TESTING MARKET, BY OFFERING, 2019–2028 ($MILLION)
TABLE 57.JAPAN WIRELESS TESTING MARKET, BY TECHNOLOGY, 2019–2028 ($MILLION)
TABLE 58.JAPAN WIRELESS TESTING MARKET, BY APPLICATION, 2019-2028 ($MILLION)
TABLE 59.SOUTH KOREA WIRELESS TESTING MARKET, BY OFFERING, 2019–2028 ($MILLION)
TABLE 60.SOUTH KOREA WIRELESS TESTING MARKET, BY TECHNOLOGY, 2019–2027 ($MILLION)
TABLE 61.SOUTH KOREA WIRELESS TESTING MARKET, BY APPLICATION, 2019-2028 ($MILLION)
TABLE 62.INDIA WIRELESS TESTING MARKET, BY OFFERING, 2019–2028 ($MILLION)
TABLE 63.INDIA WIRELESS TESTING MARKET, BY TECHNOLOGY, 2019–2028 ($MILLION)
TABLE 64.INDIA WIRELESS TESTING MARKET, BY APPLICATION, 2019-2028 ($MILLION)
TABLE 65.REST OF ASIA-PACIFIC WIRELESS TESTING MARKET, BY OFFERING, 2019–2028 ($MILLION)
TABLE 66.REST OF ASIA-PACIFIC WIRELESS TESTING MARKET, BY TECHNOLOGY, 2019–2028 ($MILLION)
TABLE 67.REST OF ASIA-PACIFIC WIRELESS TESTING MARKET, BY APPLICATION, 2019-2028 ($MILLION)
TABLE 68.LAMEA WIRELESS TESTING MARKET, BY OFFERING, 2019–2028 ($MILLION)
TABLE 69.LAMEA WIRELESS TESTING MARKET, BY TECHNOLOGY, 2019–2028 ($MILLION)
TABLE 70.LAMEA WIRELESS TESTING MARKET, BY APPLICATION, 2019–2028 ($MILLION)
TABLE 71.LATIN AMERICA WIRELESS TESTING MARKET, BY OFFERING, 2019–2028 ($MILLION)
TABLE 72.LATIN AMERICA WIRELESS TESTING MARKET, BY TECHNOLOGY, 2019–2028 ($MILLION)
TABLE 73.LATIN AMERICA WIRELESS TESTING MARKET, BY APPLICATION, 2019-2028 ($MILLION)
TABLE 74.MIDDLE EAST WIRELESS TESTING MARKET, BY OFFERING, 2019–2028 ($MILLION)
TABLE 75.MIDDLE EAST WIRELESS TESTING MARKET, BY TECHNOLOGY, 2019–2028 ($MILLION)
TABLE 76.MIDDLE EAST WIRELESS TESTING MARKET, BY APPLICATION, 2019-2028 ($MILLION)
TABLE 77.AFRICA WIRELESS TESTING MARKET, BY OFFERING, 2019–2028 ($MILLION)
TABLE 78.AFRICA WIRELESS TESTING MARKET, BY TECHNOLOGY, 2019–2028 ($MILLION)
TABLE 79.AFRICA WIRELESS TESTING MARKET, BY APPLICATION, 2019-2028 ($MILLION)
TABLE 80.SGS GROUP: COMPANY SNAPSHOT
TABLE 81.SGS GROUP: OPERATING SEGMENTS
TABLE 82.SGS GROUP: PRODUCT PORTFOLIO
TABLE 83.SGS GROUP.: KEY STRATEGIC MOVES AND DEVELOPMENTS
TABLE 84.BUREAU VERITAS: KEY EXECUTIVES
TABLE 85.BUREAU VERITAS: COMPANY SNAPSHOT
TABLE 86.BUREAU VERITAS: OPERATING SEGMENTS
TABLE 87.BUREAU VERITAS: PRODUCT PORTFOLIO
TABLE 88.DEKRA SE: COMPANY SNAPSHOT
TABLE 89.DEKRA SE: OPERATING SEGMENTS
TABLE 90.DEKRA SE: PRODUCT PORTFOLIO
TABLE 91.DEKRA SE: KEY STRATEGIC MOVES AND DEVELOPMENTS
TABLE 92.ROHDE & SCHWARZ GMBH & CO.: COMPANY SNAPSHOT
TABLE 93.ROHDE & SCHWARZ GMBH & CO.: OPERATING SEGMENTS
TABLE 94.ROHDE & SCHWARZ GMBH & CO.: PRODUCT PORTFOLIO
TABLE 95.INTERTEK GROUP PLC.: COMPANY SNAPSHOT
TABLE 96.INTERTEK GROUP PLC.: OPERATING SEGMENTS
TABLE 97.INTERTEK GROUP PLC.: PRODUCT PORTFOLIO
TABLE 98.TUV RHEINLAND: COMPANY SNAPSHOT
TABLE 99.TUV RHEINLAND: OPERATING SEGMENTS
TABLE 100.TUV RHEINLAND: PRODUCT PORTFOLIO
TABLE 101.VIAVI SOLUTIONS INC.: COMPANY SNAPSHOT
TABLE 102.VIAVI SOLUTIONS INC.: PRODUCT PORTFOLIO
TABLE 103.ELECTRO MAGNETIC TEST, INC.: COMPANY SNAPSHOT
TABLE 104.ELECTRO MAGNETIC TEST, INC.: PRODUCT PORTFOLIO
TABLE 105.ANRITSU CORPORATION: COMPANY SNAPSHOT
TABLE 106.ANRITSU CORPORATION: PRODUCT PORTFOLIO
TABLE 107.EXFO INC.: COMPANY SNAPSHOT
TABLE 108.EXFO INC.: PRODUCT PORTFOLIO
TABLE 109.EXFO INC.: KEY STRATEGIC MOVES AND DEVELOPMENTS
LIST OF FIGURES
FIGURE 01.KEY MARKET SEGMENTS
FIGURE 02.GLOBAL WIRELESS TESTING MARKET SNAPSHOT, BY SEGMENTATION
FIGURE 03.WIRELESS TESTING MARKET SNAPSHOT, BY REGION
FIGURE 04.TOP IMPACTING FACTORS
FIGURE 05.MODERATE-TO-HIGH BARGAINING POWER OF SUPPLIERS
FIGURE 06.MODERATE THREAT OF NEW ENTRANTS
FIGURE 07.MODERATE THREAT OF SUBSTITUTES
FIGURE 08.MODERATE-TO-HIGH INTENSITY OF RIVALRY
FIGURE 09.MODERATE-TO-HIGH BARGAINING POWER OF BUYERS
FIGURE 10.PATENT ANALYSIS, BY COUNTRY60
FIGURE 11.PATENT ANALYSIS, BY APPLICANT
FIGURE 12.GLOBAL WIRELESS TESTING MARKET, BY OFFERING, 2019-2028
FIGURE 13.COMPARATIVE SHARE ANALYSIS OF WIRELESS TESTING MARKET FOR EQUIPMENT, BY COUNTRY, 2019 & 2028 (%)
FIGURE 14.COMPARATIVE SHARE ANALYSIS OF WIRELESS TESTING MARKET FOR SERVICES, BY COUNTRY, 2019 & 2028 (%)
FIGURE 17.GLOBAL WIRELESS TESTING MARKET, BY TECHNOLOGY, 2019-2028
FIGURE 18.COMPARATIVE SHARE ANALYSIS OF WIRELESS TESTING MARKET FOR WI-FI, BY COUNTRY, 2019 & 2028 (%)
FIGURE 19.COMPARATIVE SHARE ANALYSIS OF WIRELESS TESTING MARKET FOR BLUETOOTH, BY COUNTRY, 2019 & 2028 (%)
FIGURE 20.COMPARATIVE SHARE ANALYSIS OF WIRELESS TESTING MARKET FOR 2G/3G, BY COUNTRY, 2019 & 2028 (%)
FIGURE 21.COMPARATIVE SHARE ANALYSIS OF WIRELESS TESTING MARKET FOR 4G/LTE, BY COUNTRY, 2019 & 2028 (%)
FIGURE 22.COMPARATIVE SHARE ANALYSIS OF WIRELESS TESTING MARKET FOR 5G, BY COUNTRY, 2019 & 2028 (%)
FIGURE 23.GLOBAL WIRELESS TESTING MARKET, BY APPLICATION, 2019-2028
FIGURE 24.COMPARATIVE SHARE ANALYSIS OF WIRELESS TESTING MARKET FOR CONSUMER ELECTRONICS, BY COUNTRY, 2019 & 2028 (%)
FIGURE 25.COMPARATIVE SHARE ANALYSIS OF WIRELESS TESTING MARKET FOR IT & TELECOMMUNICATION, BY COUNTRY, 2019 & 2028 (%)
FIGURE 26.COMPARATIVE SHARE ANALYSIS OF WIRELESS TESTING MARKET FOR AUTOMOTIVE, BY COUNTRY, 2019 & 2028 (%)
FIGURE 27.COMPARATIVE SHARE ANALYSIS OF WIRELESS TESTING MARKET FOR ENERGY & POWER, BY COUNTRY, 2019 & 2028 (%)
FIGURE 28.COMPARATIVE SHARE ANALYSIS OF WIRELESS TESTING MARKET FOR HEALTHCARE, BY COUNTRY, 2019 & 2028 (%)
FIGURE 29.COMPARATIVE SHARE ANALYSIS OF WIRELESS TESTING MARKET FOR OTHER, BY COUNTRY, 2019 & 2028 (%)
FIGURE 30.WIRELESS TESTING MARKET, BY REGION, 2019-2028 (%)
FIGURE 31.COMPARATIVE SHARE ANALYSIS OF NORTH AMERICA WIRELESS TESTING MARKET, BY COUNTRY, 2019–2028 (%)
FIGURE 32.U.S. WIRELESS TESTING MARKET, 2019–2028 ($MILLION)
FIGURE 33.CANADA WIRELESS TESTING MARKET, 2019–2028 ($MILLION)
FIGURE 34.MEXICO WIRELESS TESTING MARKET, 2019–2028 ($MILLION)
FIGURE 35.COMPARATIVE SHARE ANALYSIS OF EUROPE WIRELESS TESTING MARKET, BY COUNTRY, 2019–2028 (%)
FIGURE 36.GERMANY WIRELESS TESTING MARKET, 2019–2028 ($MILLION)
FIGURE 37.UK WIRELESS TESTING MARKET, 2019–2028 ($MILLION)
FIGURE 38.FRANCE WIRELESS TESTING MARKET, 2019–2028 ($MILLION)
FIGURE 39.ITALY WIRELESS TESTING MARKET, 2019–2028 ($MILLION)
FIGURE 40.REST OF EUROPE WIRELESS TESTING MARKET, 2019–2028 ($MILLION)
FIGURE 41.COMPARATIVE SHARE ANALYSIS OF ASIA-PACIFIC WIRELESS TESTING MARKET, BY COUNTRY, 2019–2028 (%)
FIGURE 42.CHINA WIRELESS TESTING MARKET, 2019–2028 ($MILLION)
FIGURE 43.JAPAN WIRELESS TESTING MARKET, 2019–2028 ($MILLION)
FIGURE 44.SOUTH KOREA WIRELESS TESTING MARKET, 2019–2028 ($MILLION)
FIGURE 45.INDIA WIRELESS TESTING MARKET, 2019–2028 ($MILLION)
FIGURE 46.REST OF ASIA-PACIFIC WIRELESS TESTING MARKET, 2019–2028 ($MILLION)
FIGURE 47.COMPARATIVE SHARE ANALYSIS OF LAMEA WIRELESS TESTING MARKET, BY COUNTRY, 2019–2028 (%)
FIGURE 48.LATIN AMERICA WIRELESS TESTING MARKET, 2019–2028 ($MILLION)
FIGURE 49.MIDDLE EAST WIRELESS TESTING MARKET, 2019–2028 ($MILLION)
FIGURE 50.AFRICA WIRELESS TESTING MARKET, 2019–2028 ($MILLION)
FIGURE 51.MARKET PLAYER POSITIONING, 2020
FIGURE 52.TOP WINNING STRATEGIES, BY YEAR, 2017-2020*
FIGURE 53.TOP WINNING STRATEGIES, BY DEVELOPMENT, 2017-2020*
FIGURE 54.TOP WINNING STRATEGIES, BY COMPANY, 2017-2020*
FIGURE 55.PRODUCT MAPPING OF TOP 10 PLAYERS
FIGURE 56.COMPETITIVE DASHBOARD
FIGURE 57.COMPETITIVE HEATMAP OF KEY PLAYERS
FIGURE 58.SGS GROUP: R&D EXPENDITURE, 2017–2019 ($MILLION)
FIGURE 59.SGS GROUP: REVENUE, 2017–2019 ($MILLION)
FIGURE 60.SGS GROUP: REVENUE SHARE BY SEGMENT, 2019 (%)
FIGURE 61.SGS GROUP: REVENUE SHARE BY REGION, 2019 (%)
FIGURE 62.R&D EXPENDITURE, 2018–2020 ($MILLION)
FIGURE 63.BUREAU VERITAS: REVENUE, 2018–2020 ($MILLION)
FIGURE 64.BUREAU VERITAS: REVENUE SHARE BY SEGMENT, 2020 (%)
FIGURE 65.BUREAU VERITAS: REVENUE SHARE BY REGION, 2020 (%)
FIGURE 66.R&D EXPENDITURE, 2017–2019($MILLION)
FIGURE 67.DEKRA SE: NET SALES, 2017–2019($MILLION)
FIGURE 68.DEKRA SE: REVENUE SHARE BY SEGMENT, 2019 (%)
FIGURE 69.DEKRA SE: REVENUE SHARE BY REGION, 2019 (%)
FIGURE 70.R&D EXPENDITURE, 2017–2019($MILLION)
FIGURE 71.ROHDE & SCHWARZ GMBH & CO.: NET SALES, 2018–2020($MILLION)
FIGURE 72.ROHDE & SCHWARZ GMBH & CO.: REVENUE SHARE BY SEGMENT, 2020 (%)
FIGURE 73.ROHDE & SCHWARZ GMBH & CO.: REVENUE SHARE BY REGION, 2020 (%)
FIGURE 74.R&D EXPENDITURE, 2018–2020 ($MILLION)
FIGURE 75.INTERTEK GROUP PLC.: REVENUE, 2018–2020 ($MILLION)
FIGURE 76.INTERTEK GROUP PLC.: REVENUE SHARE BY SEGMENT, 2020 (%)
FIGURE 77.INTERTEK GROUP PLC.: REVENUE SHARE BY REGION, 2020 (%)
FIGURE 78.TUV RHEINLAND: R&D EXPENDITURE, 2018–2020 ($MILLION)
FIGURE 79.TUV RHEINLAND: NET SALES, 2018–2020 ($MILLION)
FIGURE 80.TUV RHEINLAND: REVENUE SHARE BY SEGMENT, 2020 (%)
FIGURE 81.TUV RHEINLAND: REVENUE SHARE, BY REGION, 2020 (%)
FIGURE 82.VIAVI SOLUTIONS INC.: REVENUE, 2017–2019 ($MILLION)
FIGURE 83.VIAVI SOLUTIONS INC.: REVENUE SHARE BY PRODUCT, 2019 (%)
FIGURE 84.VIAVI SOLUTIONS INC.: REVENUE SHARE BY GEOGRAPHY, 2019 (%)
$6169
$6930
$10665
HAVE A QUERY?
OUR CUSTOMER
