
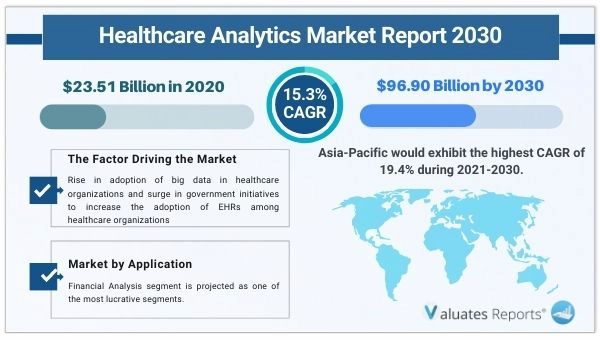
The global healthcare analytics market size was valued at $23.51 billion in 2020 and is projected to reach $96.90 billion by 2030, growing at a CAGR of 15.3% from 2021 to 2030.
Key drivers of the healthcare analytics market include the rapid adoption of big data analytics in healthcare organizations around the world. In the upcoming years, the healthcare analytics market will advance due to the spike in government support for preserving electronic health records in hospitals and the necessity to save unnecessary operational costs.
Hospital stakeholders have been pushed to invest in big data analytics due to the massive influx of data and rising patient volume in order to improve patient diagnosis and lower expenses for greater profitability. The amount of data used in the medical industry is influenced by patient portals, wearable technology, cell phones, and wearable devices. Forecasting treatment options, prices, in-the-moment warnings, individualized care, and effective operational streamlining are all made possible by big data analytics. It improves customer service, assesses high-risk symptoms, and improves clinical results. Through improved financial analysis, expense waste is decreased. Throughout the projected period, these factors will fuel the healthcare analytics market.
Healthcare analytics is now essential due to the computerized storage of specific patient data. Governments all across the world support EHR to enhance health outcomes. Data collection, mining, interpretation, and visualization all need the use of data analytic tools. They aid in tracking illnesses and providing precise diagnoses. Resource allocation is optimized, which results in effective cost control for healthcare. The healthcare analytics market will expand as a result of these reasons in the years to come.
The healthcare sector is moving towards a value-based system to alter the manner in which healthcare is delivered and evaluated. Value-based initiatives are having an impact since they are lowering mortality and readmission rates. Healthcare analytics is a crucial component of the evolving medical environment. The technology creates a single patient record out of all the scattered data pieces. The readily available knowledge aids in improving preventative healthcare for patients. Data on claim history, drug use, prior medical histories, and potential dangers are automatically updated. Well before it becomes a sickness, the ailment is trackable. This guarantees the effective distribution of limited hospital resources in serious situations. Over the anticipated period, these elements will fuel the healthcare analytics market.
The inefficiency and technological shortcomings in the healthcare sector have been exposed by Covid 19. Predictive analytics is therefore being used by medical professionals to track the virus's progress and assess its severity and risk to people of different ages. Information on bed capacity, ventilator availability, personnel requirements, and overall patient intake volume is being gathered using machine learning tools. The forecasting models aid in making decisions quickly and managing hospital infrastructure more effectively. The market for healthcare analytics will grow faster as a result in the next years.
However, the healthcare analytics market is projected to be hampered by factors such as high implementation costs and a scarcity of experienced workers.
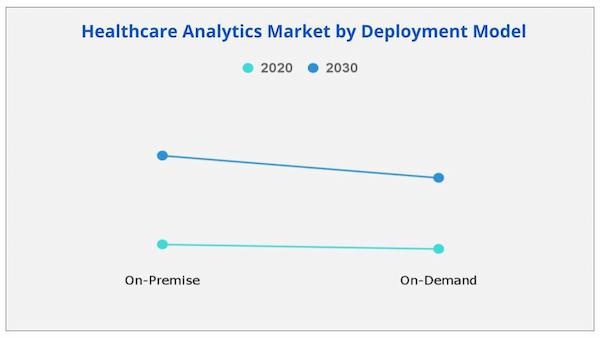
Based on the deployment model, the on-premise segment will offer lucrative growth opportunities in the healthcare analytics market share due to easy installation of IT infrastructure, better security, and use in large-scale organizations. However, the on-demand segment will grow the highest in the stipulated period.
Based on region, North America dominated the healthcare analytics market in 2020, and it is likely to continue to do so throughout the forecast period. This is due to an increase in federal healthcare mandates aimed at containing rising healthcare costs, as well as increased government programs focusing on individualized therapy. However, Asia-Pacific is predicted to witness the highest growth rate of 19.4% CAGR over the forecast period, owing to rising e-health initiatives in Asia-developing Pacific countries and a growing need for analytics solutions among healthcare companies to manage enormous amounts of patient data.
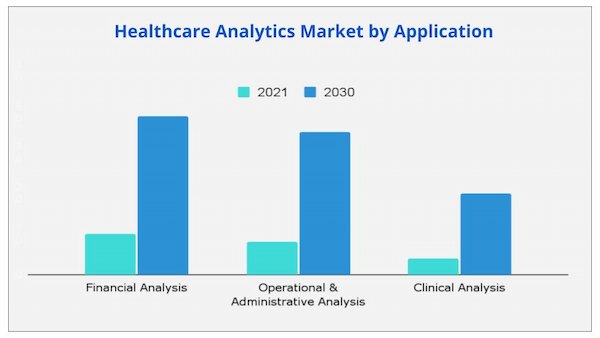
Based on application, financial analysis is expected to dominate in the healthcare analytics market share due to the need for curbing unnecessary financial leakage and fraudulent activities. However, the clinical analysis segment will grow the fastest due to AI, and ML implementation for decreasing medical errors.
Based on components, the service segment will maintain the lead in the healthcare analytics market share during the forecast period.
Based on the end-user, the healthcare payers segment will grow the largest due to the need for curbing fraud claims, and rising expenses.
Based on type, the descriptive analytics segment will dominate in the healthcare analytics market share due to the ability to analyze past data and provide crucial steps for better functioning.
Based on region, North America will provide lucrative opportunities for growth in the healthcare analytics market share due to rapid investment in analytics and the developed medical industry. On the other hand, Asia-Pacific will grow at the highest CAGR of 19.4% due to the gradual development of healthcare infrastructure and huge funding opportunities from private and government organizations.
| Report Metric | Details |
| Report Name | Healthcare Analytics Market |
| The market size in 2020 | USD 23.51 Billion |
| The revenue forecast in 2030 | USD 96.90 Billion |
| Growth Rate | CAGR 15.3% |
| Market size available for years | 2020-2030 |
| Forecast units | Value (USD) |
| Segments covered | Type, Application, Industry, Regions |
| Report coverage | Revenue & volume forecast, company share, competitive landscape, growth factors, and trends |
| Geographic regions covered | North America, Europe, Asia Pacific, Latin America, Middle East & Africa |
Ans. The global healthcare analytics market is estimated to grow with a CAGR of 15.3% during the forecast period.
Ans. The global healthcare analytics market size was valued at $23.51 billion in 2020 and is projected to reach $96.90 billion by 2030
Ans. The top companies that hold the market share in the global healthcare analytics market are Allscript Healthcare Solution, Cerner Corporation, Health Catalyst, HMS (Vitreoshealth)IBM Corporation, McKesson Corporation, MedeAnalytics, Inc., Oracle Corporation, Optum, Inc., and SAS, Institute.
Ans. Rise in adoption of big data in healthcare organizations and surge in government initiatives to increase the adoption of electronic health records (EHRs) among healthcare organizations boost the healthcare analytics market growth
Ans. By Application, Financial Analysis segment is projected as one of the most lucrative segments.
Ans. Yes, the report includes a COVID-19 impact analysis. Also, it is further extended into every individual segment of the report.
Table of Content
CHAPTER 1:INTRODUCTION
1.1.Report description
1.2.Key benefits for stakeholders
1.3.Key market segments
1.4.Research methodology
1.4.1.Secondary research
1.4.2.Primary research
1.4.3.Analyst tools & models
CHAPTER 2:EXECUTIVE SUMMARY
2.1.Key findings
2.1.1.Top impacting factors
2.1.2.Top investment pockets
2.2.CXO perspective
CHAPTER 3:MARKET OVERVIEW
3.1.Market definition and scope
3.2.Key forces shaping the global Healthcare analytics market
3.3.Market dynamics
3.3.1.Drivers
3.3.1.1.Rise in adoption of big data in healthcare organizations
3.3.1.2.Growing government initiatives to increase the adoption of electronic health records (EHRs) among healthcare organizations
3.3.1.3.Pressure among the healthcare organizations to curb the unnecessary expensive
3.3.2.Restraints
3.3.2.1.High Implementation cost
3.3.2.2.Lack of skilled labors
3.3.3.Opportunities
3.3.3.1.Use of cloud-based analytics across various healthcare providers
3.4.COVID-19 impact analysis on healthcare analytics market
3.4.1.Impact on market size
3.4.2.Consumer trends, preferences, and budget impact
3.4.3.Economic impact
3.4.4.Strategies to tackle negative impact
3.4.5.Opportunity window
CHAPTER 4:HEALTHCARE ANALYTICS MARKET, BY APPLICATION
4.1.Overview
4.2.Financial Analysis
4.2.1.Key market trends, growth factors, and opportunities
4.2.2.Market size and forecast, by region
4.2.3.Market analysis, by country
4.3.Operational & Administrative Analysis
4.3.1.Key market trends, growth factors, and opportunities
4.3.2.Market size and forecast, by region
4.3.3.Market analysis, by country
4.4.Clinical Analysis
4.4.1.Key market trends, growth factors, and opportunities
4.4.2.Market size and forecast, by region
4.4.3.Market analysis, by country
CHAPTER 5:HEALTHCARE ANALYTICS MARKET, BY COMPONENT
5.1.Overview
5.2.Hardware
5.2.1.Key market trends, growth factors, and opportunities
5.2.2.Market size and forecast, by region
5.2.3.Market analysis, by country
5.3.Software
5.3.1.Key market trends, growth factors, and opportunities
5.3.2.Market size and forecast, by region
5.3.3.Market analysis, by country
5.4.Service
5.4.1.Key market trends, growth factors, and opportunities
5.4.2.Market size and forecast, by region
5.4.3.Market analysis, by country
CHAPTER 6:HEALTHCARE ANALYTICS MARKET, BY DEPLOYMENT MODEL
6.1.Overview
6.2.On-premise
6.2.1.Key market trends, growth factors, and opportunities
6.2.2.Market size and forecast, by region
6.2.3.Market analysis, by country
6.3.On-Demand
6.3.1.Key market trends, growth factors, and opportunities
6.3.2.Market size and forecast, by region
6.3.3.Market analysis, by country
CHAPTER 7:HEALTHCARE ANALYTICS MARKET, BY END USER
7.1.Overview
7.2.Healthcare Payers
7.2.1.Key market trends, growth factors, and opportunities
7.2.2.Market size and forecast, by region
7.2.3.Market analysis, by country
7.3.Healthcare Providers
7.3.1.Key market trends, growth factors, and opportunities
7.3.2.Market size and forecast, by region
7.3.3.Market analysis, by country
7.4.Others
7.4.1.Key market trends, growth factors, and opportunities
7.4.2.Market size and forecast, by region
7.4.3.Market analysis, by country
CHAPTER 8:HEALTHCARE ANALYTICS MARKET, BY TYPE
8.1.Overview
8.2.Descriptive Analytics
8.2.1.Key market trends, growth factors, and opportunities
8.2.2.Market size and forecast, by region
8.2.3.Market analysis, by country
8.3.Predictive Analytics
8.3.1.Key market trends, growth factors, and opportunities
8.3.2.Market size and forecast, by region
8.3.3.Market analysis, by country
8.4.Prescriptive Analytics
8.4.1.Key market trends, growth factors, and opportunities
8.4.2.Market size and forecast, by region
8.4.3.Market analysis, by country
CHAPTER 9:HEALTHCARE ANALYTICS MARKET, BY REGION
9.1.Overview
9.1.1.Market size and forecast, by region
9.2.North America
9.2.1.Key market trends, growth factors, and opportunities
9.2.2.Market size and forecast, by application
9.2.3.Market size and forecast, by component
9.2.4.Market size and forecast, by deployment model
9.2.5.Market size and forecast, by traditional end user
9.2.6.Market size and forecast, by type
9.2.7.Market size and forecast, by country
9.2.7.1.U.S.
9.2.7.1.1.Market size and forecast, by application
9.2.7.1.2.Market size and forecast, by component
9.2.7.1.3.Market size and forecast, by deployment model
9.2.7.1.4.Market size and forecast, by traditional end user
9.2.7.1.5.Market size and forecast, by type
9.2.7.2.CANADA
9.2.7.2.1.Market size and forecast, by application
9.2.7.2.2.Market size and forecast, by component
9.2.7.2.3.Market size and forecast, by deployment model
9.2.7.2.4.Market size and forecast, by traditional end user
9.2.7.2.5.Market size and forecast, by type
9.3.Europe
9.3.1.Key market trends, growth factors, and opportunities
9.3.2.Market size and forecast, by application
9.3.3.Market size and forecast, by component
9.3.4.Market size and forecast, by deployment model
9.3.5.Market size and forecast, by traditional end user
9.3.6.Market size and forecast, by type
9.3.7.Market size and forecast, by country
9.3.7.1.UK
9.3.7.1.1.Market size and forecast, by application
9.3.7.1.2.Market size and forecast, by component
9.3.7.1.3.Market size and forecast, by deployment model
9.3.7.1.4.Market size and forecast, by traditional end user
9.3.7.1.5.Market size and forecast, by type
9.3.7.2.GERMANY
9.3.7.2.1.Market size and forecast, by application
9.3.7.2.2.Market size and forecast, by component
9.3.7.2.3.Market size and forecast, by deployment model
9.3.7.2.4.Market size and forecast, by traditional end user
9.3.7.2.5.Market size and forecast, by type
9.3.7.3.FRANCE
9.3.7.3.1.Market size and forecast, by application
9.3.7.3.2.Market size and forecast, by component
9.3.7.3.3.Market size and forecast, by deployment model
9.3.7.3.4.Market size and forecast, by traditional end user
9.3.7.3.5.Market size and forecast, by type
9.3.7.4.ITALY
9.3.7.4.1.Market size and forecast, by application
9.3.7.4.2.Market size and forecast, by component
9.3.7.4.3.Market size and forecast, by deployment model
9.3.7.4.4.Market size and forecast, by traditional end user
9.3.7.4.5.Market size and forecast, by type
9.3.7.5.SPAIN
9.3.7.5.1.Market size and forecast, by application
9.3.7.5.2.Market size and forecast, by component
9.3.7.5.3.Market size and forecast, by deployment model
9.3.7.5.4.Market size and forecast, by traditional end user
9.3.7.5.5.Market size and forecast, by type
9.3.7.6.NETHERLANDS
9.3.7.6.1.Market size and forecast, by application
9.3.7.6.2.Market size and forecast, by component
9.3.7.6.3.Market size and forecast, by deployment model
9.3.7.6.4.Market size and forecast, by traditional end user
9.3.7.6.5.Market size and forecast, by type
9.3.7.7.REST OF EUROPE
9.3.7.7.1.Market size and forecast, by application
9.3.7.7.2.Market size and forecast, by component
9.3.7.7.3.Market size and forecast, by deployment model
9.3.7.7.4.Market size and forecast, by traditional end user
9.3.7.7.5.Market size and forecast, by type
9.4.Asia-Pacific
9.4.1.Key market trends, growth factors, and opportunities
9.4.2.Market size and forecast, by application
9.4.3.Market size and forecast, by component
9.4.4.Market size and forecast, by deployment model
9.4.5.Market size and forecast, by traditional end user
9.4.6.Market size and forecast, by type
9.4.7.Market size and forecast, by country
9.4.7.1.CHINA
9.4.7.1.1.Market size and forecast, by application
9.4.7.1.2.Market size and forecast, by component
9.4.7.1.3.Market size and forecast, by deployment model
9.4.7.1.4.Market size and forecast, by traditional end user
9.4.7.1.5.Market size and forecast, by type
9.4.7.2.JAPAN
9.4.7.2.1.Market size and forecast, by application
9.4.7.2.2.Market size and forecast, by component
9.4.7.2.3.Market size and forecast, by deployment model
9.4.7.2.4.Market size and forecast, by traditional end user
9.4.7.2.5.Market size and forecast, by type
9.4.7.3.SOUTH KOREA
9.4.7.3.1.Market size and forecast, by application
9.4.7.3.2.Market size and forecast, by component
9.4.7.3.3.Market size and forecast, by deployment model
9.4.7.3.4.Market size and forecast, by traditional end user
9.4.7.3.5.Market size and forecast, by type
9.4.7.4.AUSTRALIA
9.4.7.4.1.Market size and forecast, by application
9.4.7.4.2.Market size and forecast, by component
9.4.7.4.3.Market size and forecast, by deployment model
9.4.7.4.4.Market size and forecast, by traditional end user
9.4.7.4.5.Market size and forecast, by type
9.4.7.5.INDIA
9.4.7.5.1.Market size and forecast, by application
9.4.7.5.2.Market size and forecast, by component
9.4.7.5.3.Market size and forecast, by deployment model
9.4.7.5.4.Market size and forecast, by traditional end user
9.4.7.5.5.Market size and forecast, by type
9.4.7.6.REST OF ASIA-PACIFIC
9.4.7.6.1.Market size and forecast, by application
9.4.7.6.2.Market size and forecast, by component
9.4.7.6.3.Market size and forecast, by deployment model
9.4.7.6.4.Market size and forecast, by traditional end user
9.4.7.6.5.Market size and forecast, by type
9.5.LAMEA
9.5.1.Key market trends, growth factors, and opportunities
9.5.2.Market size and forecast, by application
9.5.3.Market size and forecast, by component
9.5.4.Market size and forecast, by deployment model
9.5.5.Market size and forecast, by traditional end user
9.5.6.Market size and forecast, by type
9.5.7.Market size and forecast, by country
9.5.7.1.LATIN AMERICA
9.5.7.1.1.Market size and forecast, by application
9.5.7.1.2.Market size and forecast, by component
9.5.7.1.3.Market size and forecast, by deployment model
9.5.7.1.4.Market size and forecast, by traditional end user
9.5.7.1.5.Market size and forecast, by type
9.5.7.2.MIDDLE EAST
9.5.7.2.1.Market size and forecast, by application
9.5.7.2.2.Market size and forecast, by component
9.5.7.2.3.Market size and forecast, by deployment model
9.5.7.2.4.Market size and forecast, by traditional end user
9.5.7.2.5.Market size and forecast, by type
9.5.7.3.AFRICA
9.5.7.3.1.Market size and forecast, by application
9.5.7.3.2.Market size and forecast, by component
9.5.7.3.3.Market size and forecast, by deployment model
9.5.7.3.4.Market size and forecast, by traditional end user
9.5.7.3.5.Market size and forecast, by type
CHAPTER 10:COMPETITIVE LANDSCAPE
10.1.Key players positioning analysis, 2020
10.2.Competitive dashboard
10.3.Top winning strategies
CHAPTER 11:COMPANY PROFILE
11.1.ALLSCRIPTS HEALTHCARE, LLC
11.1.1.Company overview
11.1.2.Key executives
11.1.3.Company snapshot
11.1.4.Operating business segments
11.1.5.Product portfolio
11.1.6.R&D expenditure
11.1.7.Business performance
11.1.8.Key strategic moves and developments
11.2.Cerner Corporation
11.2.1.Company overview
11.2.2.Key Executives
11.2.3.Company snapshot
11.2.4.Product portfolio
11.2.5.Business performance
11.2.6.Key strategic moves and developments
11.3.HEALTH CATALYST
11.3.1.Company overview
11.3.2.Key executives
11.3.3.Company snapshot
11.3.4.Operating business segments
11.3.5.Product portfolio
11.3.6.R&D expenditure
11.3.7.Business performance
11.3.8.Key strategic moves and developments
11.4.HMS(VITREOSHEALTH)
11.4.1.Company overview
11.4.2.Key executive
11.4.3.Company snapshot
11.4.4.Product portfolio
11.4.5.Business performance
11.5.INTERNATIONAL BUSINESS MACHINES CORPORATION
11.5.1.Company overview
11.5.2.Key executive
11.5.3.Company snapshot
11.5.4.Operating business segments
11.5.5.Product portfolio
11.5.6.R&D expenditure
11.5.7.Business performance
11.5.8.Key strategic moves and developments
11.6.MCKESSON CORPORATION
11.6.1.Company overview
11.6.2.Key executives
11.6.3.Company snapshot
11.6.4.Operating business segments
11.6.5.Product portfolio
11.6.6.R&D expenditure
11.6.7.Business performance
11.6.8.Key strategic moves and developments
11.7.MEDEANALYTICS, INC.
11.7.1.Company overview
11.7.2.Key executives
11.7.3.Company snapshot
11.7.4.Product portfolio
11.7.5.Key strategic moves and developments
11.8.OPTUM, INC.
11.8.1.Company overview
11.8.2.Key executives
11.8.3.Company snapshot
11.8.4.Product portfolio
11.9.ORACLE CORPORATION
11.9.1.Company overview
11.9.2.Key Executives
11.9.3.Company snapshot
11.9.4.Operating business segments
11.9.5.Product portfolio
11.9.6.R&D Expenditure
11.9.7.Business performance
11.9.8.Key strategic moves and developments
11.10.SAS INSTITUTE INC.
11.10.1.Company overview
11.10.2.Key executive
11.10.3.Company snapshot
11.10.4.Product portfolio
11.10.5.Key strategic moves and developments
List of Tables & Figures
Table 01.Healthcare Analytics Market Revenue, By Application, 2020–2030 ($Million)
Table 02.Healthcare Analytics Market Revenue For Financial Analysis, By Region, 2020–2030 ($Million)
Table 03.Healthcare Analytics Market For Operational & Administrative Analysis, By Region 2020–2030 ($Million)
Table 04.Healthcare Analytics Market For Clinical Analysis, By Region 2020–2030 ($Million)
Table 05.Healthcare Analytics Market Revenue, By Component, 2020–2030 ($Million)
Table 06.Healthcare Analytics Market Revenue For Hardware, By Region, 2020–2030 ($Million)
Table 07.Healthcare Analytics Market For Software, By Region 2020–2030 ($Million)
Table 08.Healthcare Analytics Market For Service, By Region 2020–2030 ($Million)
Table 09.Healthcare Analytics Market Revenue, By Deployment Model, 2020–2030($Million)
Table 10.Healthcare Analytics Market Revenue For On-premise, By Region, 2020–2030 ($Million)
Table 11.Healthcare Analytics Market Revenue For On-demand, By Region, 2020–2030 ($Million)
Table 12.Healthcare Analytics Market Revenue, By End User, 2020–2030($Million)
Table 13.Healthcare Analytics Market Revenue For Healthcare Payers, By Region, 2020–2030 ($Million)
Table 14.Healthcare Analytics Market Revenue For Healthcare Providers, By Region, 2020–2030 ($Million)
Table 15.Healthcare Analytics Market Revenue For Others, By Region, 2020–2030 ($Million)
Table 16.Healthcare Analytics Market Revenue, By Type, 2020–2030($Million)
Table 17.Healthcare Analytics Market Revenue For Descriptive Analytics, By Region, 2020–2030 ($Million)
Table 18.Healthcare Analytics Market Revenue For Predictive Analytics, By Region, 2020–2030 ($Million)
Table 19.Healthcare Analytics Market Revenue For Prescriptive Analytics, By Region, 2020–2030 ($Million)
Table 20.Healthcare Analytics Market Revenue, By Region, 2020–2030 ($Million)
Table 21.North America Healthcare Analytics Market Revenue, By Application, 2020–2030 ($Million)
Table 22.North America Healthcare Analytics Market Revenue, By Component, 2020–2030 ($Million)
Table 23.North America Healthcare Analytics Market Revenue, By Deployment Model, 2020–2030 ($Million)
Table 24.North America Healthcare Analytics Market Revenue, By End User, 2020–2030 ($Million)
Table 25.North America Healthcare Analytics Market Revenue, By Type, 2020–2030 ($Million)
Table 26.North America Healthcare Analytics Market Revenue, By Country, 2020–2028 ($Million)
Table 27.U.S. Healthcare Analytics Market Revenue, By Application, 2020–2030 ($Million)
Table 28.U.S. Healthcare Analytics Market Revenue, By Component, 2020–2030 ($Million)
Table 29.U.S. Healthcare Analytics Market Revenue, By Deployment Model, 2020–2030 ($Million)
Table 30.U.S. Healthcare Analytics Market Revenue, By End User, 2020–2030 ($Million)
Table 31.U.S. Healthcare Analytics Market Revenue, By Type, 2020–2030 ($Million)
Table 32.Canada Healthcare Analytics Market Revenue, By Application, 2020–2030 ($Million)
Table 33.Canada Healthcare Analytics Market Revenue, By Component, 2020–2030 ($Million)
Table 34.Canada Healthcare Analytics Market Revenue, By Deployment Model, 2020–2030 ($Million)
Table 35.Canada Healthcare Analytics Market Revenue, By End User, 2020–2030 ($Million)
Table 36.Canada Healthcare Analytics Market Revenue, By Type, 2020–2030 ($Million)
Table 37.Europe Healthcare Analytics Market Revenue, By Application, 2020–2030 ($Million)
Table 38.Europe Healthcare Analytics Market Revenue, By Component, 2020–2030 ($Million)
Table 39.Europe Healthcare Analytics Market Revenue, By Deployment Model, 2020–2030 ($Million)
Table 40.Europe Healthcare Analytics Market Revenue, By End User, 2020–2030 ($Million)
Table 41.Europe Healthcare Analytics Market Revenue, By Type, 2020–2030 ($Million)
Table 42.Europe Healthcare Analytics Market Revenue, By Country, 2020–2028 ($Million)
Table 43.Uk Healthcare Analytics Market Revenue, By Application, 2020–2030 ($Million)
Table 44.Uk Healthcare Analytics Market Revenue, By Component, 2020–2030 ($Million)
Table 45.Uk Healthcare Analytics Market Revenue, By Deployment Model, 2020–2030 ($Million)
Table 46.Uk Healthcare Analytics Market Revenue, By End User, 2020–2030 ($Million)
Table 47.Uk Healthcare Analytics Market Revenue, By Type, 2020–2030 ($Million)
Table 48.Germany Healthcare Analytics Market Revenue, By Application, 2020–2030 ($Million)
Table 49.Germany Healthcare Analytics Market Revenue, By Component, 2020–2030 ($Million)
Table 50.Germany Healthcare Analytics Market Revenue, By Deployment Model, 2020–2030 ($Million)
Table 51.Germany Healthcare Analytics Market Revenue, By End User, 2020–2030 ($Million)
Table 52.Germany Healthcare Analytics Market Revenue, By Type, 2020–2030 ($Million)
Table 53.France Healthcare Analytics Market Revenue, By Application, 2020–2030 ($Million)
Table 54.France Healthcare Analytics Market Revenue, By Component, 2020–2030 ($Million)
Table 55.France Healthcare Analytics Market Revenue, By Deployment Model, 2020–2030 ($Million)
Table 56.France Healthcare Analytics Market Revenue, By End User, 2020–2030 ($Million)
Table 57.France Healthcare Analytics Market Revenue, By Type, 2020–2030 ($Million)
Table 58.Italy Healthcare Analytics Market Revenue, By Application, 2020–2030 ($Million)
Table 59.Italy Healthcare Analytics Market Revenue, By Component, 2020–2030 ($Million)
Table 60.Italy Healthcare Analytics Market Revenue, By Deployment Model, 2020–2030 ($Million)
Table 61.Italy Healthcare Analytics Market Revenue, By End User, 2020–2030 ($Million)
Table 62.Italy Healthcare Analytics Market Revenue, By Type, 2020–2030 ($Million)
Table 63.Spain Healthcare Analytics Market Revenue, By Application, 2020–2030 ($Million)
Table 64.Spain Healthcare Analytics Market Revenue, By Component, 2020–2030 ($Million)
Table 65.Spain Healthcare Analytics Market Revenue, By Deployment Model, 2020–2030 ($Million)
Table 66.Spain Healthcare Analytics Market Revenue, By End User, 2020–2030 ($Million)
Table 67.Spain Healthcare Analytics Market Revenue, By Type, 2020–2030 ($Million)
Table 68.Netherlands Healthcare Analytics Market Revenue, By Application, 2020–2030 ($Million)
Table 69.Netherlands Healthcare Analytics Market Revenue, By Component, 2020–2030 ($Million)
Table 70.Netherlands Healthcare Analytics Market Revenue, By Deployment Model, 2020–2030 ($Million)
Table 71.Netherlands Healthcare Analytics Market Revenue, By End User, 2020–2030 ($Million)
Table 72.Netherlands Healthcare Analytics Market Revenue, By Type, 2020–2030 ($Million)
Table 73.Rest Of Europe Healthcare Analytics Market Revenue, By Application, 2020–2030 ($Million)
Table 74.Rest Of Europe Healthcare Analytics Market Revenue, By Component, 2020–2030 ($Million)
Table 75.Rest Of Europe Healthcare Analytics Market Revenue, By Deployment Model, 2020–2030 ($Million)
Table 76.Rest Of Europe Healthcare Analytics Market Revenue, By End User, 2020–2030 ($Million)
Table 77.Rest Of Europe Healthcare Analytics Market Revenue, By Type, 2020–2030 ($Million)
Table 78.Asia-pacific Healthcare Analytics Market Revenue, By Application, 2020–2030 ($Million)
Table 79.Asia-pacific Healthcare Analytics Market Revenue, By Component, 2020–2030 ($Million)
Table 80.Asia-pacific Healthcare Analytics Market Revenue, By Deployment Model, 2020–2030 ($Million)
Table 81.Asia-pacific Healthcare Analytics Market Revenue, By End User, 2020–2030 ($Million)
Table 82.Asia-pacific Healthcare Analytics Market Revenue, By Type, 2020–2030 ($Million)
Table 83.Asia-pacific Healthcare Analytics Market Revenue, By Country, 2020–2028 ($Million)
Table 84.China Healthcare Analytics Market Revenue, By Application, 2020–2030 ($Million)
Table 85.China Healthcare Analytics Market Revenue, By Component, 2020–2030 ($Million)
Table 86.China Healthcare Analytics Market Revenue, By Deployment Model, 2020–2030 ($Million)
Table 87.China Healthcare Analytics Market Revenue, By End User, 2020–2030 ($Million)
Table 88.China Healthcare Analytics Market Revenue, By Type, 2020–2030 ($Million)
Table 89.Japan Healthcare Analytics Market Revenue, By Application, 2020–2030 ($Million)
Table 90.Japan Healthcare Analytics Market Revenue, By Component, 2020–2030 ($Million)
Table 91.Japan Healthcare Analytics Market Revenue, By Deployment Model, 2020–2030 ($Million)
Table 92.Japan Healthcare Analytics Market Revenue, By End User, 2020–2030 ($Million)
Table 93.Japan Healthcare Analytics Market Revenue, By Type, 2020–2030 ($Million)
Table 94.South Korea Healthcare Analytics Market Revenue, By Application, 2020–2030 ($Million)
Table 95.South Korea Healthcare Analytics Market Revenue, By Component, 2020–2030 ($Million)
Table 96.South Korea Healthcare Analytics Market Revenue, By Deployment Model, 2020–2030 ($Million)
Table 97.South Korea Healthcare Analytics Market Revenue, By End User, 2020–2030 ($Million)
Table 98.South Korea Healthcare Analytics Market Revenue, By Type, 2020–2030 ($Million)
Table 99.Australia Healthcare Analytics Market Revenue, By Application, 2020–2030 ($Million)
Table 100.Australia Healthcare Analytics Market Revenue, By Component, 2020–2030 ($Million)
Table 101.Australia Healthcare Analytics Market Revenue, By Deployment Model, 2020–2030 ($Million)
Table 102.Australia Healthcare Analytics Market Revenue, By End User, 2020–2030 ($Million)
Table 103.Australia Healthcare Analytics Market Revenue, By Type, 2020–2030 ($Million)
Table 104.India Healthcare Analytics Market Revenue, By Application, 2020–2030 ($Million)
Table 105.India Healthcare Analytics Market Revenue, By Component, 2020–2030 ($Million)
Table 106.India Healthcare Analytics Market Revenue, By Deployment Model, 2020–2030 ($Million)
Table 107.India Healthcare Analytics Market Revenue, By End User, 2020–2030 ($Million)
Table 108.India Healthcare Analytics Market Revenue, By Type, 2020–2030 ($Million)
Table 109.Rest Of Asia-pacific Healthcare Analytics Market Revenue, By Application, 2020–2030 ($Million)
Table 110.Rest Of Asia-pacific Healthcare Analytics Market Revenue, By Component, 2020–2030 ($Million)
Table 111.Rest Of Asia-pacific Healthcare Analytics Market Revenue, By Deployment Model, 2020–2030 ($Million)
Table 112.Rest Of Asia-pacific Healthcare Analytics Market Revenue, By End User, 2020–2030 ($Million)
Table 113.Rest Of Asia-pacific Healthcare Analytics Market Revenue, By Type, 2020–2030 ($Million)
Table 114.Lamea Healthcare Analytics Market Revenue, By Application, 2020–2030 ($Million)
Table 115.Lamea Healthcare Analytics Market Revenue, By Component, 2020–2030 ($Million)
Table 116.Lamea Healthcare Analytics Market Revenue, By Deployment Model, 2020–2030 ($Million)
Table 117.Lamea Healthcare Analytics Market Revenue, By End User, 2020–2030 ($Million)
Table 118.Lamea Healthcare Analytics Market Revenue, By Type, 2020–2030 ($Million)
Table 119.Lamea Healthcare Analytics Market Revenue, By Country, 2020–2028 ($Million)
Table 120.Latin America Healthcare Analytics Market Revenue, By Application, 2020–2030 ($Million)
Table 121.Latin America Healthcare Analytics Market Revenue, By Component, 2020–2030 ($Million)
Table 122.Latin America Healthcare Analytics Market Revenue, By Deployment Model, 2020–2030 ($Million)
Table 123.Latin America Healthcare Analytics Market Revenue, By End User, 2020–2030 ($Million)
Table 124.Latin America Healthcare Analytics Market Revenue, By Type, 2020–2030 ($Million)
Table 125.Middle East Healthcare Analytics Market Revenue, By Application, 2020–2030 ($Million)
Table 126.Middle East Healthcare Analytics Market Revenue, By Component, 2020–2030 ($Million)
Table 127.Middle East Healthcare Analytics Market Revenue, By Deployment Model, 2020–2030 ($Million)
Table 128.Middle East Healthcare Analytics Market Revenue, By End User, 2020–2030 ($Million)
Table 129.Middle East Healthcare Analytics Market Revenue, By Type, 2020–2030 ($Million)
Table 130.Africa Healthcare Analytics Market Revenue, By Application, 2020–2030 ($Million)
Table 131.Africa Healthcare Analytics Market Revenue, By Component, 2020–2030 ($Million)
Table 132.Africa Healthcare Analytics Market Revenue, By Deployment Model, 2020–2030 ($Million)
Table 133.Africa Healthcare Analytics Market Revenue, By End User, 2020–2030 ($Million)
Table 134.Africa Healthcare Analytics Market Revenue, By Type, 2020–2030 ($Million)
Table 135.Allscripts Healthcare, Llc: Key Executive
Table 136.Allscripts Healthcare, Llc: Company Snapshot
Table 137.Allscripts Healthcare, Llc: Operating Segments
Table 138.Allscripts Healthcare, Llc: Product Portfolio
Table 139.Cerner Corporation: Key Executives
Table 140.Cerner Corporation: Company Snapshot
Table 141.Cerner Corporation: Product Portfolio
Table 142.Health Catalyst: Key Executive
Table 143.Health Catalyst: Company Snapshot
Table 144.Health Catalyst: Operating Segments
Table 145.Health Catalyst: Product Portfolio
Table 146.Hms(Vitreoshealth): Key Executive
Table 147.Hms(Vitreoshealth): Company Snapshot
Table 148.Hms(Vitreoshealth): Product Portfolio
Table 149.International Business Machines Corporation: Key Executive
Table 150.International Business Machines Corporation: Company Snapshot
Table 151.International Business Machines Corporation: Operating Segments
Table 152.International Business Machines Corporation: Product Portfolio
Table 153.Mckesson Corporation.: Key Executives
Table 154.Mckesson Corporation : Company Snapshot
Table 155.Mckesson Corporation: Operating Segments
Table 156.Mckesson Corporation: Product Portfolio
Table 157.Medeanalytics, Inc.: Key Executives
Table 158.Medeanalytics, Inc.: Company Snapshot
Table 159.Medeanalytics, Inc.: Product Portfolio
Table 160.Optum, Inc.: Key Executives
Table 161.Optum, Inc.: Company Snapshot
Table 162.Optum, Inc.: Product Portfolio
Table 163.Oracle Corporation: Key Executives
Table 164.Oracle Corporation: Company Snapshot
Table 165.Oracle Corporation: Operating Segments
Table 166.Oracle Corporation: Product Portfolio
Table 167.Oracle Corporation: Key Strategic Moves And Developments
Table 168.Sas Institute Inc.: Key Executive
Table 169.Sas Institute Inc.: Company Snapshot
Table 170.Sas Institute Inc.: Product Portfolio
List Of Figures
Figure 01.Key Market Segments
Figure 02.Healthcare Analytics Market Snapshot, By Segmentation, 2020–2030
Figure 03.Healthcare Analytics Market Snapshot, By Country, 2020–2030
Figure 04.Top Impacting Factors
Figure 05.Top Investment Pockets
Figure 06.Moderate -to-high Bargaining Power Of Suppliers
Figure 07.Moderate-to-high Bargaining Power Of Buyer
Figure 08.Moderate Threat Of Substitutes
Figure 09.Moderate-to-high Threat Of New Entrants
Figure 10.Moderate-to-high Competitive Rivalry
Figure 11.Healthcare Analytics Market Revenue, By Application, 2020–2030 ($Million)
Figure 12.Comparative Share Analysis Of Healthcare Analytics Market For Financial Analysis, By Country, 2020 & 2030(%)
Figure 13.Comparative Share Analysis For Healthcare Analytics Market For Operational & Administrative Analysis, By Country, 2020 & 2030(%)
Figure 14.Comparative Share Analysis For Healthcare Analytics Market For Clinical Analysis, By Country, 2020 & 2030(%)
Figure 15.Healthcare Analytics Market Revenue, By Component, 2020–2030 ($Million)
Figure 16.Comparative Share Analysis Of Healthcare Analytics Market For Hardware, By Country, 2020 & 2030(%)
Figure 17.Comparative Share Analysis For Healthcare Analytics Market For Software, By Country, 2020 & 2030(%)
Figure 18.Comparative Share Analysis For Healthcare Analytics Market For Services, By Country, 2020 & 2030(%)
Figure 19.Healthcare Analytics Market, By Deployment Model, 2020–2030
Figure 20.Comparative Share Analysis Of Healthcare Analytics Market For On-premise, By Country, 2020 & 2030(%)
Figure 21.Comparative Share Analysis Of Healthcare Analytics Market For On-demand, By Country, 2020 & 2030 (%)
Figure 22.Healthcare Analytics Market, By End User, 2020–2030
Figure 23.Comparative Share Analysis Of Healthcare Analytics Market For Healthcare Payers, By Country, 2020 & 2030(%)
Figure 24.Comparative Share Analysis Of Healthcare Analytics Market For Healthcare Providers, By Country, 2020 & 2030(%)
Figure 25.Comparative Share Analysis Of Healthcare Analytics Market For Others, By Country, 2020 & 2030 (%)
Figure 26.Healthcare Analytics Market, By Type, 2020–2030
Figure 27.Comparative Share Analysis Of Healthcare Analytics Market For Descriptive Analytics, By Country, 2020 & 2030(%)
Figure 28.Comparative Share Analysis Of Healthcare Analytics Market For Predictive Analytics, By Country, 2020 & 2030(%)
Figure 29.Comparative Share Analysis Of Healthcare Analytics Market For Prescriptive Analytics, By Country, 2020 & 2030(%)
Figure 30.U.S. Healthcare Analytics Market Revenue, 2020–2030 ($Million)
Figure 31.Canada Healthcare Analytics Market Revenue, 2020–2030 ($Million)
Figure 32.Uk Healthcare Analytics Market Revenue, 2020–2030 ($Million)
Figure 33.Germany Healthcare Analytics Market Revenue, 2020–2030 ($Million)
Figure 34.France Healthcare Analytics Market Revenue, 2020–2030 ($Million)
Figure 35.Italy Healthcare Analytics Market Revenue, 2020–2030 ($Million)
Figure 36.Spain Healthcare Analytics Market Revenue, 2020–2030 ($Million)
Figure 37.Netherlands Healthcare Analytics Market Revenue, 2020–2030 ($Million)
Figure 38.Rest Of Europe Healthcare Analytics Market Revenue, 2020–2030 ($Million)
Figure 39.China Healthcare Analytics Market Revenue, 2020–2030 ($Million)
Figure 40.Japan Healthcare Analytics Market Revenue, 2020–2030 ($Million)
Figure 41.South Korea Healthcare Analytics Market Revenue, 2020–2030 ($Million)
Figure 42.Australia Healthcare Analytics Market Revenue, 2020–2030 ($Million)
Figure 43.India Healthcare Analytics Market Revenue, 2020–2030 ($Million)
Figure 44.Rest Of Asia-pacific Healthcare Analytics Market Revenue, 2020–2030 ($Million)
Figure 45.Latin America Healthcare Analytics Market Revenue, 2020–2030 ($Million)
Figure 46.Middle East Healthcare Analytics Market Revenue, 2020–2030 ($Million)
Figure 47.Africa Healthcare Analytics Market Revenue, 2020–2030 ($Million)
Figure 48.Key Player Positioning Anlysis: Global Healthcare Analytics Market
Figure 49.Competitive Dashboard
Figure 50.Competitive Dashboard
Figure 51.Competitive Heatmap Of Key Players
Figure 52.Top Winning Strategies, By Year, 2019-2021
Figure 53.Top Winning Strategies, By Development, 2019-2021
Figure 54.Top Winning Strategies, By Company, 2019-2021
Figure 55.R&D Expenditure, 2018–2020 ($Million)
Figure 56.Allscripts Healthcare, Llc: Revenue, 2018–2020 ($Million)
Figure 57.Allscripts Healthcare, Llc: Revenue Share By Segment, 2020 (%)
Figure 58.Allscripts Healthcare, Llc: Revenue Share By Region, 2020 (%)
Figure 59.Cerner Corporation: Revenue, 2018–2020 ($Million)
Figure 60.R&D Expenditure, 2018-2020 ($Million)
Figure 61.Health Catalyst: Revenue, 2018–2020 ($Million)
Figure 62.Health Catalyst: Revenue Share By Segment, 2020 (%)
Figure 63.Hms(Vitreoshealth): Revenue, 2018–2020 ($Million)
Figure 64.R&D Expenditure, 2018–2020 ($Million)
Figure 65.International Business Machines Corporation: Revenue, 2018–2020 ($Million)
Figure 66.International Business Machines Corporation: Revenue Share By Segment, 2020 (%)
Figure 67.International Business Machines Corporation: Revenue Share By Region, 2020 (%)
Figure 68.R&D Expenditure, 2019–2021 ($Million)
Figure 69.Mckesson Corporation: Revenue, 2019–2021 ($Million)
Figure 70.Mckesson Corporation: Revenue Share By Segment, 2021 (%)
Figure 71.R&D Expenditure, 2019–2021 ($Million)
Figure 72.Oracle Corporation: Revenue, 2019–2021 ($Million)
Figure 73.Oracle Corporation: Revenue Share By Segment, 2021 (%)
Figure 74.Oracle Corporation: Revenue Share By Region, 2021 (%)
$6169
$10665
HAVE A QUERY?
OUR CUSTOMER

SIMILAR REPORTS