
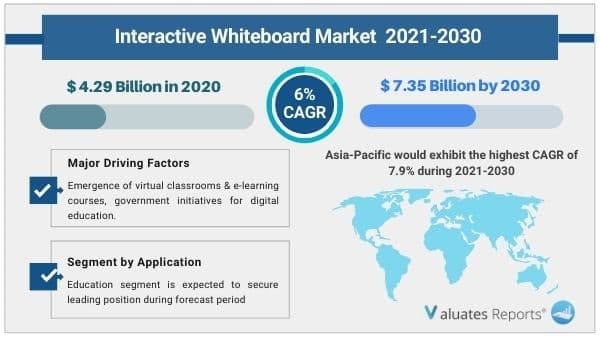
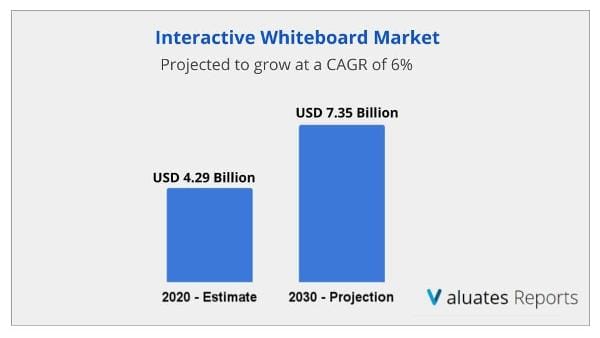
The global interactive whiteboard (IWB) market size was valued at USD 4.29 Billion in 2020, and is projected to reach USD 7.35 Billion by 2030 to register a CAGR of 6.0% from 2021 to 2030. IWB allows sharing content directly from personal devices such as mobiles and tabs easily allowing meetings to progress more fluidly and reduces downtime. This in turn is expected to increase its adoption in Corporates. The education segment has been adversely impacted by the emergence of COVID-19 pandemic.
An interactive whiteboard (IWB) or smart board is an interactive display board, which is a touch screen linked to a computer. Usually, these type of board looks similar to a big computer screen, where user can write & move images through touch of a pen or with fingers. However, many companies such as intech IWB software provides user more options & greater flexibility to create effective lesson and improve student’s knowledge by providing multi-touch, gesture recognition, remote class, split screen, and multi-language features. Also, the use of portable IWB (interactive whiteboard) is in the latest trend.
The global interactive whiteboard (IWB) market size is anticipated to witness significant growth during the forecast period. Factors such as emergence of virtual classrooms & e-learning courses, government initiatives for digital education, and transformation of traditional whiteboard into digital whiteboard drive the interactive whiteboard (IWB) market growth. In addition, growth in digitalization & high adoption of electronics products boost the overall market growth. However, lack of technical knowledge and high integration cost is a major restraint to global interactive whiteboard (IWB) industry. In addition, growth in educational sector in Asia-Pacific is expected to create lucrative opportunities for the interactive whiteboard (IWB) industry.
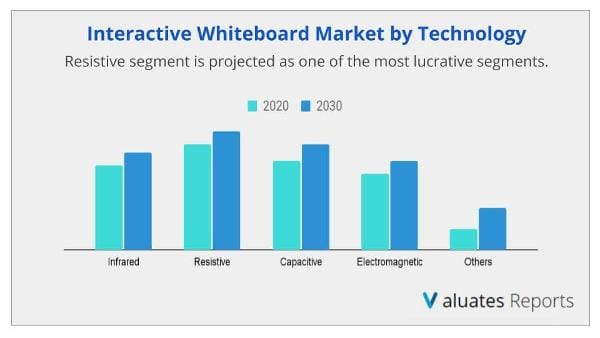
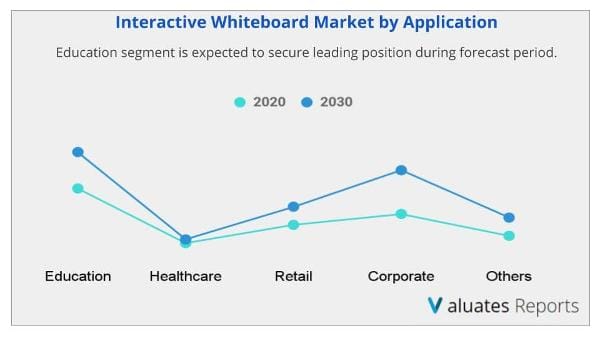
The global interactive whiteboard (IWB) market share is segmented into offering, form factor, screen size, technology, end user, and region. By offering, the market is segmented into hardware, and software. By form factor, it is segmented into fixed, and Portable. On the basis of Screen Size, the market is classified into Less than 50 Inch, 50 Inch to 70 Inch, 71 Inch to 90 inch, and Greater than 90 Inch. By technology, market is divided into Infrared, Resistive, Capacitive, Electromagnetic, and Others. By End user, market is segmented into Education, Healthcare, Retail, Corporate, and Others.
Region wise, the interactive whiteboard (IWB) market trends are analyzed across North America (the U.S., Canada, and Mexico), Europe (the UK, Germany, France, Italy, and rest of Europe), Asia-Pacific (China, Japan, India, South Korea, and Rest of Asia-Pacific), and LAMEA (Latin America, the Middle East, and Africa). Asia-Pacific is dominating the interactive whiteboard (IWB) market share, owing to growth in demand for educational products. In addition, Asia-Pacific is projected to register significant growth rate during the forecast period. Furthermore, Europe holds subsequent position and is expected to increase its growth rate by the end of the forecast period, followed by North America. Asia-Pacific would exhibit the highest CAGR of 7.9% during 2021-2030
Prominent factors that impact the interactive whiteboard (IWB) market growth are increase in demand from education sector and rapid digitalization across the globe. In addition, rise in trend of smart & touch-based devices drives the interactive whiteboard (IWB) market growth. However, lack of preparation for technology in several underdeveloped nations, and high cost of interactive whiteboard (IWB) in comparison to traditional whiteboards restricts the market growth. On the contrary, rise in focus toward adoption of new advance technologies and progressive development of digital content is expected to create lucrative opportunities for the market. Therefore, these factors are expected to definitely affect the development of the global interactive whiteboard (IWB) market during the forecast period.
Competitive analysis and profiles of the major interactive whiteboard (IWB) market players such as Hitachi, Horizon Display Inc., LG Electronics, Microsoft Corporation, Planar Systems (Leyard Optoelectronic), Ricoh, Samsung Electronics Co. Ltd., Seiko Epson Corporation, Sharp NEC Display Solutions of America, Inc., and Viewsonic Corporation.
|
Report Metric |
Details |
|
Report Name |
Interactive Whiteboard Market |
|
Market size value in 2020 |
USD 4.29 Billion |
|
Revenue forecast in 2030 |
USD 7.35 Billion |
|
CAGR Growth |
6.0% |
|
Base year considered |
2019 |
|
Historical Data for |
2021-2030 |
|
Segment by Offering |
Hardware and Software |
|
Form Factor |
Fixed and Portable |
|
Screen Size |
Less than 50 Inch, 50 Inch to 70 Inch, 71 Inch to 90 Inch, and Greater than 90 Inch |
|
By Technology |
Infrared, Resistive, Capacitive, Electromagnetic, and Others |
|
End User |
Education, Healthcare, Retail, Corporate |
Ans: The global interactive whiteboard (IWB) market size was valued at USD 4.29 Billion in 2020, and is projected to reach USD 7.35 Billion by 2030 to register a CAGR of 6.0% from 2021 to 2030.
Ans: Asia-Pacific would exhibit the highest CAGR of 7.9% during 2021-2030.
Some of the major companies are Hitachi, Horizon Display Inc., LG Electronics, Microsoft Corporation, Planar Systems (Leyard Optoelectronic), Ricoh, Samsung Electronics Co. Ltd., Seiko Epson Corporation, Sharp NEC Display Solutions of America, Inc., and Viewsonic Corporation.
Ans. Yes, the report includes a COVID-19 impact analysis. Also, it is further extended into every individual segment of the report.
CHAPTER 1: INTRODUCTION
1.1. Report description
1.2. Key benefits for stakeholders
1.3. Key market segments
1.4. Research methodology
1.4.1. Primary research
1.4.2. Secondary research
1.4.3. Analyst tools and models
CHAPTER 2: EXECUTIVE SUMMARY
2.1. Key findings
2.1.1. Top impacting factors
2.1.2. Top investment pockets
2.2. CXO perspective
CHAPTER 3: MARKET OVERVIEW
3.1. Market definition and scope
3.2. Porter’s five forces analysis
3.3. Patent analysis
3.3.1. Interactive whiteboard patent analysis, by region (2012-2020)
3.3.2. Interactive whiteboard patent analysis, by applicant
3.4. Market dynamics
3.4.1. Drivers
3.4.1.1. Increase in demand from education sector
3.4.1.2. Rapid digitalization across the globe
3.4.1.3. Rise in trend of smart & touch-based devices
3.4.2. Restraint
3.4.2.1. The lack of preparation for technology in several underdeveloped nations
3.4.2.2. High cost of interactive whiteboard in comparison to traditional whiteboards
3.4.3. Opportunities
3.4.3.1. Rise in focus toward adoption of new advance technology
3.4.3.2. Progressive development of digital content
3.5. COVID-19 impact analysis
3.5.1. COVID-19 outbreak
3.5.2. Impact on market size
3.5.3. Parent industry impact
3.5.4. Key player strategies to tackle negative impact
3.5.4.1. Limiting cuts to R&D expense
3.5.4.2. Focusing on next-generation products
3.5.4.3. Shifting toward agile supply chain model
3.5.5. Opportunity window
CHAPTER 4: INTERACTIVE WHITEBOARD MARKET, BY OFFERING
4.1. Overview
4.2. Hardware
4.2.1. Key market trends, growth factors, and opportunities
4.2.2. Market size and forecast, by region
4.2.3. Market analysis, by country
4.3. Software
4.3.1. Key market trends, growth factors, and opportunities
4.3.2. Market size and forecast, by region
4.3.3. Market analysis, by country
CHAPTER 5: INTERACTIVE WHITEBOARD MARKET, BY FORM FACTOR
5.1. Overview
5.2. Fixed
5.2.1. Key market trends, growth factors, and opportunities
5.2.2. Market size and forecast, by region
5.2.3. Market analysis, by country
5.2.4. Front Projection
5.2.4.1. Key market trends, growth factors, and opportunities
5.2.4.2. Less than 50 Inch
5.2.4.3. 50 Inch to 70 Inch
5.2.4.4. 71 Inch to 90 inch
5.2.4.5. Greater than 90 Inch
5.2.5. Rear Projection
5.2.5.1. Key market trends, growth factors, and opportunities
5.2.5.2. Less than 50 Inch
5.2.5.3. 50 Inch to 70 Inch
5.2.5.4. 71 Inch to 90 inch
5.2.5.5. Greater than 90 Inch
5.3. Portable
5.3.1. Key market trends, growth factors, and opportunities
5.3.2. Market size and forecast, by region
5.3.3. Market analysis, by country
5.3.4. Front Projection
5.3.4.1. Key market trends, growth factors, and opportunities
5.3.4.2. Less than 50 Inch
5.3.4.3. 50 Inch to 70 Inch
5.3.4.4. 71 Inch to 90 inch
5.3.4.5. Greater than 90 Inch
5.3.5. Rear Projection
5.3.5.1. Key market trends, growth factors, and opportunities
5.3.5.2. Less than 50 Inch
5.3.5.3. 50 Inch to 70 Inch
5.3.5.4. 71 Inch to 90 inch
5.3.5.5. Greater than 90 Inch
CHAPTER 6: INTERACTIVE WHITEBOARD MARKET, BY SCREEN SIZE
6.1. Overview
6.2. Less than 50 Inch
6.2.1. Key market trends, growth factors, and opportunities
6.2.2. Market size and forecast, by region
6.2.3. Market analysis, by country
6.3. 50 Inch to 70 Inch
6.3.1. Key market trends, growth factors, and opportunities
6.3.2. Market size and forecast, by region
6.3.3. Market analysis, by country
6.4. 71 Inch to 90 inch
6.4.1. Key market trends, growth factors, and opportunities
6.4.2. Market size and forecast, by region
6.4.3. Market analysis, by country
6.5. Greater than 90 Inch
6.5.1. Key market trends, growth factors, and opportunities
6.5.2. Market size and forecast, by region
6.5.3. Market analysis, by country
CHAPTER 7: INTERACTIVE WHITEBOARD MARKET, BY TECHNOLOGY
7.1. Overview
7.2. Infrared
7.2.1. Key market trends, growth factors, and opportunities
7.2.2. Market size and forecast, by region
7.2.3. Market analysis, by country
7.3. Resistive
7.3.1. Key market trends, growth factors, and opportunities
7.3.2. Market size and forecast, by region
7.3.3. Market analysis, by country
7.4. Capacitive
7.4.1. Key market trends, growth factors, and opportunities
7.4.2. Market size and forecast, by region
7.4.3. Market analysis, by country
7.5. Electromagnetic
7.5.1. Key market trends, growth factors, and opportunities
7.5.2. Market size and forecast, by region
7.5.3. Market analysis, by country
7.6. Others
7.6.1. Key market trends, growth factors, and opportunities
7.6.2. Market size and forecast, by region
7.6.3. Market analysis, by country
CHAPTER 8: INTERACTIVE WHITEBOARD MARKET, BY END USER
8.1. Overview
8.2. Education
8.2.1. Key market trends, growth factors, and opportunities
8.2.2. Market size and forecast, by region
8.2.3. Market analysis, by country
8.3. Healthcare
8.3.1. Key market trends, growth factors, and opportunities
8.3.2. Market size and forecast, by region
8.3.3. Market analysis, by country
8.4. Retail
8.4.1. Key market trends, growth factors, and opportunities
8.4.2. Market size and forecast, by region
8.4.3. Market analysis, by country
8.5. Corporate
8.5.1. Key market trends, growth factors, and opportunities
8.5.2. Market size and forecast, by region
8.5.3. Market analysis, by country
8.6. Others
8.6.1. Key market trends, growth factors, and opportunities
8.6.2. Market size and forecast, by region
8.6.3. Market analysis, by country
CHAPTER 9: INTERACTIVE WHITEBOARD MARKET, BY REGION
9.1. Overview
9.2. North America
9.2.1. Key market trends, growth factors, and opportunities
9.2.2. Market size and forecast, by Offering
9.2.3. Market size and forecast, by Form Factor
9.2.4. Market size and forecast, by Screen Size
9.2.5. Market size and forecast, by Technology
9.2.6. Market size and forecast, by End user
9.2.7. Market analysis, by country
9.2.7.1. U.S.
9.2.7.1.1. Market size and forecast, by Offering
9.2.7.1.2. Market size and forecast, by Form Factor
9.2.7.1.3. Market size and forecast, by Screen Size
9.2.7.1.4. Market size and forecast, by Technology
9.2.7.1.5. Market size and forecast, by End user
9.2.7.2. Canada
9.2.7.2.1. Market size and forecast, by Offering
9.2.7.2.2. Market size and forecast, by Form Factor
9.2.7.2.3. Market size and forecast, by Screen Size
9.2.7.2.4. Market size and forecast, by Technology
9.2.7.2.5. Market size and forecast, by End user
9.2.7.3. Mexico
9.2.7.3.1. Market size and forecast, by Offering
9.2.7.3.2. Market size and forecast, by Form Factor
9.2.7.3.3. Market size and forecast, by Screen Size
9.2.7.3.4. Market size and forecast, by Technology
9.2.7.3.5. Market size and forecast, by End user
9.3. Europe
9.3.1. Key market trends, growth factors, and opportunities
9.3.2. Market size and forecast, by Offering
9.3.3. Market size and forecast, by Form Factor
9.3.4. Market size and forecast, by Screen Size
9.3.5. Market size and forecast, by Technology
9.3.6. Market size and forecast, by End user
9.3.7. Market analysis, by country
9.3.7.1. UK
9.3.7.1.1. Market size and forecast, by Offering
9.3.7.1.2. Market size and forecast, by Form Factor
9.3.7.1.3. Market size and forecast, by Screen Size
9.3.7.1.4. Market size and forecast, by Technology
9.3.7.1.5. Market size and forecast, by End user
9.3.7.2. Germany
9.3.7.2.1. Market size and forecast, by Offering
9.3.7.2.2. Market size and forecast, by Form Factor
9.3.7.2.3. Market size and forecast, by Screen Size
9.3.7.2.4. Market size and forecast, by Technology
9.3.7.2.5. Market size and forecast, by End user
9.3.7.3. France
9.3.7.3.1. Market size and forecast, by Offering
9.3.7.3.2. Market size and forecast, by Form Factor
9.3.7.3.3. Market size and forecast, by Screen Size
9.3.7.3.4. Market size and forecast, by Technology
9.3.7.3.5. Market size and forecast, by End user
9.3.7.4. Italy
9.3.7.4.1. Market size and forecast, by Offering
9.3.7.4.2. Market size and forecast, by Form Factor
9.3.7.4.3. Market size and forecast, by Screen Size
9.3.7.4.4. Market size and forecast, by Technology
9.3.7.4.5. Market size and forecast, by End user
9.3.7.5. Rest of Europe
9.3.7.5.1. Market size and forecast, by Offering
9.3.7.5.2. Market size and forecast, by Form Factor
9.3.7.5.3. Market size and forecast, by Screen Size
9.3.7.5.4. Market size and forecast, by Technology
9.3.7.5.5. Market size and forecast, by End user
9.4. Asia-Pacific
9.4.1. Key market trends, growth factors, and opportunities
9.4.2. Market size and forecast, by Offering
9.4.3. Market size and forecast, by Form Factor
9.4.4. Market size and forecast, by Screen Size
9.4.5. Market size and forecast, by Technology
9.4.6. Market size and forecast, by End user
9.4.7. Market analysis, by country
9.4.7.1. China
9.4.7.1.1. Market size and forecast, by Offering
9.4.7.1.2. Market size and forecast, by Form Factor
9.4.7.1.3. Market size and forecast, by Screen Size
9.4.7.1.4. Market size and forecast, by Technology
9.4.7.1.5. Market size and forecast, by End user
9.4.7.2. Japan
9.4.7.2.1. Market size and forecast, by Offering
9.4.7.2.2. Market size and forecast, by Form Factor
9.4.7.2.3. Market size and forecast, by Screen Size
9.4.7.2.4. Market size and forecast, by Technology
9.4.7.2.5. Market size and forecast, by End user
9.4.7.3. India
9.4.7.3.1. Market size and forecast, by Offering
9.4.7.3.2. Market size and forecast, by Form Factor
9.4.7.3.3. Market size and forecast, by Screen Size
9.4.7.3.4. Market size and forecast, by Technology
9.4.7.3.5. Market size and forecast, by End user
9.4.7.4. South Korea
9.4.7.4.1. Market size and forecast, by Offering
9.4.7.4.2. Market size and forecast, by Form Factor
9.4.7.4.3. Market size and forecast, by Screen Size
9.4.7.4.4. Market size and forecast, by Technology
9.4.7.4.5. Market size and forecast, by End user
9.4.7.5. Rest of Asia-Pacific
9.4.7.5.1. Market size and forecast, by Offering
9.4.7.5.2. Market size and forecast, by Form Factor
9.4.7.5.3. Market size and forecast, by Screen Size
9.4.7.5.4. Market size and forecast, by Technology
9.4.7.5.5. Market size and forecast, by End user
9.5. LAMEA
9.5.1. Key market trends, growth factors, and opportunities
9.5.2. Market size and forecast, by Offering
9.5.3. Market size and forecast, by Form Factor
9.5.4. Market size and forecast, by Screen Size
9.5.5. Market size and forecast, by Technology
9.5.6. Market size and forecast, by End user
9.5.7. Market analysis, by country
9.5.7.1. LATIN AMERICA
9.5.7.1.1. Market size and forecast, by Offering
9.5.7.1.2. Market size and forecast, by Form Factor
9.5.7.1.3. Market size and forecast, by Screen Size
9.5.7.1.4. Market size and forecast, by Technology
9.5.7.1.5. Market size and forecast, by End user
9.5.7.2. Middle East
9.5.7.2.1. Market size and forecast, by Offering
9.5.7.2.2. Market size and forecast, by Form Factor
9.5.7.2.3. Market size and forecast, by Screen Size
9.5.7.2.4. Market size and forecast, by Technology
9.5.7.2.5. Market size and forecast, by End user
9.5.7.3. Africa
9.5.7.3.1. Market size and forecast, by Offering
9.5.7.3.2. Market size and forecast, by Form Factor
9.5.7.3.3. Market size and forecast, by Screen Size
9.5.7.3.4. Market size and forecast, by Technology
9.5.7.3.5. Market size and forecast, by End user
CHAPTER 10: COMPETITIVE LANDSCAPE
10.1. Introduction
10.1.1. Market Player Positioning, 2020
10.2. Product Mapping of Top 10 Player
10.3. Competitive Dashboard
10.4. Competitive Heatmap
10.5. Key Developments
10.5.1. New Product Launches
CHAPTER 11: COMPANY PROFILES
11.1. HITACHI, LTD.
11.1.1. Company overview
11.1.2. Company snapshot
11.1.3. Operating business segments
11.1.4. Product portfolio
11.1.5. Business performance
11.2. HORIZON DISPLAY INC.
11.2.1. Company overview
11.2.2. Key Executives
11.2.3. Company snapshot
11.2.4. Product portfolio
11.2.5. Key strategic moves and developments
11.3. LG ELECTRONICS
11.3.1. Company overview
11.3.2. Key Executives
11.3.3. Company snapshot
11.3.4. Operating business segments
11.3.5. Product portfolio
11.3.6. R&D Expenditure
11.3.7. Business performance
11.3.8. Key strategic moves and developments
11.4. MICROSOFT CORPORATION
11.4.1. Company overview
11.4.2. Key executives
11.4.3. Company snapshot
11.4.4. Operating business segments
11.4.5. Product portfolio
11.4.6. R&D expenditure
11.4.7. Business performance
11.4.8. Key strategic moves and developments
11.5. PLANAR SYSTEMS (LEYARD OPTOELECTRONIC)
11.5.1. Company overview
11.5.2. Key Executives
11.5.3. Company snapshot
11.5.4. Product portfolio
11.6. RICOH COMPANY LTD.
11.6.1. Company overview
11.6.2. Key Executives
11.6.3. Company snapshot
11.6.4. Operating business segments
11.6.5. Product portfolio
11.6.6. R&D Expenditure
11.6.7. Business performance
11.7. Samsung Electronics
11.7.1. Company overview
11.7.2. Key executives
11.7.3. Company snapshot
11.7.4. Operating business segments
11.7.5. Product portfolio
11.7.6. R&D expenditure
11.7.7. Business performance
11.7.8. Key strategic moves and developments
11.8. Seiko Epson Corporation (EPSON)
11.8.1. Company overview
11.8.2. Key Executives
11.8.3. Company snapshot
11.8.4. Operating business segments
11.8.5. Product portfolio
11.8.6. R&D Expenditure
11.8.7. Business performance
11.9. Sharp NEC Display Solutions of America, Inc.
11.9.1. Company overview
11.9.2. Key Executives
11.9.3. Company snapshot
11.9.4. Product portfolio
11.10. VIEWSONIC CORPORATION
11.10.1. Company overview
11.10.2. Key Executives
11.10.3. Company snapshot
11.10.4. Product portfolio
11.10.5. Key strategic moves and developments
LIST OF TABLES
TABLE 01. GLOBAL INTERACTIVE WHITEBOARD MARKET, BY OFFERING, 2020-2030 ($MILLION)
TABLE 02. INTERACTIVE WHITEBOARD MARKET FOR HARDWARE OFFERINGS, BY REGION, 2020–2030 ($MILLION)
TABLE 03. INTERACTIVE WHITEBOARD MARKET FOR SOFTWARE OFFERING, BY REGION 2020–2030($MILLION)
TABLE 04. GLOBAL INTERACTIVE WHITEBOARD MARKET REVENUE, BY FORM FACTOR, 2020-2030 ($MILLION)
TABLE 05. INTERACTIVE WHITEBOARD MARKET FOR FIXED, BY REGION 2020–2030 ($MILLION)
TABLE 06. INTERACTIVE WHITEBOARD MARKET FOR PORTABLE, BY REGION 2020–2030($MILLION)
TABLE 07. GLOBAL INTERACTIVE WHITEBOARD MARKET, BY SCREEN SIZE, 2020-2030 ($MILLION)
TABLE 08. INTERACTIVE WHITEBOARD MARKET FOR LESS THAN 50 INCH, BY REGION, 2020–2030 ($MILLION)
TABLE 09. INTERACTIVE WHITEBOARD MARKET FOR 50 INCH TO 70 INCH, BY REGION, 2020–2030 ($MILLION)
TABLE 10. INTERACTIVE WHITEBOARD MARKET FOR 71 INCH TO 90 INCH, BY REGION, 2020–2030 ($MILLION)
TABLE 11. INTERACTIVE WHITEBOARD MARKET FOR GREATER THAN 90 INCH, BY REGION, 2020–2030 ($MILLION)
TABLE 12. GLOBAL INTERACTIVE WHITEBOARD MARKET, BY TECHNOLOGY, 2020-2030 ($MILLION)
TABLE 13. INTERACTIVE WHITEBOARD MARKET FOR INFRARED, BY REGION, 2020–2030 ($MILLION)
TABLE 14. INTERACTIVE WHITEBOARD MARKET FOR RESISTIVE, BY REGION, 2020–2030 ($MILLION)
TABLE 15. INTERACTIVE WHITEBOARD MARKET FOR CAPACITIVE, BY REGION, 2020–2030 ($MILLION)
TABLE 16. INTERACTIVE WHITEBOARD MARKET FOR ELECTROMAGNETIC, BY REGION, 2020–2030 ($MILLION)
TABLE 17. INTERACTIVE WHITEBOARD MARKET FOR OTHERS, BY REGION, 2020–2030 ($MILLION)
TABLE 18. GLOBAL INTERACTIVE WHITEBOARD MARKET, BY END USER, 2020-2030 ($MILLION)
TABLE 19. INTERACTIVE WHITEBOARD MARKET FOR EDUCATION, BY REGION 2020–2030 ($MILLION)
TABLE 20. INTERACTIVE WHITEBOARD MARKET FOR HEALTHCARE, BY REGION 2020–2030 ($MILLION)
TABLE 21. INTERACTIVE WHITEBOARD MARKET FOR RETAIL, BY REGION 2020–2030 ($MILLION)
TABLE 22. INTERACTIVE WHITEBOARD MARKET FOR CORPORATE, BY REGION 2020–2030 ($MILLION)
TABLE 23. INTERACTIVE WHITEBOARD MARKET FOR OTHERS, BY REGION 2020–2030 ($MILLION)
TABLE 24. NORTH AMERICA INTERACTIVE WHITEBOARD MARKET, BY OFFERING 2020-2030($MILLION)
TABLE 25. NORTH AMERICA INTERACTIVE WHITEBOARD MARKET, BY FORM FACTOR 2020-2030($MILLION)
TABLE 26. NORTH AMERICA INTERACTIVE WHITEBOARD MARKET, BY SCREEN SIZE 2020-2030($MILLION)
TABLE 27. NORTH AMERICA INTERACTIVE WHITEBOARD MARKET, BY TECHNOLOGY 2020-2030($MILLION)
TABLE 28. NORTH AMERICA INTERACTIVE WHITEBOARD MARKET, BY END USER 2020-2030($MILLION)
TABLE 29. U.S. INTERACTIVE WHITEBOARD MARKET, BY OFFERING 2020-2028($MILLION)
TABLE 30. U.S. INTERACTIVE WHITEBOARD MARKET, BY FORM FACTOR 2020-2028($MILLION)
TABLE 31. U.S. INTERACTIVE WHITEBOARD MARKET, BY SCREEN SIZE 2020-2028($MILLION)
TABLE 32. U.S. INTERACTIVE WHITEBOARD MARKET, BY TECHNOLOGY 2020-2028($MILLION)
TABLE 33. U.S. INTERACTIVE WHITEBOARD MARKET, BY END USER 2020-2028($MILLION)
TABLE 34. CANADA INTERACTIVE WHITEBOARD MARKET, BY OFFERING 2020-2028($MILLION)
TABLE 35. CANADA INTERACTIVE WHITEBOARD MARKET, BY FORM FACTOR 2020-2028($MILLION)
TABLE 36. CANADA INTERACTIVE WHITEBOARD MARKET, BY SCREEN SIZE 2020-2028($MILLION)
TABLE 37. CANADA INTERACTIVE WHITEBOARD MARKET, BY TECHNOLOGY 2020-2028($MILLION)
TABLE 38. CANADA INTERACTIVE WHITEBOARD MARKET, BY END USER 2020-2028($MILLION)
TABLE 39. MEXICO INTERACTIVE WHITEBOARD MARKET, BY OFFERING 2020-2028($MILLION)
TABLE 40. MEXICO INTERACTIVE WHITEBOARD MARKET, BY FORM FACTOR 2020-2028($MILLION)
TABLE 41. MEXICO INTERACTIVE WHITEBOARD MARKET, BY SCREEN SIZE 2020-2028($MILLION)
TABLE 42. MEXICO INTERACTIVE WHITEBOARD MARKET, BY TECHNOLOGY 2020-2028($MILLION)
TABLE 43. MEXICO INTERACTIVE WHITEBOARD MARKET, BY END USER 2020-2028($MILLION)
TABLE 44. EUROPE INTERACTIVE WHITEBOARD MARKET, BY OFFERING 2020-2030($MILLION)
TABLE 45. EUROPE INTERACTIVE WHITEBOARD MARKET, BY FORM FACTOR 2020-2030($MILLION)
TABLE 46. EUROPE INTERACTIVE WHITEBOARD MARKET, BY SCREEN SIZE 2020-2030($MILLION)
TABLE 47. EUROPE INTERACTIVE WHITEBOARD MARKET, BY TECHNOLOGY 2020-2030($MILLION)
TABLE 48. EUROPE INTERACTIVE WHITEBOARD MARKET, BY END USER 2020-2030($MILLION)
TABLE 49. UK INTERACTIVE WHITEBOARD MARKET, BY OFFERING 2020-2028($MILLION)
TABLE 50. UK INTERACTIVE WHITEBOARD MARKET, BY FORM FACTOR 2020-2028($MILLION)
TABLE 51. UK INTERACTIVE WHITEBOARD MARKET, BY SCREEN SIZE 2020-2028($MILLION)
TABLE 52. UK INTERACTIVE WHITEBOARD MARKET, BY TECHNOLOGY 2020-2028($MILLION)
TABLE 53. UK INTERACTIVE WHITEBOARD MARKET, BY END USER 2020-2028($MILLION)
TABLE 54. GERMANY INTERACTIVE WHITEBOARD MARKET, BY OFFERING 2020-2028($MILLION)
TABLE 55. GERMANY INTERACTIVE WHITEBOARD MARKET, BY FORM FACTOR 2020-2028($MILLION)
TABLE 56. GERMANY INTERACTIVE WHITEBOARD MARKET, BY SCREEN SIZE 2020-2028($MILLION)
TABLE 57. GERMANY INTERACTIVE WHITEBOARD MARKET, BY TECHNOLOGY 2020-2028($MILLION)
TABLE 58. GERMANY INTERACTIVE WHITEBOARD MARKET, BY END USER 2020-2028($MILLION)
TABLE 59. FRANCE INTERACTIVE WHITEBOARD MARKET, BY OFFERING 2020-2028($MILLION)
TABLE 60. FRANCE INTERACTIVE WHITEBOARD MARKET, BY FORM FACTOR 2020-2028($MILLION)
TABLE 61. FRANCE INTERACTIVE WHITEBOARD MARKET, BY SCREEN SIZE 2020-2028($MILLION)
TABLE 62. FRANCE INTERACTIVE WHITEBOARD MARKET, BY TECHNOLOGY 2020-2028($MILLION)
TABLE 63. FRANCE INTERACTIVE WHITEBOARD MARKET, BY END USER 2020-2028($MILLION)
TABLE 64. ITALY INTERACTIVE WHITEBOARD MARKET, BY OFFERING 2020-2028($MILLION)
TABLE 65. ITALY INTERACTIVE WHITEBOARD MARKET, BY FORM FACTOR 2020-2028($MILLION)
TABLE 66. ITALY INTERACTIVE WHITEBOARD MARKET, BY SCREEN SIZE 2020-2028($MILLION)
TABLE 67. ITALY INTERACTIVE WHITEBOARD MARKET, BY TECHNOLOGY 2020-2028($MILLION)
TABLE 68. ITALY INTERACTIVE WHITEBOARD MARKET, BY END USER 2020-2028($MILLION)
TABLE 69. REST OF EUROPE INTERACTIVE WHITEBOARD MARKET, BY OFFERING 2020-2028($MILLION)
TABLE 70. REST OF EUROPE INTERACTIVE WHITEBOARD MARKET, BY FORM FACTOR 2020-2028($MILLION)
TABLE 71. REST OF EUROPE INTERACTIVE WHITEBOARD MARKET, BY SCREEN SIZE 2020-2028($MILLION)
TABLE 72. REST OF EUROPE INTERACTIVE WHITEBOARD MARKET, BY TECHNOLOGY 2020-2028($MILLION)
TABLE 73. REST OF EUROPE INTERACTIVE WHITEBOARD MARKET, BY END USER 2020-2028($MILLION)
TABLE 74. ASIA-PACIFIC INTERACTIVE WHITEBOARD MARKET, BY OFFERING 2020-2030($MILLION)
TABLE 75. ASIA-PACIFIC INTERACTIVE WHITEBOARD MARKET, BY FORM FACTOR 2020-2030($MILLION)
TABLE 76. ASIA-PACIFIC INTERACTIVE WHITEBOARD MARKET, BY SCREEN SIZE 2020-2030($MILLION)
TABLE 77. ASIA-PACIFIC INTERACTIVE WHITEBOARD MARKET, BY TECHNOLOGY 2020-2030($MILLION)
TABLE 78. ASIA-PACIFIC INTERACTIVE WHITEBOARD MARKET, BY END USER 2020-2030($MILLION)
TABLE 79. CHINA INTERACTIVE WHITEBOARD MARKET, BY OFFERING 2020-2028($MILLION)
TABLE 80. CHINA INTERACTIVE WHITEBOARD MARKET, BY FORM FACTOR 2020-2028($MILLION)
TABLE 81. CHINA INTERACTIVE WHITEBOARD MARKET, BY SCREEN SIZE 2020-2028($MILLION)
TABLE 82. CHINA INTERACTIVE WHITEBOARD MARKET, BY TECHNOLOGY 2020-2028($MILLION)
TABLE 83. CHINA INTERACTIVE WHITEBOARD MARKET, BY END USER 2020-2028($MILLION)
TABLE 84. JAPAN INTERACTIVE WHITEBOARD MARKET, BY OFFERING 2020-2028($MILLION)
TABLE 85. JAPAN INTERACTIVE WHITEBOARD MARKET, BY FORM FACTOR 2020-2028($MILLION)
TABLE 86. JAPAN INTERACTIVE WHITEBOARD MARKET, BY SCREEN SIZE 2020-2028($MILLION)
TABLE 87. JAPAN INTERACTIVE WHITEBOARD MARKET, BY TECHNOLOGY 2020-2028($MILLION)
TABLE 88. JAPAN INTERACTIVE WHITEBOARD MARKET, BY END USER 2020-2028($MILLION)
TABLE 89. INDIA INTERACTIVE WHITEBOARD MARKET, BY OFFERING 2020-2028($MILLION)
TABLE 90. INDIA INTERACTIVE WHITEBOARD MARKET, BY FORM FACTOR 2020-2028($MILLION)
TABLE 91. INDIA INTERACTIVE WHITEBOARD MARKET, BY SCREEN SIZE 2020-2028($MILLION)
TABLE 92. INDIA INTERACTIVE WHITEBOARD MARKET, BY TECHNOLOGY 2020-2028($MILLION)
TABLE 93. INDIA INTERACTIVE WHITEBOARD MARKET, BY END USER 2020-2028($MILLION)
TABLE 94. SOUTH KOREA INTERACTIVE WHITEBOARD MARKET, BY OFFERING 2020-2028($MILLION)
TABLE 95. SOUTH KOREA INTERACTIVE WHITEBOARD MARKET, BY FORM FACTOR 2020-2028($MILLION)
TABLE 96. SOUTH KOREA INTERACTIVE WHITEBOARD MARKET, BY SCREEN SIZE 2020-2028($MILLION)
TABLE 97. SOUTH KOREA INTERACTIVE WHITEBOARD MARKET, BY TECHNOLOGY 2020-2028($MILLION)
TABLE 98. SOUTH KOREA INTERACTIVE WHITEBOARD MARKET, BY END USER 2020-2028($MILLION)
TABLE 99. REST OF ASIA-PACIFIC INTERACTIVE WHITEBOARD MARKET, BY OFFERING 2020-2028($MILLION)
TABLE 100. REST OF ASIA-PACIFIC INTERACTIVE WHITEBOARD MARKET, BY FORM FACTOR 2020-2028($MILLION)
TABLE 101. REST OF ASIA-PACIFIC INTERACTIVE WHITEBOARD MARKET, BY SCREEN SIZE 2020-2028($MILLION)
TABLE 102. REST OF ASIA-PACIFIC INTERACTIVE WHITEBOARD MARKET, BY TECHNOLOGY 2020-2028($MILLION)
TABLE 103. REST OF ASIA-PACIFIC INTERACTIVE WHITEBOARD MARKET, BY END USER 2020-2028($MILLION)
TABLE 104. LAMEA INTERACTIVE WHITEBOARD MARKET, BY OFFERING 2020-2030($MILLION)
TABLE 105. LAMEA INTERACTIVE WHITEBOARD MARKET, BY FORM FACTOR 2020-2030($MILLION)
TABLE 106. LAMEA INTERACTIVE WHITEBOARD MARKET, BY SCREEN SIZE 2020-2030($MILLION)
TABLE 107. LAMEA INTERACTIVE WHITEBOARD MARKET, BY TECHNOLOGY 2020-2030($MILLION)
TABLE 108. LAMEA INTERACTIVE WHITEBOARD MARKET, BY END USER 2020-2030($MILLION)
TABLE 109. LATIN AMERICA INTERACTIVE WHITEBOARD MARKET, BY OFFERING 2020-2028($MILLION)
TABLE 110. LATIN AMERICA INTERACTIVE WHITEBOARD MARKET, BY FORM FACTOR 2020-2028($MILLION)
TABLE 111. LATIN AMERICA INTERACTIVE WHITEBOARD MARKET, BY SCREEN SIZE 2020-2028($MILLION)
TABLE 112. LATIN AMERICA INTERACTIVE WHITEBOARD MARKET, BY TECHNOLOGY 2020-2028($MILLION)
TABLE 113. LATIN AMERICA INTERACTIVE WHITEBOARD MARKET, BY END USER 2020-2028($MILLION)
TABLE 114. MIDDLE EAST INTERACTIVE WHITEBOARD MARKET, BY OFFERING 2020-2028($MILLION)
TABLE 115. MIDDLE EAST INTERACTIVE WHITEBOARD MARKET, BY FORM FACTOR 2020-2028($MILLION)
TABLE 116. MIDDLE EAST INTERACTIVE WHITEBOARD MARKET, BY SCREEN SIZE 2020-2028($MILLION)
TABLE 117. MIDDLE EAST INTERACTIVE WHITEBOARD MARKET, BY TECHNOLOGY 2020-2028($MILLION)
TABLE 118. MIDDLE EAST INTERACTIVE WHITEBOARD MARKET, BY END USER 2020-2028($MILLION)
TABLE 119. AFRICA INTERACTIVE WHITEBOARD MARKET, BY OFFERING 2020-2028($MILLION)
TABLE 120. AFRICA INTERACTIVE WHITEBOARD MARKET, BY FORM FACTOR 2020-2028($MILLION)
TABLE 121. AFRICA INTERACTIVE WHITEBOARD MARKET, BY SCREEN SIZE 2020-2028($MILLION)
TABLE 122. AFRICA INTERACTIVE WHITEBOARD MARKET, BY TECHNOLOGY 2020-2028($MILLION)
TABLE 123. AFRICA INTERACTIVE WHITEBOARD MARKET, BY END USER 2020-2028($MILLION)
TABLE 124. KEY NEW PRODUCT LAUNCHES (2017-2020)
TABLE 125. HITACHI, LTD.: COMPANY SNAPSHOT
TABLE 126. HITACHI, LTD.: OPERATING SEGMENTS
TABLE 127. HITACHI, LTD.: PRODUCT PORTFOLIO
TABLE 128. HORIZON DISPLAY INC.: KEY EXECUTIVES
TABLE 129. HORIZON DISPLAY INC.: COMPANY SNAPSHOT
TABLE 130. HORIZON DISPLAY INC.: PRODUCT PORTFOLIO
TABLE 131. LG ELECTRONICS: KEY EXECUTIVES
TABLE 132. LG ELECTRONICS.: COMPANY SNAPSHOT
TABLE 133. LG ELECTRONICS.: OPERATING SEGMENTS
TABLE 134. LG ELECTRONICS.: PRODUCT PORTFOLIO
TABLE 135. LG ELECTRONICS.: KEY STRATEGIC MOVES AND DEVELOPMENTS
TABLE 136. MICROSOFT CORPORATION: KEY EXECUTIVES
TABLE 137. MICROSOFT CORPORATION: COMPANY SNAPSHOT
TABLE 138. MICROSOFT CORPORATION: OPERATING SEGMENTS
TABLE 139. MICROSOFT CORPORATION: PRODUCT PORTFOLIO
TABLE 140. PLANAR SYSTEMS: KEY EXECUTIVES
TABLE 141. PLANAR SYSTEMS: COMPANY SNAPSHOT
TABLE 142. PLANAR SYSTEMS: PRODUCT PORTFOLIO
TABLE 143. RICOH COMPANY LTD.: KEY EXECUTIVES
TABLE 144. RICOH COMPANY LTD.: COMPANY SNAPSHOT
TABLE 145. RICOH COMPANY LTD.: OPERATING SEGMENTS
TABLE 146. RICOH COMPANY LTD.: PRODUCT PORTFOLIO
TABLE 147. RICOH COMPANY LTD.: REVENUE, 2018–2020 ($MILLION)
TABLE 148. SAMSUNG ELECTRONICS:KEY EXECUTIVES
TABLE 149. SAMSUNG ELECTRONICS: COMPANY SNAPSHOT
TABLE 150. SAMSUNG ELECTRONICS: OPERATING SEGMENTS
TABLE 151. SAMSUNG ELECTRONICS: PRODUCT PORTFOLIO
TABLE 152. SAMSUNG ELECTRONICS CO. LTD.: KEY STRATEGIC MOVES AND DEVELOPMENTS
TABLE 153. EPSON: KEY EXECUTIVES
TABLE 154. EPSON: COMPANY SNAPSHOT
TABLE 155. EPSON: OPERATING SEGMENTS
TABLE 156. EPSON: PRODUCT PORTFOLIO
TABLE 157. SHARP NEC DISPLAY SOLUTIONS OF AMERICA, INC.: KEY EXECUTIVES
TABLE 158. SHARP NEC DISPLAY SOLUTIONS OF AMERICA, INC.: COMPANY SNAPSHOT
TABLE 159. SHARP NEC DISPLAY SOLUTIONS OF AMERICA, INC.: PRODUCT PORTFOLIO
TABLE 160. VIEWSONIC CORPORATION: KEY EXECUTIVES
TABLE 161. VIEWSONIC CORPORATION: COMPANY SNAPSHOT
TABLE 162. VIEWSONIC CORPORATION: PRODUCT PORTFOLIO
TABLE 163. VIEWSONIC CORPORATION: KEY STRATEGIC MOVES AND DEVELOPMENTS
LIST OF FIGURES
FIGURE 01. KEY MARKET SEGMENTS
FIGURE 02. EXECUTIVE SUMMARY
FIGURE 03. EXECUTIVE SUMMARY
FIGURE 04. EXECUTIVE SUMMARY
FIGURE 05. TOP IMPACTING FACTORS
FIGURE 06. TOP INVESTMENT POCKETS
FIGURE 07. HIGH BARGAINING POWER OF SUPPLIERS
FIGURE 08. MODERATE THREAT OF NEW ENTRANTS
FIGURE 09. MODERATE THREAT OF SUBSTITUTES
FIGURE 10. MODERATE-TO-HIGH INTENSITY OF RIVALRY
FIGURE 11. LOW-TO-MODERATE BARGAINING POWER OF BUYERS
FIGURE 12. PATENT ANALYSIS, BY REGION
FIGURE 13. PATENT ANALYSIS, BY APPLICANT
FIGURE 14. GLOBAL INTERACTIVE WHITEBOARD MARKET, BY OFFERING, 2020-2030
FIGURE 15. COMPARATIVE SHARE ANALYSIS OF INTERACTIVE WHITEBOARD MARKET FOR HARDWARE OFFERING, BY COUNTRY, 2020 & 2030 (%)
FIGURE 16. COMPARATIVE SHARE ANALYSIS OF INTERACTIVE WHITEBOARD MARKET FOR SOFTWARE OFFERING, BY COUNTRY, 2020 & 2030 (%)
FIGURE 17. GLOBAL INTERACTIVE WHITEBOARD MARKET, BY FORM FACTOR, 2020-2030
FIGURE 18. COMPARATIVE SHARE ANALYSIS OF INTERACTIVE WHITEBOARD MARKET FOR FIXED, BY COUNTRY, 2020 & 2030 (%)
FIGURE 19. COMPARATIVE SHARE ANALYSIS OF INTERACTIVE WHITEBOARD MARKET FOR PORTABLE, BY COUNTRY, 2020 & 2030 (%)
FIGURE 20. GLOBAL INTERACTIVE WHITEBOARD MARKET, BY SCREEN SIZE, 2020-2030
FIGURE 21. COMPARATIVE SHARE ANALYSIS OF INTERACTIVE WHITEBOARD MARKET FOR LESS THAN 50 INCH, BY COUNTRY, 2020 & 2030 (%)
FIGURE 22. COMPARATIVE SHARE ANALYSIS OF INTERACTIVE WHITEBOARD MARKET FOR 50 INCH TO 70 INCH, BY COUNTRY, 2020 & 2030 (%)
FIGURE 23. COMPARATIVE SHARE ANALYSIS OF INTERACTIVE WHITEBOARD MARKET FOR 71 INCH TO 90 INCH, BY COUNTRY, 2020 & 2030 (%)
FIGURE 24. COMPARATIVE SHARE ANALYSIS OF INTERACTIVE WHITEBOARD MARKET FOR GREATER THAN 90 INCH, BY COUNTRY, 2020 & 2030 (%)
FIGURE 25. GLOBAL INTERACTIVE WHITEBOARD MARKET, BY TECHNOLOGY, 2020-2030
FIGURE 26. COMPARATIVE SHARE ANALYSIS OF INTERACTIVE WHITEBOARD MARKET FOR INFRARED, BY COUNTRY, 2020 & 2030 (%)
FIGURE 27. COMPARATIVE SHARE ANALYSIS OF INTERACTIVE WHITEBOARD MARKET FOR RESISTIVE, BY COUNTRY, 2020 & 2030 (%)
FIGURE 28. COMPARATIVE SHARE ANALYSIS OF INTERACTIVE WHITEBOARD MARKET FOR CAPACITIVE, BY COUNTRY, 2020 & 2030 (%)
FIGURE 29. COMPARATIVE SHARE ANALYSIS OF INTERACTIVE WHITEBOARD MARKET FOR ELECTROMAGNETIC, BY COUNTRY, 2020 & 2030 (%)
FIGURE 30. COMPARATIVE SHARE ANALYSIS OF INTERACTIVE WHITEBOARD MARKET FOR OTHERS, BY COUNTRY, 2020 & 2030 (%)
FIGURE 31. GLOBAL INTERACTIVE WHITEBOARD MARKET, BY END USER, 2020-2030
FIGURE 32. COMPARATIVE SHARE ANALYSIS OF INTERACTIVE WHITEBOARD MARKET FOR EDUCATION, BY COUNTRY, 2020 & 2030 (%)
FIGURE 33. COMPARATIVE SHARE ANALYSIS OF INTERACTIVE WHITEBOARD MARKET FOR HEALTHCARE, BY COUNTRY, 2020 & 2030 (%)
FIGURE 34. COMPARATIVE SHARE ANALYSIS OF INTERACTIVE WHITEBOARD MARKET FOR RETAIL, BY COUNTRY, 2020 & 2030 (%)
FIGURE 35. COMPARATIVE SHARE ANALYSIS OF INTERACTIVE WHITEBOARD MARKET FOR CORPORATE, BY COUNTRY, 2020 & 2030 (%)
FIGURE 36. COMPARATIVE SHARE ANALYSIS OF INTERACTIVE WHITEBOARD MARKET FOR OTHERS, BY COUNTRY, 2020 & 2030 (%)
FIGURE 37. GLOBAL INTERACTIVE WHITEBOARD MARKET, BY REGION, 2020-2030
FIGURE 38. NORTH AMERICA INTERACTIVE WHITEBOARD MARKET, BY COUNTRY, 2020-2030
FIGURE 39. U.S. INTERACTIVE WHITEBOARD MARKET, 2020-2030 ($MILLION)
FIGURE 40. CANADA INTERACTIVE WHITEBOARD MARKET, 2020-2030 ($MILLION)
FIGURE 41. MEXICO INTERACTIVE WHITEBOARD MARKET, 2020-2030 ($MILLION)
FIGURE 42. EUROPE INTERACTIVE WHITEBOARD MARKET, BY COUNTRY, 2020-2030
FIGURE 43. UK INTERACTIVE WHITEBOARD MARKET, 2020-2030 ($MILLION)
FIGURE 44. GERMANY INTERACTIVE WHITEBOARD MARKET, 2020-2030 ($MILLION)
FIGURE 45. FRANCE INTERACTIVE WHITEBOARD MARKET, 2020-2030 ($MILLION)
FIGURE 46. ITALY INTERACTIVE WHITEBOARD MARKET, 2020-2030 ($MILLION)
FIGURE 47. REST OF EUROPE INTERACTIVE WHITEBOARD MARKET, 2020-2030 ($MILLION)
FIGURE 48. ASIA-PACIFIC INTERACTIVE WHITEBOARD MARKET, BY COUNTRY, 2020-2030
FIGURE 49. CHINA INTERACTIVE WHITEBOARD MARKET, 2020-2030 ($MILLION)
FIGURE 50. JAPAN INTERACTIVE WHITEBOARD MARKET, 2020-2030 ($MILLION)
FIGURE 51. INDIA INTERACTIVE WHITEBOARD MARKET, 2020-2030 ($MILLION)
FIGURE 52. SOUTH KOREA INTERACTIVE WHITEBOARD MARKET, 2020-2030 ($MILLION)
FIGURE 53. REST OF ASIA-PACIFIC INTERACTIVE WHITEBOARD MARKET, 2020-2030 ($MILLION)
FIGURE 54. LAMEA INTERACTIVE WHITEBOARD MARKET, BY COUNTRY, 2020-2030
FIGURE 55. LATIN AMERICA INTERACTIVE WHITEBOARD MARKET, 2020-2030 ($MILLION)
FIGURE 56. MIDDLE EAST INTERACTIVE WHITEBOARD MARKET, 2020-2030 ($MILLION)
FIGURE 57. AFRICA INTERACTIVE WHITEBOARD MARKET, 2020-2030 ($MILLION)
FIGURE 58. MARKET PLAYER POSITIONING, 2020
FIGURE 59. PRODUCT MAPPING OF TOP 10 PLAYERS
FIGURE 60. COMPETITIVE DASHBOARD
FIGURE 61. COMPETITIVE HEATMAP OF KEY PLAYERS
FIGURE 62. HITACHI, LTD.: REVENUE, 2017–2019 ($MILLION)
FIGURE 63. HITACHI, LTD.: REVENUE SHARE BY SEGMENT, 2019 (%)
FIGURE 64. HITACHI, LTD.: REVENUE SHARE BY REGION, 2019 (%)
FIGURE 65. R&D EXPENDITURE, 2018–2020 ($MILLION)
FIGURE 66. LG ELECTRONICS.: NET SALES, 2018–2020 ($MILLION)
FIGURE 67. LG ELECTRONICS.: REVENUE SHARE BY SEGMENT, 2020 (%)
FIGURE 68. LG ELECTRONICS.: REVENUE SHARE BY REGION, 2020 (%)
FIGURE 69. R&D EXPENDITURE, 2018–2020 ($MILLION)
FIGURE 70. MICROSOFT CORPORATION: REVENUE, 2018–2020 ($MILLION)
FIGURE 71. MICROSOFT CORPORATION: REVENUE SHARE BY SEGMENT, 2020 (%)
FIGURE 72. MICROSOFT CORPORATION: REVENUE SHARE BY REGION, 2020 (%)
FIGURE 73. RICOH COMPANY LTD.: R&D EXPENDITURE, 2018–2020 ($MILLION)
FIGURE 74. RICOH COMPANY LTD.: REVENUE SHARE, BY SEGMENT, 2020 (%)
FIGURE 75. RICOH COMPANY LTD.: REVENUE SHARE, BY REGION, 2020 (%)
FIGURE 76. SAMSUNG ELECTRONICS: R&D EXPENDITURE, 2018–2020 ($MILLION)
FIGURE 77. SAMSUNG ELECTRONICS: NET SALES, 2018–2020 ($MILLION)
FIGURE 78. SAMSUNG ELECTRONICS: REVENUE SHARE, BY SEGMENT, 2020 (%)
FIGURE 79. SAMSUNG ELECTRONICS: REVENUE SHARE, BY REGION, 2020 (%)
FIGURE 80. EPSON, 2018–2020 ($MILLION)
FIGURE 81. EPSON: REVENUE, 2018–2020 ($MILLION)
FIGURE 82. EPSON: REVENUE SHARE BY SEGMENT, 2020 (%)
FIGURE 83. EPSON: REVENUE SHARE BY REGION, 2020 (%)
$6169
$10665
HAVE A QUERY?
OUR CUSTOMER

SIMILAR REPORTS