
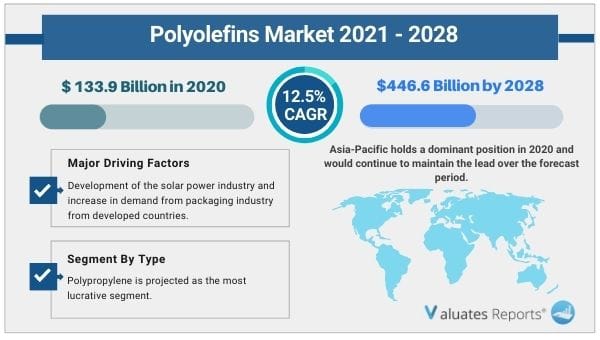
The polyolefins market was valued at USD 133.9 billion in 2020, and is projected to reach USD 446.6 billion by 2028, growing at a CAGR of 12.5% from 2021 to 2028. Numerous industries are facing changes in customer spending due to the outbreak of the COVID-19, which is hindering the polyolefins market growth. For instance, the automotive sector witnessed decline in sales in 2020, which, in turn, decreased the demand for polyolefins.
Polyolefin is a family of polypropylene and polyethylene thermoplastics. It is manufactured majorly from natural gas and oil by polymerization process of ethylene and propylene, respectively. It is produced from olefins/hydrocarbons/monomers, and exhibits high processability, superior chemical stability, and prolonged durability. It is the most widely used thermoplastic polymer enabling in a range of applications such as packaging, consumer goods, and fibers & textiles.
The growth of the global polyolefins market is driven by numerous factors such as the development of the solar power industry and increase in demand from the packaging industry from developed countries. However, volatile raw material prices hinder the market growth. On the contrary, the expansion of the packaging sector in the developing countries such as India and China is expected to create lucrative opportunities for the market players during the forecast period.
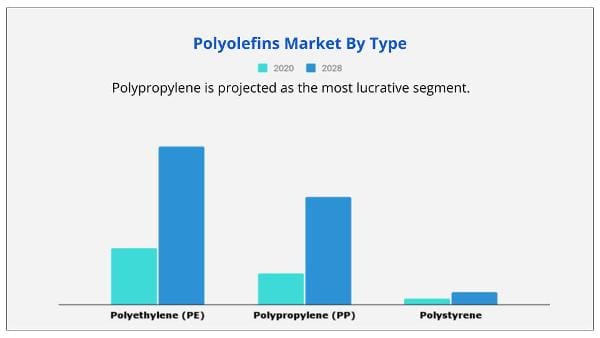
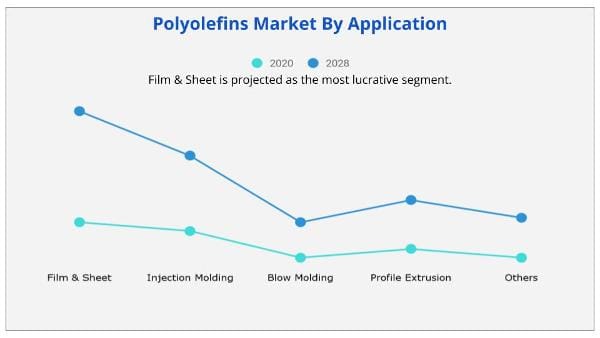
The global polyolefins market is segmented on the basis of type, application, and region. On the basis of type, the polyolefins market is categorized into polyethylene (PE), polypropylene (PP), and polystyrene. Depending on application, it is segregated into film & sheet, injection molding, blow molding, profile extrusion, and others. Region wise, the market is analyzed across North America, Europe, Asia-Pacific, and LAMEA. Polyolefins market share is analyzed across all significant regions and countries.
The polyolefins market analysis covers in-depth information of the major industry participants. Some of the major players in the market include Exxonmobil Corporation, SABIC, Total SE, Repsol, Ineos Group AG, Reliance Industries, LyondellBasell Industries N.V., Sinopec Group, Ducor Petrochemical, and Formosa Plastics Corporation. Other players in the value chain of the polyolefins market include Borealis AG, Arkema S.A., Braskem S.A, Abu Dhabi Polymers Company Ltd. (Borouge), Sasol Ltd., Tosoh Corporation, and Polyone Corporation. The key players adopt numerous strategies such as product launch, business expansion, acquisition, partnership, collaboration, joint venture, and agreement to stay competitive in the polyolefins market.
For instance, Saudi Basic Industries Corporation (SABIC), one of the largest petrochemicals manufacturers, launched a new anti-abrasive polyolefins compound pipe grade, a new polyolefin compound pipe grade, named SABIC P1600A. It is used for slurry transportation for mining industries. This new product offers anti-abrasion advantages over conventional materials such as steel and ceramic. The product launch has reinforced the product portfolio of the company.
In addition, Repsol, an energy company headquartered in Spain, developed three new grades of metallocene polyethylene at its plant in Tarragona, Spain for the automotive sector that reduces vehicle weight and hence reduce energy consumption. This product launch helped the company to strengthen its foothold in the global polyolefins market.
By type, the polyethylene segment garnered 65.6% share in terms of revenue in 2020, and is expected to grow at a CAGR of 11.6% during the forecast period. This is attributed to its high demand in numerous applications such as extrusion packaging applications, extrusion.
By application, the film & sheet segment garnered 31.0% share in 2020 in terms of volume. This is attributed to the rise in utilization of films in construction, automobile, solar energy, and food & nonfood packaging.
Region wise, Asia-Pacific is expected to grow at a CAGR of 13.6%, in terms of revenue during the forecast period. This is attributed to the presence of emerging economies such as India, China, Japan, and South Korea. These emerging economies have a rapidly growing consumer base such as packaging, automotive, and construction. China is one of the major contributors to the market, owing to a huge consumer base and presence of key players in the polyolefins market.
|
Report Metric |
Details |
|
Report Name |
Polyolefins Market Report |
|
The Market size value in 2020 |
133.9 Billion USD |
|
The Revenue forecast in 2028 |
446.6 Billion USD |
|
Growth Rate |
CAGR of 12.5% from 2021 to 2028 |
|
Base year considered |
2020 |
|
Forecast period |
2021-2028 |
|
Forecast units |
Value (USD) |
|
Segments covered |
Type, End-User, Offerings, and Region |
|
Report coverage |
Revenue & volume forecast, company share, competitive landscape, growth factors, and trends |
|
Geographic regions covered |
North America, Europe, Asia Pacific, Latin America, Middle East & Africa |
|
Companies covered |
Exxonmobil Corporation, SABIC, Total SE, Repsol, Ineos Group AG, Reliance Industries, LyondellBasell Industries N.V., Sinopec Group, Ducor Petrochemical, and Formosa Plastics Corporation. |
Ans. The polyolefins market was valued at USD 133.9 billion in 2020, and is projected to reach USD 446.6 billion by 2028.
Ans. The global polyolefins market is expected to grow at a compound annual growth rate of 12.5% from 2021 to 2028.
Ans. Exxonmobil Corporation, SABIC, Total SE, Repsol, Ineos Group AG, Reliance Industries, LyondellBasell Industries N.V., Sinopec Group, Ducor Petrochemical, and Formosa Plastics Corporation.
CHAPTER 1:INTRODUCTION
1.1.Report description
1.2.Key benefits for stakeholders
1.3.Key market segments
1.4.Research methodology
1.4.1.Primary research
1.4.2.Secondary research
1.4.3.Analyst tools and models
CHAPTER 2:EXECUTIVE SUMMARY
2.1.Key findings of the study
2.2.Key findings
2.2.1.Top investment pockets
2.3.CXO perspective
CHAPTER 3:MARKET OVERVIEW
3.1.Market definition and scope
3.2.Key forces shaping the polyolefins market
3.2.1.Bargaining power of the supplier
3.2.2.Bargaining power of the buyer
3.2.3.Threat of new entrant
3.2.4.Threat of substitutes
3.2.5.Competitive rivalry
3.3.Market dynamics
3.3.1.Drivers
3.3.1.1.Increase in demand from healthcare sector
3.3.1.2.Growth in deployment of renewable energy
3.3.2.Restraint
3.3.2.1.Volatile prices of raw materials
3.3.3.Opportunity
3.3.3.1.Increasing food sector in emerging economies
3.4.Value chain
3.5.Pricing analysis 2020-2028
3.6.Patent analysis 2012-2020
3.7.Impact of COVID-19 outbreak on the market
CHAPTER 4:POLYOLEFINS MARKET, BY TYPE
4.1.Overview
4.1.1.Market size and forecast
4.2.Polyethylene
4.2.1.Key market trends, growth factors, and opportunities
4.2.2.Market size and forecast, by region
4.2.3.Market analysis, by country
4.3.Polypropylene
4.3.1.Key market trends, growth factors, and opportunities
4.3.2.Market size and forecast, by region
4.3.3.Market analysis, by country
4.4.Polystyrene
4.4.1.Key market trends, growth factors, and opportunities
4.4.2.Market size and forecast, by region
4.4.3.Market analysis, by country
CHAPTER 5:POLYOLEFINS MARKET, BY APPLICATION
5.1.Overview
5.1.1.Market size and forecast
5.2.Film & Sheet
5.2.1.Key market trends, growth factors, and opportunities
5.2.2.Market size and forecast, by region
5.2.3.Market analysis, by country
5.3.Injection molding
5.3.1.Key market trends, growth factors, and opportunities
5.3.2.Market size and forecast, by region
5.3.3.Market analysis, by country
5.4.Blow Molding
5.4.1.Key market trends, growth factors, and opportunities
5.4.2.Market size and forecast, by region
5.4.3.Market analysis, by country
5.5.Profile extrusion
5.5.1.Key market trends, growth factors, and opportunities
5.5.2.Market size and forecast, by region
5.5.3.Market analysis, by country
5.6.Others
5.6.1.Key market trends, growth factors, and opportunities
5.6.2.Market size and forecast, by region
5.6.3.Market analysis, by country
CHAPTER 6:POLYOLEFINS MARKET, BY REGION
6.1.Overview
6.1.1.Market size and forecast
6.2.North America
6.2.1.Key market trends, growth factors, and opportunities
6.2.2.Market size and forecast, by type
6.2.3.Market size and forecast, by application
6.2.4.Market size and forecast, by country
6.2.5.U.S.
6.2.5.1.Market size and forecast, by type
6.2.5.2.Market size and forecast, by application
6.2.6.Canada
6.2.6.1.Market size and forecast, by type
6.2.6.2.Market size and forecast, by application
6.2.7.Mexico
6.2.7.1.Market size and forecast, by type
6.2.7.2.Market size and forecast, by application
6.3.Europe
6.3.1.Key market trends, growth factors, and opportunities
6.3.2.Market size and forecast, by type
6.3.3.Market size and forecast, by application
6.3.4.Market size and forecast, by country
6.3.5.Germany
6.3.5.1.Market size and forecast, by type
6.3.5.2.Market size and forecast, by application
6.3.6.UK
6.3.6.1.Market size and forecast, by type
6.3.6.2.Market size and forecast, by application
6.3.7.France
6.3.7.1.Market size and forecast, by type
6.3.7.2.Market size and forecast, by application
6.3.8.Italy
6.3.8.1.Market size and forecast, by type
6.3.8.2.Market size and forecast, by application
6.3.9.Spain
6.3.9.1.Market size and forecast, by type
6.3.9.2.Market size and forecast, by application
6.3.10.Rest of Europe
6.3.10.1.Market size and forecast, by type
6.3.10.2.Market size and forecast, by application
6.4.Asia-Pacific
6.4.1.Key market trends, growth factors, and opportunities
6.4.2.Market size and forecast, by type
6.4.3.Market size and forecast, by application
6.4.4.Market size and forecast, by country
6.4.4.1.China
6.4.4.1.1.Market size and forecast, by type
6.4.4.1.2.Market size and forecast, by application
6.4.4.2.Japan
6.4.4.2.1.Market size and forecast, by type
6.4.4.2.2.Market size and forecast, by application
6.4.4.3.India
6.4.4.3.1.Market size and forecast, by type
6.4.4.3.2.Market size and forecast, by application
6.4.4.4.Australia
6.4.4.4.1.Market size and forecast, by type
6.4.4.4.2.Market size and forecast, by application
6.4.4.5.South Korea
6.4.4.5.1.Market size and forecast, by type
6.4.4.5.2.Market size and forecast, by application
6.4.4.6.Rest of Asia-Pacific
6.4.4.6.1.Market size and forecast, by type
6.4.4.6.2.Market size and forecast, by application
6.5.LAMEA
6.5.1.Key market trends, growth factors, and opportunities
6.5.2.Market size and forecast, by type
6.5.3.Market size and forecast, by application
6.5.4.Market size and forecast, by country
6.5.4.1.Brazil
6.5.4.1.1.Market size and forecast, by type
6.5.4.1.2.Market size and forecast, by application
6.5.4.2.UAE
6.5.4.2.1.Market size and forecast, by type
6.5.4.2.2.Market size and forecast, by application
6.5.4.3.South Africa
6.5.4.3.1.Market size and forecast, by type
6.5.4.3.2.Market size and forecast, by application
6.5.4.4.Rest of LAMEA
6.5.4.4.1.Market size and forecast, by type
6.5.4.4.2.Market size and forecast, by application
CHAPTER 7:COMPETITIVE LANDSCAPE
7.1.Introduction
7.1.1.Market player positioning, 2020
7.2.Competitive heatmap
7.3.Product mapping of top 10 player
7.4.Key developments
7.4.1.New product launches
7.4.2.Business Expansion
7.4.3.Joint Venture
7.4.4.Partnership
CHAPTER 8:COMPANY PROFILES
8.1.EXXONMOBIL CORPORATION
8.1.1.Company overview
8.1.2.Key executive
8.1.3.Company snapshot
8.1.4.Operating business segments
8.1.5.Product portfolio
8.1.6.R&D expenditure
8.1.7.Business performance
8.1.8.Key strategic moves and developments
8.2.SABIC
8.2.1.Company overview
8.2.2.*Key executive
8.2.3.Company snapshot
8.2.4.Operating business segments
8.2.5.Product portfolio
8.2.6.Business performance
8.2.7.Key strategic moves and developments
8.3.TOTAL SE
8.3.1.Company overview
8.3.2.Key executives
8.3.3.Company snapshot
8.3.4.Operating business segments
8.3.5.Product portfolio
8.3.6.R&D expenditure
8.3.7.Business performance
8.4.REPSOL
8.4.1.Company overview
8.4.2.Key executive
8.4.3.Company snapshot
8.4.4.Product portfolio
8.4.5.R&D expenditure
8.4.6.Business performance
8.4.7.Key strategic moves and developments
8.5.INEOS GROUP AG
8.5.1.Company overview
8.5.2.Key executive
8.5.3.Company snapshot
8.5.4.Operating business segments
8.5.5.Product portfolio
8.5.6.R&D expenditure
8.5.7.Business performance
8.5.8.Key strategic moves and developments
8.6.RELIANCE INDUSTRIES
8.6.1.Company overview
8.6.2.Key executives
8.6.3.Company snapshot
8.6.4.Operating business segments
8.6.5.Product portfolio
8.6.6.R&D expenditure
8.6.7.Business performance
8.6.8.Key strategic moves and developments
8.7.LYONDELLBASELL INDUSTRIES N.V.
8.7.1.Company overview
8.7.2.Key executive
8.7.3.Company snapshot
8.7.4.Operating business segments
8.7.5.Product portfolio
8.7.6.R&D expenditure
8.7.7.Business performance
8.7.8.Key strategic moves and developments
8.8.SINOPEC GROUP
8.8.1.Company overview
8.8.2.Key executives
8.8.3.Company snapshot
8.8.4.Product portfolio
8.8.5.R&D expenditure
8.8.6.Business performance
8.9.DUCOR PETROCHEMICAL
8.9.1.Company overview
8.9.2.Key executive
8.9.3.Company snapshot
8.9.4.Operating business segments
8.9.5.Product portfolio
8.10.FORMOSA PLASTICS CORPORATION
8.10.1.Company overview
8.10.2.Key executive
8.10.3.Company snapshot
8.10.4.Product portfolio
8.10.5.Key strategic moves and developments
LIST OF TABLES
TABLE 01.GLOBAL POLYOLEFINS MARKET, BY TYPE, 2020-2028 (KILOTON)
TABLE 02.GLOBAL POLYOLEFINS MARKET, BY TYPE, 2020–2028 ($MILLION)
TABLE 03.POLYETHYLENE MARKET, BY REGION, 2020-2028 (KILOTON)
TABLE 04.POLYETHYLENE MARKET, BY REGION, 2020–2028 ($MILLION)
TABLE 05.POLYPROPYLENE MARKET, BY REGION, 2020-2028 (KILOTON)
TABLE 06.POLYPROPYLENE MARKET, BY REGION, 2020-2028 ($MILLION)
TABLE 07.POLYSTYRENE MARKET, BY REGION, 2020-2028 (KILOTON)
TABLE 08.POLYSTYRENE MARKET, BY REGION, 2020-2028 ($MILLION)
TABLE 09.GLOBAL POLYOLEFINS MARKET, BY APPLICATION, 2020–2028 (KILOTON)
TABLE 10.GLOBAL POLYOLEFINS MARKET, BY APPLICATION, 2020–2028 ($MILLION)
TABLE 11.POLYOLEFINS MARKET FOR FILM & SHEET, BY REGION, 2020-2028 (KILOTON)
TABLE 12.POLYOLEFINS MARKET FOR FILM & SHEET, BY REGION, 2020-2028 ($MILLION)
TABLE 13.POLYOLEFINS MARKET FOR INJECTION MOLDING, BY REGION, 2020-2028 (KILOTON)
TABLE 14.POLYOLEFINS MARKET FOR INJECTION MOLDING, BY REGION, 2020-2028 ($MILLION)
TABLE 15.POLYOLEFINS MARKET FOR BLOW MOLDING, BY REGION, 2020-2028 (KILOTON)
TABLE 16.POLYOLEFINS MARKET FOR BLOW MOLDING, BY REGION, 2020-2028 ($MILLION)
TABLE 17.POLYOLEFINS MARKET FOR PROFILE EXTRUSION, BY REGION, 2020-2028 (KILOTON)
TABLE 18.POLYOLEFINS MARKET FOR PROFILE EXTRUSION, BY REGION, 2020-2028 ($MILLION)
TABLE 19.POLYOLEFINS MARKET FOR OTHERS, BY REGION, 2020-2028 (KILOTON)
TABLE 20.POLYOLEFINS MARKET FOR OTHERS, BY REGION, 2020-2028 ($MILLION)
TABLE 21.POLYOLEFINS MARKET, BY REGION, 2020-2028 (KILOTON)
TABLE 22.POLYOLEFINS MARKET, BY REGION, 2020-2028 ($MILLION)
TABLE 23.NORTH AMERICA POLYOLEFINS MARKET, BY TYPE, 2020-2028 (KILOTON)
TABLE 24.NORTH AMERICA POLYOLEFINS MARKET, BY TYPE, 2020-2028 ($MILLION)
TABLE 25.NORTH AMERICA POLYOLEFINS MARKET, BY APPLICATION, 2020-2028 (KILOTON)
TABLE 26.NORTH AMERICAPOLYOLEFINS MARKET, BY APPLICATION, 2020-2028 ($MILLION)
TABLE 27.NORTH AMERICA POLYOLEFINS MARKET, BY COUNTRY, 2020-2028(KILOTON)
TABLE 28.NORTH AMERICA POLYOLEFINS MARKET, BY COUNTRY, 2020-2028 ($MILLION)
TABLE 29.U.S. POLYOLEFINS MARKET, BY TYPE, 2020-2028 (KILOTON)
TABLE 30.U.S. POLYOLEFINS MARKET, BY TYPE, 2020-2028 ($MILLION)
TABLE 31.U.S. POLYOLEFINS MARKET, BY APPLICATION, 2020-2028 (KILOTON)
TABLE 32.U.S. POLYOLEFINS MARKET, BY APPLICATION, 2020-2028 ($MILLION)
TABLE 33.CANADA POLYOLEFINS MARKET, BY TYPE, 2020-2028 (KILOTON)
TABLE 34.CANADA POLYOLEFINS MARKET, BY TYPE, 2020-2028 ($MILLION)
TABLE 35.CANADA POLYOLEFINS MARKET, BY APPLICATION, 2020-2028 (KILOTON)
TABLE 36.CANADA POLYOLEFINS MARKET, BY APPLICATION, 2020-2028 ($MILLION)
TABLE 37.MEXICO POLYOLEFINS MARKET, BY TYPE, 2020-2028 (KILOTON)
TABLE 38.MEXICO POLYOLEFINS MARKET, BY TYPE, 2020-2028 ($MILLION)
TABLE 39.MEXICO POLYOLEFINS MARKET, BY APPLICATION, 2020-2028 (KILOTON)
TABLE 40.MEXICO POLYOLEFINS MARKET, BY APPLICATION, 2020-2028 ($MILLION)
TABLE 41.EUROPE POLYOLEFINS MARKET, BY TYPE, 2020-2028 (KILOTON)
TABLE 42.EUROPE POLYOLEFINS MARKET, BY TYPE, 2020-2028 ($MILLION)
TABLE 43.EUROPE POLYOLEFINS MARKET, BY APPLICATION, 2020-2028 (KILOTON)
TABLE 44.EUROPE POLYOLEFINS MARKET, BY APPLICATION, 2020-2028 ($MILLION)
TABLE 45.EUROPE POLYOLEFINS MARKET, BY COUNTRY, 2020-2028 (KILOTON)
TABLE 46.EUROPE POLYOLEFINS MARKET, BY COUNTRY, 2020-2028 ($MILLION)
TABLE 47.GERMANY POLYOLEFINS MARKET, BY TYPE, 2020-2028 (KILOTON)
TABLE 48.GERMANY POLYOLEFINS MARKET, BY TYPE, 2020-2028 ($MILLION)
TABLE 49.GERMANY POLYOLEFINS MARKET, BY APPLICATION, 2020-2028 (KILOTON)
TABLE 50.GERMANY POLYOLEFINS MARKET, BY APPLICATION, 2020-2028 ($MILLION)
TABLE 51.UK POLYOLEFINS MARKET, BY TYPE, 2020-2028 (KILOTON)
TABLE 52.UK POLYOLEFINS MARKET, BY TYPE, 2020-2028 ($MILLION)
TABLE 53.UK POLYOLEFINS MARKET, BY APPLICATION, 2020-2028 (KILOTON)
TABLE 54.UK POLYOLEFINS MARKET, BY APPLICATION, 2020-2028 ($MILLION)
TABLE 55.FRANCE POLYOLEFINS MARKET, BY TYPE, 2020-2028 (KILOTON)
TABLE 56.FRANCE POLYOLEFINS MARKET, BY TYPE, 2020-2028 ($MILLION)
TABLE 57.FRANCE POLYOLEFINS MARKET, BY APPLICATION, 2020-2028 (KILOTON)
TABLE 58.FRANCE POLYOLEFINS MARKET, BY APPLICATION, 2020-2028 ($MILLION)
TABLE 59.ITALY POLYOLEFINS MARKET, BY TYPE, 2020-2028 (KILOTON)
TABLE 60.ITALY POLYOLEFINS MARKET, BY TYPE, 2020-2028 ($MILLION)
TABLE 61.ITALY POLYOLEFINS MARKET, BY APPLICATION, 2020-2028 (KILOTON)
TABLE 62.ITALY POLYOLEFINS MARKET, BY APPLICATION, 2020-2028 ($MILLION)
TABLE 63.SPAIN POLYOLEFINS MARKET, BY TYPE, 2020-2028 (KILOTON)
TABLE 64.SPAIN POLYOLEFINS MARKET, BY TYPE, 2020-2028 ($MILLION)
TABLE 65.SPAIN POLYOLEFINS MARKET, BY APPLICATION, 2020-2028 (KILOTON)
TABLE 66.SPAIN POLYOLEFINS MARKET, BY APPLICATION, 2020-2028 ($MILLION)
TABLE 67.REST OF EUROPE POLYOLEFINS MARKET, BY TYPE, 2020-2028 (KILOTON)
TABLE 68.REST OF EUROPE POLYOLEFINS MARKET, BY TYPE, 2020-2028 ($MILLION)
TABLE 69.REST OF EUROPE POLYOLEFINS MARKET, BY APPLICATION, 2020-2028 (KILOTON)
TABLE 70.REST OF EUROPE POLYOLEFINS MARKET, BY APPLICATION, 2020-2028 ($MILLION)
TABLE 71.ASIA-PACIFIC POLYOLEFINS MARKET, BY TYPE, 2020-2028 (KILOTON)
TABLE 72.ASIA-PACIFIC POLYOLEFINS MARKET, BY TYPE, 2020-2028 ($MILLION)
TABLE 73.ASIA-PACIFIC POLYOLEFINS MARKET, BY APPLICATION, 2020-2028 (KILOTON)
TABLE 74.ASIA-PACIFIC POLYOLEFINS MARKET, BY APPLICATION, 2020-2028 ($MILLION)
TABLE 75.ASIA-PACIFIC POLYOLEFINS MARKET, BY COUNTRY, 2020-2028(KILOTON)
TABLE 76.ASIA-PACIFICPOLYOLEFINS MARKET, BY COUNTRY, 2020-2028 ($MILLION)
TABLE 77.CHINA POLYOLEFINS MARKET, BY TYPE, 2020-2028 (KILOTON)
TABLE 78.CHINA POLYOLEFINS MARKET, BY TYPE, 2020-2028 ($MILLION)
TABLE 79.CHINA POLYOLEFINS MARKET, BY APPLICATION, 2020-2028 (KILOTON)
TABLE 80.CHINA POLYOLEFINS MARKET, BY APPLICATION, 2020-2028 ($MILLION)
TABLE 81.JAPAN POLYOLEFINS MARKET, BY TYPE, 2020-2028 (KILOTON)
TABLE 82.JAPAN POLYOLEFINS MARKET, BY TYPE, 2020-2028 ($MILLION)
TABLE 83.JAPAN POLYOLEFINS MARKET, BY APPLICATION, 2020-2028 (KILOTON)
TABLE 84.JAPAN POLYOLEFINS MARKET, BY APPLICATION, 2020-2028 ($MILLION)
TABLE 85.INDIA POLYOLEFINS MARKET, BY TYPE, 2020-2028 (KILOTON)
TABLE 86.INDIA POLYOLEFINS MARKET, BY TYPE, 2020-2028 ($MILLION)
TABLE 87.INDIA POLYOLEFINS MARKET, BY APPLICATION, 2020-2028 (KILOTON)
TABLE 88.INDIA POLYOLEFINS MARKET, BY APPLICATION, 2020-2028 ($MILLION)
TABLE 89.AUSTRALIA POLYOLEFINS MARKET, BY TYPE, 2020-2028 (KILOTON)
TABLE 90.AUSTRALIA POLYOLEFINS MARKET, BY TYPE, 2020-2028 ($MILLION)
TABLE 91.AUSTRALIA POLYOLEFINS MARKET, BY APPLICATION, 2020-2028 (KILOTON)
TABLE 92.AUSTRALIA POLYOLEFINS MARKET, BY APPLICATION, 2020-2028 ($MILLION)
TABLE 93.SOUTH KOREA POLYOLEFINS MARKET, BY TYPE, 2020-2028 (KILOTON)
TABLE 94.SOUTH KOREA POLYOLEFINS MARKET, BY TYPE, 2020-2028 ($MILLION)
TABLE 95.SOUTH KOREA POLYOLEFINS MARKET, BY APPLICATION, 2020-2028 (KILOTON)
TABLE 96.SOUTH KOREA POLYOLEFINS MARKET, BY APPLICATION, 2020-2028 ($MILLION)
TABLE 97.REST OF ASIA-PACIFIC POLYOLEFINS MARKET, BY TYPE, 2020-2028 (KILOTON)
TABLE 98.REST OF ASIA-PACIFIC POLYOLEFINS MARKET, BY TYPE, 2020-2028 ($MILLION)
TABLE 99.REST OF ASIA-PACIFIC POLYOLEFINS MARKET, BY APPLICATION, 2020-2028 (KILOTON)
TABLE 100.REST OF ASIA-PACIFIC POLYOLEFINS MARKET, BY APPLICATION, 2020-2028 ($MILLION)
TABLE 101.LAMEA POLYOLEFINS MARKET, BY TYPE, 2020-2028 (KILOTON)
TABLE 102.LAMEA POLYOLEFINS MARKET, BY TYPE, 2020-2028 ($MILLION)
TABLE 103.LAMEA POLYOLEFINS MARKET, BY APPLICATION, 2020-2028 (KILOTON)
TABLE 104.LAMEA POLYOLEFINS MARKET, BY APPLICATION, 2020-2028 ($MILLION)
TABLE 105.LAMEA POLYOLEFINS MARKET, BY COUNTRY, 2020-2028(KILOTON)
TABLE 106.LAMEA POLYOLEFINS MARKET, BY COUNTRY, 2020-2028 ($MILLION)
TABLE 107.BRAZIL POLYOLEFINS MARKET, BY TYPE, 2020-2028 (KILOTON)
TABLE 108.BRAZIL POLYOLEFINS MARKET, BY TYPE, 2020-2028 ($MILLION)
TABLE 109.BRAZIL POLYOLEFINS MARKET, BY APPLICATION, 2020-2028 (KILOTON)
TABLE 110.BRAZIL POLYOLEFINS MARKET, BY APPLICATION, 2020-2028 ($MILLION)
TABLE 111.UAE POLYOLEFINS MARKET, BY TYPE, 2020-2028 (KILOTON)
TABLE 112.UAE POLYOLEFINS MARKET, BY TYPE, 2020-2028 ($MILLION)
TABLE 113.UAE POLYOLEFINS MARKET, BY APPLICATION, 2020-2028 (KILOTON)
TABLE 114.UAE POLYOLEFINS MARKET, BY APPLICATION, 2020-2028 ($MILLION)
TABLE 115.SOUTH AFRICA POLYOLEFINS MARKET, BY TYPE, 2020-2028 (KILOTON)
TABLE 116.SOUTH AFRICA POLYOLEFINS MARKET, BY TYPE, 2020-2028 ($MILLION)
TABLE 117.SOUTH AFRICA POLYOLEFINS MARKET, BY APPLICATION, 2020-2028 (KILOTON)
TABLE 118.SOUTH AFRICA POLYOLEFINS MARKET, BY APPLICATION, 2020-2028 ($MILLION)
TABLE 119.REST OF LAMEA POLYOLEFINS MARKET, BY TYPE, 2020-2028 (KILOTON)
TABLE 120.REST OF LAMEA POLYOLEFINS MARKET, BY TYPE, 2020-2028 ($MILLION)
TABLE 121.REST OF LAMEA POLYOLEFINS MARKET, BY APPLICATION, 2020-2028 (KILOTON)
TABLE 122.REST OF LAMEA POLYOLEFINS MARKET, BY APPLICATION, 2020-2028 ($MILLION)
TABLE 123.KEY NEW PRODUCT LAUNCHES (2017-2020)
TABLE 124.KEY BUSINESS EXPANSION (2016-2019)
TABLE 125.KEY JOINT VENTURE (2021)
TABLE 126.KEY PARTNERSHIP (2019)
TABLE 127.EXXONMOBIL CORPORATION : KEY EXECUTIVES
TABLE 128.EXXONMOBIL CORPORATION : COMPANY SNAPSHOT
TABLE 129.EXXONMOBIL CORPORATION : OPERATING SEGMENTS
TABLE 130.EXXONMOBIL CORPORATION : PRODUCT PORTFOLIO
TABLE 131.EXXONMOBIL CORPORATION : R&D EXPENDITURE, 2018–2020 ($MILLION)
TABLE 132.EXXONMOBIL CORPORATION: NET SALES, 2018–2020 ($MILLION)
TABLE 133.EXXONMOBIL CORPORATION: KEY STRATEGIC MOVES AND DEVELOPMENTS
TABLE 134.SABIC: KEY EXECUTIVES
TABLE 135.SABIC: COMPANY SNAPSHOT
TABLE 136.SABIC: OPERATING SEGMENTS
TABLE 137.SABIC: PRODUCT PORTFOLIO
TABLE 138.SABIC: NET SALES, 2018–2020($MILLION)
TABLE 139.SABIC: KEY STRATEGIC MOVES AND DEVELOPMENTS
TABLE 140.TOTAL SE: KEY EXECUTIVES
TABLE 141.TOTAL SE: COMPANY SNAPSHOT
TABLE 142.TOTAL SE : OPERATING SEGMENTS
TABLE 143.TOTAL SE: PRODUCT PORTFOLIO
TABLE 144.TOTAL SE: R&D EXPENDITURE, 2018–2020 ($MILLION)
TABLE 145.TOTAL SE: NET SALES, 2018–2020($MILLION)
TABLE 146.REPSOL: KEY EXECUTIVES
TABLE 147.REPSOL: COMPANY SNAPSHOT
TABLE 148.REPSOL: PRODUCT PORTFOLIO
TABLE 149.REPSOL: R&D EXPENDITURE, 2018–2020 ($MILLION)
TABLE 150.REPSOL: NET SALES, 2018–2020($MILLION)
TABLE 151.REPSOL: KEY STRATEGIC MOVES AND DEVELOPMENTS
TABLE 152.INEOS: KEY EXECUTIVES
TABLE 153.INEOS: COMPANY SNAPSHOT
TABLE 154.INEOS : OPERATING SEGMENTS
TABLE 155.INEOS : PRODUCT PORTFOLIO
TABLE 156.INEOS : R&D EXPENDITURE, 2017–2019 ($MILLION)
TABLE 157.INEOS : NET SALES, 2017–2019 ($MILLION)
TABLE 158.INEOS: KEY STRATEGIC MOVES AND DEVELOPMENTS
TABLE 159.RELIANCE INDUSTRIES: KEY EXECUTIVES
TABLE 160.RELIANCE INDUSTRIES: COMPANY SNAPSHOT
TABLE 161.RELIANCE: OPERATING SEGMENTS
TABLE 162.RELIANCE : PRODUCT PORTFOLIO
TABLE 163.RELIANCE: R&D EXPENDITURE, 2018–2020 ($MILLION)
TABLE 164.RELIANCE: NET SALES, 2018–2020 ($MILLION)
TABLE 165.RELIANCE: KEY STRATEGIC MOVES AND DEVELOPMENTS
TABLE 166.LYONDELLBASELL: KEY EXECUTIVES
TABLE 167.LYONDELLBASELL: COMPANY SNAPSHOT
TABLE 168.LYONDELLBASELL: OPERATING SEGMENTS
TABLE 169.LYONDELLBASELL: PRODUCT PORTFOLIO
TABLE 170.LYONDELLBASELL: R&D EXPENDITURE, 2017–2019 ($MILLION)
TABLE 171.LYONDELLBASELL: NET SALES, 2017–2019 ($MILLION)
TABLE 172.LYONDELLBASELL: KEY STRATEGIC MOVES AND DEVELOPMENTS
TABLE 173.SINOPEC GROUP: KEY EXECUTIVES
TABLE 174.SINOPEC GROUP: COMPANY SNAPSHOT
TABLE 175.SINOPEC GROUP: PRODUCT PORTFOLIO
TABLE 176.LYONDELLBASELL: R&D EXPENDITURE, 2017–2019 ($MILLION)
TABLE 177.SINOPE : NET SALES, 2017–2019 ($MILLION)
TABLE 178.DUCOR: KEY EXECUTIVES
TABLE 179.DUCOR: COMPANY SNAPSHOT
TABLE 180.DUCOR: OPERATING SEGMENTS
TABLE 181.DUCOR: PRODUCT PORTFOLIO
TABLE 182.FORMOSA: KEY EXECUTIVES
TABLE 183.FORMOSA: COMPANY SNAPSHOT
TABLE 184.FORMOSA: PRODUCT PORTFOLIO
TABLE 185.FORMOSA: KEY STRATEGIC MOVES AND DEVELOPMENTS
LIST OF FIGURES
FIGURE 01.KEY MARKET SEGMENTS
FIGURE 02.GLOBAL POLYOLEFINS MARKET SNAPSHOT, BY SEGMENTION,2021–2028
FIGURE 03.POLYOLEFINS MARKET SNAPSHOT, BY REGION, 2021–2028
FIGURE 04.TOP INVESTMENT POCKETS, BY COUNTRY
FIGURE 05.HIGH BARGAINING POWER OF SUPPLIERS
FIGURE 06.HIGH BARGAINING POWER OF BUYERS
FIGURE 07.LOW THREAT OF NEW ENTRANTS
FIGURE 08.HIGH THREAT OF SUBSTITUTES
FIGURE 09.HIGH INTENSITY OF RIVALRY
FIGURE 10.GLOBAL POLYOLEFINS MARKET DYNAMICS
FIGURE 11.POLYOLEFINS MARKET: VALUE CHAIN
FIGURE 12.PRICING ANALYSIS, BY TYPE, 2020–2028
FIGURE 13.PRICING ANALYSIS, BY REGION, 2020–2028
FIGURE 14.PATENT ANALYSIS, BY COUNTRY
FIGURE 15.GLOBAL POLYOLEFINS MARKET, BY TYPE, 2020–2028 ($MILLION)
FIGURE 16.COMPARATIVE SHARE ANALYSIS OF OMPARATIVE SHARE ANALYSIS OF POLYETHYLENE MARKET, BY COUNTRY, 2020 & 2028 ($MILLION)
FIGURE 17.COMPARATIVE SHARE ANALYSIS OF POLYPROPYLENE MARKET, BY COUNTRY, 2020 & 2028 ($MILLION)
FIGURE 18.COMPARATIVE SHARE ANALYSIS OF POLYSTYRENE MARKET, BY COUNTRY, 2020 & 2028 ($MILLION)
FIGURE 19.GLOBAL POLYOLEFINS MARKET, BY APPLICATION, 2020–2028 ($MILLION)
FIGURE 20.COMPARATIVE SHARE ANALYSIS OF POLYOLEFINS MARKET FOR FILM & SHEET, BY COUNTRY, 2020 & 2028 ($MILLION)
FIGURE 21.COMPARATIVE SHARE ANALYSIS OF POLYOLEFINS MARKET FOR INJECTION MOLDING, BY COUNTRY, 2020 & 2028 ($MILLION)
FIGURE 22.COMPARATIVE SHARE ANALYSIS OF POLYOLEFINS MARKET FOR BLOW MOLDING, BY COUNTRY, 2020 & 2028 ($MILLION)
FIGURE 23.COMPARATIVE SHARE ANALYSIS OF POLYOLEFINS MARKET FOR PROFILE EXTRUSION, BY COUNTRY, 2020 & 2028 ($MILLION)
FIGURE 24.COMPARATIVE SHARE ANALYSIS OF POLYOLEFINS MARKET FOR OTHERS, BY COUNTRY, 2020 & 2028 ($MILLION)
FIGURE 25.U.S. POLYOLEFINS MARKET REVENUE, 2020-2028 ($MILLION)
FIGURE 26.CANADAPOLYOLEFINS MARKET REVENUE, 2020-2028 ($MILLION)
FIGURE 27.MEXICO POLYOLEFINS MARKET REVENUE, 2020-2028 ($MILLION)
FIGURE 28.GERMANY POLYOLEFINS MARKET REVENUE, 2020-2028 ($MILLION)
FIGURE 29.UKPOLYOLEFINS MARKET REVENUE, 2020-2028 ($MILLION)
FIGURE 30.FRANCE POLYOLEFINS MARKET REVENUE, 2020-2028 ($MILLION)
FIGURE 31.ITALY POLYOLEFINS MARKET REVENUE, 2020-2028 ($MILLION)
FIGURE 32.SPAIN POLYOLEFINS MARKET REVENUE, 2020-2028 ($MILLION)
FIGURE 33.REST OF EUROPE POLYOLEFINS MARKET REVENUE, 2020-2028 ($MILLION)
FIGURE 34.CHINA POLYOLEFINS MARKET REVENUE, 2020-2028 ($MILLION)
FIGURE 35.JAPANPOLYOLEFINS MARKET REVENUE, 2020-2028 ($MILLION)
FIGURE 36.INDIA POLYOLEFINS MARKET REVENUE, 2020-2028 ($MILLION)
FIGURE 37.AUSTRALIA POLYOLEFINS MARKET REVENUE, 2020-2028 ($MILLION)
FIGURE 38.SOUTH KOREA POLYOLEFINS MARKET REVENUE, 2020-2028 ($MILLION)
FIGURE 39.REST OF ASIA-PACIFIC POLYOLEFINS MARKET REVENUE, 2020-2028 ($MILLION)
FIGURE 40.BRAZIL POLYOLEFINS MARKET REVENUE, 2020-2028 ($MILLION)
FIGURE 41.UAE POLYOLEFINS MARKET REVENUE, 2020-2028 ($MILLION)
FIGURE 42.SOUTH AFRICAPOLYOLEFINS MARKET REVENUE, 2020-2028 ($MILLION)
FIGURE 43.REST OF LAMEA POLYOLEFINS MARKET REVENUE, 2020-2028 ($MILLION)
FIGURE 44.MARKET PLAYER POSITIONING, 2020
FIGURE 45.COMPETITIVE HEATMAP
FIGURE 46.RODUCT MAPPING OF TOP 10 PLAYERS
FIGURE 47.EXXONMOBIL CORPORATION : R&D EXPENDITURE, 2018–2020 ($MILLION)
FIGURE 48.EXXONMOBIL CORPORATION : NET SALES, 2018–2020 ($MILLION)
FIGURE 49.EXXONMOBIL CORPORATION: REVENUE SHARE BY SEGMENT, 2020 (%)
FIGURE 50.EXXONMOBIL CORPORATION: REVENUE SHARE BY REGION, 2020(%)
FIGURE 51.SABIC: NET SALES, 2018–2020 ($MILLION)
FIGURE 52.SABIC: REVENUE SHARE BY SEGMENT, 2020 (%)
FIGURE 53.SABIC: REVENUE SHARE BY REGION, 2020 (%)
FIGURE 54.TOTAL SE: R&D EXPENDITURE, 2018–2020 ($MILLION)
FIGURE 55.TOTAL SE: NET SALES, 2018–2020 ($MILLION)
FIGURE 56.TOTAL SE: REVENUE SHARE BY SEGMENT, 2020 (%)
FIGURE 57.TOTAL SE: REVENUE SHARE BY REGION, 2020 (%)
FIGURE 58.REPSOL: R&D EXPENDITURE, 2018–2020 ($MILLION)
FIGURE 59.REPSOL: NET SALES, 2018–2020 ($MILLION)
FIGURE 60.REPSOL: REVENUE SHARE BY SEGMENT, 2020 (%)
FIGURE 61.REPSOL: REVENUE SHARE BY REGION, 2020 (%)
FIGURE 62.INEOS : R&D EXPENDITURE, 2017–2019 ($MILLION)
FIGURE 63.INEOS : NET SALES, 2017–2019 ($MILLION)
FIGURE 64.INEOS: REVENUE SHARE BY SEGMENT, 2019 (%)
FIGURE 65.INEOS: REVENUE SHARE BY REGION, 2019 (%)
FIGURE 66.INEOS: REVENUE SHARE BY CUSTOMER LOCATION, 2019 (%)
FIGURE 67.RELIANCE: R&D EXPENDITURE, 2018–2020 ($MILLION)
FIGURE 68.RELIANCE: NET SALES, 2018–2020 ($MILLION)
FIGURE 69.RELIANCE: REVENUE SHARE BY SEGMENT, 2020 (%)
FIGURE 70.RELIANCE: REVENUE SHARE BY REGION, 2020 (%)
FIGURE 71.LYONDELLBASELL: R&D EXPENDITURE, 2017–2019 ($MILLION)
FIGURE 72.LYONDELLBASELL: NET SALES, 2017–2019 ($MILLION)
FIGURE 73.LYONDELLBASELL: REVENUE SHARE BY SEGMENT, 2019 (%)
FIGURE 74.LYONDELLBASELL: REVENUE SHARE BY PRODUCT, 2019 (%)
FIGURE 75.LYONDELLBASELL: REVENUE SHARE BY REGION, 2019 (%)
FIGURE 76.SINOPEC: R&D EXPENDITURE, 2017–2019($MILLION)
FIGURE 77.SINOPEC: NET SALES, 2017–2019 ($MILLION)
FIGURE 78.SINOPEC: REVENUE SHARE BY SEGMENT, 2019 (%)
FIGURE 79.SINOPEC: REVENUE SHARE BY REGION, 2019 (%)
$5769
$6450
$9995
HAVE A QUERY?
OUR CUSTOMER

SIMILAR REPORTS