
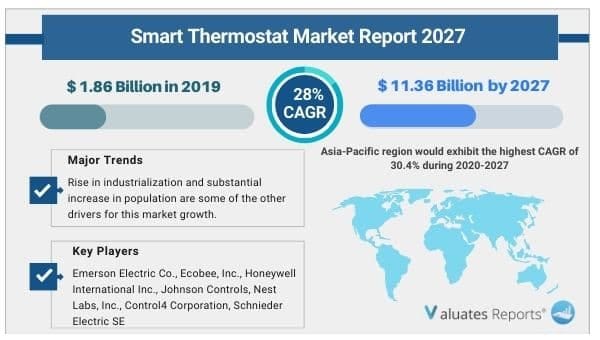
The global smart thermostat market size was valued at USD 1.86 Billion in 2019, and is projected to reach USD 11.36 Billion by 2027, registering a CAGR of 28.00% from 2020 to 2027.
Smart thermostats are devices designed to automatically control ambience temperature and air conditioning. These smart devices provide users the benefit to control temperature throughout the day using a schedule. In addition, smart thermostat is integrated with sensors and smart-net technology such as Wi-Fi, which provides remote access to internet connected devices. Smart thermostat is used in smart infrastructure to control smart appliances such as window ACs, split ACs, portables ACs, heaters, radiators, and boilers.
Smart thermostat is popular for use in autonomous infrastructure. These devices can be programmed or scheduled as per user preferences, especially with set daily routines. Moreover, smart thermostats have self-learning capacity that adjusts temperature as per data captured in the past. These devices can be easily installed by consumers and are compatible with a wide range of smart electronic appliances.
The smart thermostat industry is expected to witness growth during the forecast period, owing to rapid development of smart infrastructure in residential and commercial sectors. The market for global smart thermostat is expected to be driven by surge in adoption of IoT and AI-based technologies thereby advancing programmable thermostats to smart ones. Moreover, increase in use of smart technology in medical monitoring is expected to boost demand for smart thermostats. Considering these factors, the global smart thermostat market is estimated to experience a steep growth in the future.
Rise in industrialization and substantial increase in population are some of the other drivers for the global smart thermostat market growth. However, high costs of smart thermostats in developing countries acts as a major challenge for the market growth. Furthermore, advancements in temperature regulation of appliances and adoption of automated systems provide lucrative opportunities for the global smart thermostat market.
Emergence of COVID-19 has declined growth rate of the market in 2020, and the market is estimated to witness relatively slow growth till the end of 2021. The market was primarily hit by several obstacles created amid the COVID-19 pandemic in the construction industry including availability of resources, health and safety measures, deliverables, contractual obligations, and project delays or cancellations. Consequently, it resulted in decreased demand for global smart thermostat industry.
Wi-Fi segment is projected as one of the most lucrative segments.
The smart thermostat market is analyzed by technology, application, and end user. On the basis of technology, it is fragmented into Wi-Fi, Bluetooth, Zigbee, and others. The Wi-Fi segment dominated the market, in terms of revenue in 2019, and is expected to follow the same trend during the forecast period. On the basis of application, the market is segregated into air conditioning, heating, and ventilation. By air conditioning, the market is further divided into split AC, window AC, and portable AC. The heating segment dominated the market, in terms of revenue in 2019, however, the air conditioning segment is projected to witness significant market share during the forecast period. By end user, the market is divided into residential, commercial, industrial, and others. The global smart thermostat market share of commercial segment accounted highest in 2019, and the residential segment is expected to grow at a high CAGR from 2020 to 2027.
By region, the smart thermostat market share is divided into North America, Europe, Asia-Pacific, and LAMEA. Asia-Pacific dominated the market, in terms of revenue in 2019, and is expected to follow the same trend during the forecast period. Adoption of smart phones and smart electronic appliances in residential, commercial, and industrial sectors is expected to propel the smart thermostat industry in this region. Owing to technological advancements, appliances in residential buildings, such as washing machines, heating, and cooling equipment, and refrigerators are increasingly becoming smart. This means that they can be connected to the internet. Hence, all such factors are anticipated to boost the market growth.
Air conditioning segment is expected to secure leading position during forecast period.
Top Impacting Factors
Significant factors that impact growth of the global smart thermostat industry include rapid adoption of smart infrastructure in residential & commercial sectors, surge in penetration of IoT and AI-based technologies, and increase in use of smart technology in medical monitoring. However, high cost of products in developing countries acts as a major barrier for early adoption, which hampers growth of the market. On the contrary, adoption of automated systems for temperature control in residential, commercial, and industrial sectors is anticipated to provide lucrative opportunities for smart thermostat market during the forecast period.
Competition Analysis
Competitive analysis and profiles of the major global smart thermostat market players such as Emerson Electric Co., Ecobee, Inc., Honeywell International Inc., Johnson Controls, Nest Labs, Inc., Control4 Corporation, Schnieder Electric SE, Tado GmbH, Nortek, Inc., and Ingersoll Rand plc are provided in this report. These key players have adopted strategies, such as product portfolio expansion, mergers & acquisitions, agreements, geographical expansion, and collaborations to enhance their position in the smart thermostat market.
Asia-Pacific region would exhibit the highest CAGR of 30.4% during 2020-2027
Chapter 1:Introduction
1.1.Report description
1.2.Key benefits for stakeholders
1.3.Key market segments
1.4.Research methodology
1.4.1.Primary research
1.4.2.Secondary research
1.4.3.Analyst tools and models
Chapter 2:Executive summary
2.1.Key findings
2.1.1.Top impacting factors
2.1.2.Top investment pockets
2.2.CXO perspective
Chapter 3:MARKET OVERVIEW
3.1.Market definition and scope
3.2.Porter’s five forces analysis
3.3.Market dynamics
3.3.1.Drivers
3.3.1.1.Rapid deployment of smart infrastructure in residential & commercial sectors
3.3.1.2.Upsurge in penetration of IoT and AI-based technologies
3.3.1.3.Increase in use of smart technology in medical monitoring
3.3.2.Restraints
3.3.2.1.High cost of products in developing countries
3.3.3.Opportunity
3.3.3.1.Advancements in temperature regulation appliances and adoption of automated systems
3.4.COVID Impact
3.4.1.Impact on market size
3.4.2.End user trends, preferences, and budget impact
3.4.3.Key player strategies to tackle negative impact
3.4.3.1.Limited investments for R&D
3.4.3.2.Focus on next-generation products
3.4.3.3.Shift toward agile supply chain model
Chapter 4:smart thermostat Market, By technology
4.1.Overview
4.2.Wi-Fi
4.2.1.Key market trends, growth factors, and opportunities
4.2.2.Market size and forecast, by region
4.2.3.Market analysis, by country
4.3.Bluetooth
4.3.1.Key market trends, growth factors, and opportunities
4.3.2.Market size and forecast, by region
4.3.3.Market analysis, by country
4.4.Zigbee
4.4.1.Key market trends, growth factors, and opportunities
4.4.2.Market size and forecast, by region
4.4.3.Market analysis, by country
4.5.Others
4.5.1.Key market trends, growth factors, and opportunities
4.5.2.Market size and forecast, by region
4.5.3.Market analysis, by country
Chapter 5:smart thermostat Market, BY application
5.1.Overview
5.2.Air conditioning
5.2.1.Key market trends, growth factors, and opportunities
5.2.2.Split AC
5.2.3.Window AC
5.2.4.Portable AC
5.2.5.Others
5.2.6.Market size and forecast, by region
5.2.7.Market analysis, by country
5.3.Heating
5.3.1.Key market trends, growth factors, and opportunities
5.3.2.Market size and forecast, by region
5.3.3.Market analysis, by country
5.4.Ventilation
5.4.1.Key market trends, growth factors, and opportunities
5.4.2.Market size and forecast, by region
5.4.3.Market analysis, by country
Chapter 6:smart thermostat Market, BY End User
6.1.Overview
6.2.Residential
6.2.1.Key market trends, growth factors, and opportunities
6.2.2.Market size and forecast, by region
6.2.3.Market analysis, by country
6.3.Commercial
6.3.1.Key market trends, growth factors, and opportunities
6.3.2.Market size and forecast, by region
6.3.3.Market analysis, by country
6.4.Industrial
6.4.1.Key market trends, growth factors, and opportunities
6.4.2.Market size and forecast, by region
6.4.3.Market analysis, by country
6.5.Others
6.5.1.Key market trends, growth factors, and opportunities
6.5.2.Market size and forecast, by region
6.5.3.Market analysis, by country
Chapter 7:smart thermostat Market, BY Region
7.1.Overview
7.2.North America
7.2.1.Key market trends, growth factors, and opportunities
7.2.2.Market size and forecast, by technology
7.2.3.Market size and forecast, by Application
7.2.4.Market size and forecast, by End User
7.2.5.Market analysis, by country
7.2.5.1.U.S.
7.2.5.1.1.Market size and forecast, by technology
7.2.5.1.2.Market size and forecast, by Application
7.2.5.1.3.Market size and forecast, by End User
7.2.5.2.Canada
7.2.5.2.1.Market size and forecast, by technology
7.2.5.2.2.Market size and forecast, by Application
7.2.5.2.3.Market size and forecast, by End User
7.2.5.3.Mexico
7.2.5.3.1.Market size and forecast, by technology
7.2.5.3.2.Market size and forecast, by Application
7.2.5.3.3.Market size and forecast, by End User
7.3.Europe
7.3.1.Key market trends, growth factors, and opportunities
7.3.2.Market size and forecast, by technology
7.3.3.Market size and forecast, by Application
7.3.4.Market size and forecast, by End User
7.3.5.Market analysis, by country
7.3.5.1.UK
7.3.5.1.1.Market size and forecast, by technology
7.3.5.1.2.Market size and forecast, by Application
7.3.5.1.3.Market size and forecast, by End User
7.3.5.2.Germany
7.3.5.2.1.Market size and forecast, by technology
7.3.5.2.2.Market size and forecast, by Application
7.3.5.2.3.Market size and forecast, by End User
7.3.5.3.Russia
7.3.5.3.1.Market size and forecast, by technology
7.3.5.3.2.Market size and forecast, by Application
7.3.5.3.3.Market size and forecast, by End User
7.3.5.4.France
7.3.5.4.1.Market size and forecast, by technology
7.3.5.4.2.Market size and forecast, by Application
7.3.5.4.3.Market size and forecast, by End User
7.3.5.5.Rest of Europe
7.3.5.5.1.Market size and forecast, by technology
7.3.5.5.2.Market size and forecast, by Application
7.3.5.5.3.Market size and forecast, by End User
7.4.Asia-Pacific
7.4.1.Key market trends, growth factors, and opportunities
7.4.2.Market size and forecast, by technology
7.4.3.Market size and forecast, by Application
7.4.4.Market size and forecast, by End User
7.4.5.Market analysis, by country
7.4.5.1.China
7.4.5.1.1.Market size and forecast, by technology
7.4.5.1.2.Market size and forecast, by Application
7.4.5.1.3.Market size and forecast, by End User
7.4.5.2.Japan
7.4.5.2.1.Market size and forecast, by technology
7.4.5.2.2.Market size and forecast, by Application
7.4.5.2.3.Market size and forecast, by End User
7.4.5.3.India
7.4.5.3.1.Market size and forecast, by technology
7.4.5.3.2.Market size and forecast, by Application
7.4.5.3.3.Market size and forecast, by End User
7.4.5.4.Australia
7.4.5.4.1.Market size and forecast, by technology
7.4.5.4.2.Market size and forecast, by Application
7.4.5.4.3.Market size and forecast, by End User
7.4.5.5.Rest of Asia-Pacific
7.4.5.5.1.Market size and forecast, by technology
7.4.5.5.2.Market size and forecast, by Application
7.4.5.5.3.Market size and forecast, by End User
7.5.LAMEA
7.5.1.Key market trends, growth factors, and opportunities
7.5.2.Market size and forecast, by technology
7.5.3.Market size and forecast, by Application
7.5.4.Market size and forecast, by End User
7.5.5.Market analysis, by country
7.5.5.1.Latin America
7.5.5.1.1.Market size and forecast, by technology
7.5.5.1.2.Market size and forecast, by Application
7.5.5.1.3.Market size and forecast, by End User
7.5.5.2.Middle East
7.5.5.2.1.Market size and forecast, by technology
7.5.5.2.2.Market size and forecast, by Application
7.5.5.2.3.Market size and forecast, by End User
7.5.5.3.Africa
7.5.5.3.1.Market size and forecast, by technology
7.5.5.3.2.Market size and forecast, by Application
7.5.5.3.3.Market size and forecast, by End User
Chapter 8:COMPETITIVE LANDSCAPE
8.1.INTRODUCTION
8.1.1.MARKET PLAYER POSITIONING, 2019
8.2.PRODUCT MAPPING OF TOP 10 PLAYER
8.3.COMPETITIVE DASHBOARD
8.4.COMPETITIVE HEATMAP
8.5.KEY DEVELOPMENTS
8.5.1.New Product Launches
8.5.2.Partnership
8.5.3.Other Developments
Chapter 9:COMPANY PROFILES
9.1.Alphabet Inc. (Nest Labs)
9.1.1.Company overview
9.1.2.Key Executives
9.1.3.Company snapshot
9.1.4.Operating business segments
9.1.5.Product portfolio
9.1.6.R&D Expenditure
9.1.7.Business performance
9.2.Ecobee
9.2.1.Company overview
9.2.2.Key Executives
9.2.3.Company snapshot
9.2.4.Operating business segments
9.2.5.Product portfolio
9.2.6.Key strategic moves and developments
9.3.Emerson Electric Co.
9.3.1.Company overview
9.3.2.Key Executives
9.3.3.Company snapshot
9.3.4.Operating business segments
9.3.5.Product portfolio
9.3.6.R&D Expenditure
9.3.7.Business performance
9.3.8.Key strategic moves and developments
9.4.Honeywell International Inc.
9.4.1.Company overview
9.4.2.Key Executives
9.4.3.Company snapshot
9.4.4.Operating business segments
9.4.5.Product portfolio
9.4.6.R&D Expenditure
9.4.7.Business performance
9.5.Johnson Controls
9.5.1.Company overview
9.5.2.Key Executives
9.5.3.Company snapshot
9.5.4.Operating business segments
9.5.5.Product portfolio
9.5.6.R&D Expenditure
9.5.7.Business performance
9.5.8.Key strategic moves and developments
9.6.Netatmo
9.6.1.Company overview
9.6.2.Key Executives
9.6.3.Company snapshot
9.6.4.Operating business segments
9.6.5.Product portfolio
9.6.6.R&D Expenditure
9.6.7.Business performance
9.6.8.Key strategic moves and developments
9.7.Schneider Electric
9.7.1.Company overview
9.7.2.Key Executives
9.7.3.Company snapshot
9.7.4.Operating business segments
9.7.5.Product portfolio
9.7.6.R&D Expenditure
9.7.7.Business performance
9.8.Siemens AG
9.8.1.Company overview
9.8.2.Key Executives
9.8.3.Company snapshot
9.8.4.Operating business segments
9.8.5.Product portfolio
9.8.6.R&D Expenditure
9.8.7.Business performance
9.9.Tado
9.9.1.Company overview
9.9.2.Key Executives
9.9.3.Company snapshot
9.9.4.Operating business segments
9.9.5.Product portfolio
9.9.6.Key strategic moves and developments
9.10.Zen Thermostat
9.10.1.Company overview
9.10.2.Key Executives
9.10.3.Company snapshot
9.10.4.Operating business segments
9.10.5.Product portfolio
LIST OF TABLES
TABLE 01.WI-FISMART THERMOSTATMARKET, BY REGION, 2019-2027 ($MILLION)
TABLE 02.BLUETOOTHSMART THERMOSTAT MARKET, BY REGION 2019-2027 ($MILLION)
TABLE 03.ZIGBEE SMART THERMOSTATMARKET, BY REGION 2019-2027 ($MILLION)
TABLE 04.OTHERSSMART THERMOSTATMARKET, BY REGION 2019-2027 ($MILLION)
TABLE 05.GLOBAL SMART THERMOSTAT MARKET, BY APPLICATION, 2019-2027($MILLION)
TABLE 06.SMART THERMOSTATMARKET FOR AIR CONDITIONING, BY REGION 2019-2027 ($MILLION)
TABLE 07.SMART THERMOSTATMARKET FOR HEATING, BY REGION 2019-2027 ($MILLION)
TABLE 08.SMART THERMOSTAT MARKET FOR VENTILATION, BY REGION 2019-2027 ($MILLION)
TABLE 09.GLOBAL SMART THERMOSTAT MARKET, BY END USER, 2019-2027($MILLION)
TABLE 10.SMART THERMOSTATMARKET FOR REIDENTIAL, BY REGION 2019-2027 ($MILLION)
TABLE 11.SMART THERMOSTATMARKET FOR COMMERCIAL, BY REGION 2019-2027 ($MILLION)
TABLE 12.SMART THERMOSTATMARKET FOR INDUSTRIAL, BY REGION 2019-2027 ($MILLION)
TABLE 13.SMART THERMOSTATMARKET FOR OTHERS, BY REGION 2019-2027 ($MILLION)
TABLE 14.SMART THERMOSTAT MARKET REVENUE, BY REGION, 2019–2027 ($MILLION)
TABLE 15.NORTH AMERICA SMART THERMOSTAT MARKET, BY TECHNOLOGY, 2019–2027 ($MILLION)
TABLE 16.NORTH AMERICA SMART THERMOSTAT MARKET, BY APPLICATION, 2019–2027 ($MILLION)
TABLE 17.NORTH AMERICA SMART THERMOSTAT MARKET, BY END USER, 2019–2027 ($MILLION)
TABLE 18.U.S. SMART THERMOSTAT MARKET, BY TECHNOLOGY, 2019–2027 ($MILLION)
TABLE 19.U.S. SMART THERMOSTAT MARKET, BY APPLICATION, 2019–2027 ($MILLION)
TABLE 20.U.S. SMART THERMOSTAT MARKET, BY END USER, 2019–2027 ($MILLION)
TABLE 21.CANADASMART THERMOSTAT MARKET, BY TECHNOLOGY, 2019–2027 ($MILLION)
TABLE 22.CANADASMART THERMOSTAT MARKET, BY APPLICATION, 2019–2027 ($MILLION)
TABLE 23.CANADASMART THERMOSTAT MARKET, BY END USER, 2019–2027 ($MILLION)
TABLE 24.MEXICOSMART THERMOSTAT MARKET, BY TECHNOLOGY, 2019–2027 ($MILLION)
TABLE 25.MEXICOSMART THERMOSTAT MARKET, BY APPLICATION, 2019–2027 ($MILLION)
TABLE 26.MEXICOSMART THERMOSTAT MARKET, BY END USER, 2019–2027 ($MILLION)
TABLE 27.EUROPESMART THERMOSTAT MARKET, BY TECHNOLOGY, 2019–2027 ($MILLION)
TABLE 28.EUROPESMART THERMOSTAT MARKET, BY APPLICATION, 2019–2027 ($MILLION)
TABLE 29.EUROPESMART THERMOSTAT MARKET, BY END USER, 2019–2027 ($MILLION)
TABLE 30.UK SMART THERMOSTAT MARKET, BY TECHNOLOGY, 2019–2027 ($MILLION)
TABLE 31.UK SMART THERMOSTAT MARKET, BY APPLICATION, 2019–2027 ($MILLION)
TABLE 32.UK SMART THERMOSTAT MARKET, BY END USER, 2019–2027 ($MILLION)
TABLE 33.GERMANY SMART THERMOSTAT MARKET, BY TECHNOLOGY, 2019–2027 ($MILLION)
TABLE 34.GERMANY SMART THERMOSTAT MARKET, BY APPLICATION, 2019–2027 ($MILLION)
TABLE 35.GERMANY SMART THERMOSTAT MARKET, BY END USER, 2019–2027 ($MILLION)
TABLE 36.RUSSIA SMART THERMOSTAT MARKET, BY TECHNOLOGY, 2019–2027 ($MILLION)
TABLE 37.RUSSIASMART THERMOSTAT MARKET, BY APPLICATION, 2019–2027 ($MILLION)
TABLE 38.RUSSIA SMART THERMOSTAT MARKET, BY END USER, 2019–2027 ($MILLION)
TABLE 39.FRANCE SMART THERMOSTAT MARKET, BY TECHNOLOGY, 2019–2027 ($MILLION)
TABLE 40.FRANCE SMART THERMOSTAT MARKET, BY APPLICATION, 2019–2027 ($MILLION)
TABLE 41.FRANCE SMART THERMOSTAT MARKET, BY END USER, 2019–2027 ($MILLION)
TABLE 42.REST OF EUROPE SMART THERMOSTAT MARKET, BY TECHNOLOGY, 2019–2027 ($MILLION)
TABLE 43.REST OF EUROPE SMART THERMOSTAT MARKET, BY APPLICATION, 2019–2027 ($MILLION)
TABLE 44.REST OF EUROPE SMART THERMOSTAT MARKET, BY END USER, 2019–2027 ($MILLION)
TABLE 45.ASIA-PACIFIC SMART THERMOSTAT MARKET, BY TECHNOLOGY, 2019–2027 ($MILLION)
TABLE 46.ASIA-PACIFIC SMART THERMOSTAT MARKET, BY APPLICATION, 2019–2027 ($MILLION)
TABLE 47.ASIA-PACIFIC SMART THERMOSTAT MARKET, BY END USER, 2019–2027 ($MILLION)
TABLE 48.CHINA SMART THERMOSTAT MARKET, BY TECHNOLOGY, 2019–2027 ($MILLION)
TABLE 49.CHINA SMART THERMOSTAT MARKET, BY APPLICATION, 2019–2027 ($MILLION)
TABLE 50.CHINA SMART THERMOSTAT MARKET, BY END USER, 2019–2027 ($MILLION)
TABLE 51.JAPAN SMART THERMOSTAT MARKET, BY TECHNOLOGY, 2019–2027 ($MILLION)
TABLE 52.JAPAN SMART THERMOSTAT MARKET, BY APPLICATION, 2019–2027 ($MILLION)
TABLE 53.JAPAN SMART THERMOSTAT MARKET, BY END USER, 2019–2027 ($MILLION)
TABLE 54.INDIA SMART THERMOSTAT MARKET, BY TECHNOLOGY, 2019–2027 ($MILLION)
TABLE 55.INDIA SMART THERMOSTAT MARKET, BY APPLICATION, 2019–2027 ($MILLION)
TABLE 56.INDIA SMART THERMOSTAT MARKET, BY END USER, 2019–2027 ($MILLION)
TABLE 57.AUSTRALIA SMART THERMOSTAT MARKET, BY TECHNOLOGY, 2019–2027 ($MILLION)
TABLE 58.AUSTRALIASMART THERMOSTAT MARKET, BY APPLICATION, 2019–2027 ($MILLION)
TABLE 59.AUSTRALIA SMART THERMOSTAT MARKET, BY END USER, 2019–2027 ($MILLION)
TABLE 60.REST OF ASIA-PACIFIC SMART THERMOSTAT MARKET, BY TECHNOLOGY, 2019–2027 ($MILLION)
TABLE 61.REST OF ASIA-PACIFIC SMART THERMOSTAT MARKET, BY APPLICATION, 2019–2027 ($MILLION)
TABLE 62.REST OF ASIA-PACIFIC SMART THERMOSTAT MARKET, BY END USER, 2019–2027 ($MILLION)
TABLE 63.LAMEA SMART THERMOSTAT MARKET, BY TECHNOLOGY, 2019–2027 ($MILLION)
TABLE 64.LAMEA SMART THERMOSTAT MARKET, BY APPLICATION, 2019–2027 ($MILLION)
TABLE 65.LAMEA SMART THERMOSTAT MARKET, BY END USER, 2019–2027 ($MILLION)
TABLE 66.LATIN AMERICA SMART THERMOSTAT MARKET, BY TECHNOLOGY, 2019–2027 ($MILLION)
TABLE 67.LATIN AMERICA SMART THERMOSTAT MARKET, BY APPLICATION, 2019–2027 ($MILLION)
TABLE 68.LATIN AMERICA SMART THERMOSTAT MARKET, BY END USER, 2019–2027 ($MILLION)
TABLE 69.MIDDLE EAST SMART THERMOSTAT MARKET, BY TECHNOLOGY, 2019–2027 ($MILLION)
TABLE 70.MIDDLE EAST SMART THERMOSTAT MARKET, BY APPLICATION, 2019–2027 ($MILLION)
TABLE 71.MIDDLE EAST SMART THERMOSTATMARKET, BY END USER, 2019–2027 ($MILLION)
TABLE 72.AFRICA SMART THERMOSTAT MARKET, BY TECHNOLOGY, 2019–2027 ($MILLION)
TABLE 73.AFRICA SMART THERMOSTAT MARKET, BY APPLICATION, 2019–2027 ($MILLION)
TABLE 74.AFRICA SMART THERMOSTAT MARKET, BY END USER, 2019–2027 ($MILLION)
TABLE 75.KEY NEW PRODUCT LAUNCHES (2019-2020)
TABLE 76.PARTNERSHIP (2019-2020)
TABLE 77.OTHER DEVELOPMENTS (2019 – 2020)
TABLE 78.ALPHABET INC.(NEST LABS): KEY EXECUTIVES
TABLE 79.ALPHABET INC.(NEST LABS): COMPANY SNAPSHOT
TABLE 80.ALPHABET INC.(NEST LABS): OPERATING SEGMENTS
TABLE 81.ALPHABET INC.(NEST LABS): PRODUCT PORTFOLIO
TABLE 82.ECOBEE: KEY EXECUTIVES
TABLE 83.ECOBEE: COMPANY SNAPSHOT
TABLE 84.ECOBEE: OPERATING SEGMENTS
TABLE 85.ECOBEE: PRODUCT PORTFOLIO
TABLE 86.ECOBEE: KEY STRATEGIC MOVES AND DEVELOPMENTS
TABLE 87.EMERSON ELECTRIC: KEY EXECUTIVES
TABLE 88.EMERSON ELECTRIC: COMPANY SNAPSHOT
TABLE 89.EMERSON ELECTRIC: OPERATING SEGMENTS
TABLE 90.EMERSON ELECTRIC: PRODUCT PORTFOLIO
TABLE 91.EMERSON ELECTRIC: KEY STRATEGIC MOVES AND DEVELOPMENTS
TABLE 92.HONEYWELL INTERNATIONAL: KEY EXECUTIVES
TABLE 93.HONEYWELL INTERNATIONAL: COMPANY SNAPSHOT
TABLE 94.HONEYWELL INTERNATIONAL: OPERATING SEGMENTS
TABLE 95.HONEYWELL INTERNATIONAL: PRODUCT PORTFOLIO
TABLE 96.JOHNSON CONTROLS: KEY EXECUTIVES
TABLE 97.JOHNSON CONTROLS: COMPANY SNAPSHOT
TABLE 98.JOHNSON CONTROLS: OPERATING SEGMENTS
TABLE 99.JOHNSON CONTROLS: PRODUCT PORTFOLIO
TABLE 100.JOHNSON CONTROLS: KEY STRATEGIC MOVES AND DEVELOPMENTS
TABLE 101.NETATMO: KEY EXECUTIVES
TABLE 102.NETATMO: COMPANY SNAPSHOT
TABLE 103.NETATMO: OPERATING SEGMENTS
TABLE 104.NETATMO: PRODUCT PORTFOLIO
TABLE 105.NETATMO: KEY STRATEGIC MOVES AND DEVELOPMENTS
TABLE 106.SCHNEIDER ELECTRIC: KEY EXECUTIVES
TABLE 107.SCHNEIDER ELECTRIC: COMPANY SNAPSHOT
TABLE 108.SCHNEIDER ELECTRIC: OPERATING SEGMENTS
TABLE 109.SCHNEIDER ELECTRIC: PRODUCT PORTFOLIO
TABLE 110.SIEMENS AG: KEY EXECUTIVES
TABLE 111.SIEMENS: COMPANY SNAPSHOT
TABLE 112.SIEMENS AG: OPERATING SEGMENTS
TABLE 113.SIEMENS AG: PRODUCT PORTFOLIO
TABLE 114.TADO: KEY EXECUTIVES
TABLE 115.TADO: COMPANY SNAPSHOT
TABLE 116.TADO: OPERATING SEGMENTS
TABLE 117.TADO: PRODUCT PORTFOLIO
TABLE 118.TADO: KEY STRATEGIC MOVES AND DEVELOPMENTS
TABLE 119.ZEN THERMOSTAT: KEY EXECUTIVES
TABLE 120.ZEN THERMOSTAT: COMPANY SNAPSHOT
TABLE 121.ZEN THERMOSTAT: OPERATING SEGMENTS
TABLE 122.ZEN THERMOSTAT: PRODUCT PORTFOLIO
LIST OF FIGURES
FIGURE 01.KEY MARKET SEGMENTS
FIGURE 02.EXECUTIVE SUMMARY, BY SEGMENTATION
FIGURE 03.EXECUTIVE SUMMARY, BY REGION
FIGURE 04.TOP IMPACTING FACTORS
FIGURE 05.TOP INVESTMENT POCKETS
FIGURE 06.MODERATE TO HIGH BARGAINING POWER OF SUPPLIERS
FIGURE 07.LOW THREAT OF NEW ENTRANTS
FIGURE 08.LOW THREAT OF SUBSTITUTES
FIGURE 09.MODERATE INTENSITY OF RIVALRY
FIGURE 10.MODERATE BARGAINING POWER OF BUYERS
FIGURE 11.GLOBAL SMART THERMOSTAT MARKET SHARE, BY TECHNOLOGY, 2019–2027 (%)
FIGURE 12.GLOBAL SMART THERMOSTAT MARKET, BY TECHNOLOGY, 2019-2027 ($MILLION)
FIGURE 13.COMPARATIVE SHARE ANALYSIS WI-FISMART THERMOSTATMARKET, BY COUNTRY, 2019 & 2027 (%)
FIGURE 14.COMPARATIVE SHARE ANALYSIS BLUETOOTHSMART THERMOSTAT MARKET, BY COUNTRY, 2019 & 2027 (%)
FIGURE 15.COMPARATIVE SHARE ANALYSIS ZIGBEE SMART THERMOSTATMARKET, BY COUNTRY, 2019 & 2027 (%)
FIGURE 16.COMPARATIVE SHARE ANALYSIS OTHERSSMART THERMOSTATMARKET, BY COUNTRY, 2019 & 2027 (%)
FIGURE 17.GLOBAL SMART THERMOSTAT MARKET SHARE, BY APPLICATION, 2019–2027 (%)
FIGURE 18.COMPARATIVE SHARE ANALYSIS OF SMART THERMOSTATMARKET FOR AIR CONDITIONING, BY COUNTRY, 2019 & 2027 (%)
FIGURE 19.COMPARATIVE SHARE ANALYSIS OF SMART THERMOSTATMARKET FOR HEATING, BY COUNTRY, 2019 & 2027 (%)
FIGURE 20.COMPARATIVE SHARE ANALYSIS OF SMART THERMOSTAT MARKET FOR VENTILATION, BY COUNTRY, 2019 & 2027 (%)
FIGURE 21.GLOBAL SMART THERMOSTAT MARKET SHARE, BY END USER, 2019–2027 (%)
FIGURE 22.COMPARATIVE SHARE ANALYSIS OF SMART THERMOSTATMARKET FOR RESIDENTIAL, BY COUNTRY, 2019 & 2027 (%)
FIGURE 23.COMPARATIVE SHARE ANALYSIS OF SMART THERMOSTATMARKET FOR COMMERCIAL, BY COUNTRY, 2019 & 2027 (%)
FIGURE 24.COMPARATIVE SHARE ANALYSIS OF SMART THERMOSTATMARKET FOR INDUSTRIAL, BY COUNTRY, 2019 & 2027 (%)
FIGURE 25.COMPARATIVE SHARE ANALYSIS OF SMART THERMOSTATMARKET FOR OTHERS, BY COUNTRY, 2019 & 2027 (%)
FIGURE 26.SMART THERMOSTAT MARKET, BY REGION, 2019-2027 (%)
FIGURE 27.COMPARATIVE SHARE ANALYSIS OF NORTH AMERICA SMART THERMOSTAT MARKET, BY COUNTRY, 2019–2027 (%)
FIGURE 28.CANADASMART THERMOSTAT MARKET, 2019–2027 ($MILLION)
FIGURE 29.MEXICOSMART THERMOSTAT MARKET, 2019–2027 ($MILLION)
FIGURE 30.COMPARATIVE SHARE ANALYSIS OF EUROPESMART THERMOSTAT MARKET, BY COUNTRY, 2019–2027 (%)
FIGURE 31.UK SMART THERMOSTAT MARKET, 2019–2027 ($MILLION)
FIGURE 32.GERMANY SMART THERMOSTAT MARKET, 2019–2027 ($MILLION)
FIGURE 33.RUSSIA SMART THERMOSTAT MARKET, 2019–2027 ($MILLION)
FIGURE 34.FRANCESMART THERMOSTAT MARKET, 2019–2027 ($MILLION)
FIGURE 35.REST OF EUROPE SMART THERMOSTAT MARKET, 2019–2027 ($MILLION)
FIGURE 36.COMPARATIVE SHARE ANALYSIS OF ASIA-PACIFIC SMART THERMOSTAT MARKET, BY COUNTRY, 2019–2027 (%)
FIGURE 37.CHINA SMART THERMOSTAT MARKET, 2019–2027 ($MILLION)
FIGURE 38.JAPAN SMART THERMOSTAT MARKET, 2019–2027 ($MILLION)
FIGURE 39.INDIA SMART THERMOSTAT MARKET, 2019–2027 ($MILLION)
FIGURE 40.AUSTRALIA SMART THERMOSTAT MARKET, 2019–2027 ($MILLION)
FIGURE 41.REST OF ASIA-PACIFIC SMART THERMOSTAT MARKET, 2019–2027 ($MILLION)
FIGURE 42.COMPARATIVE SHARE ANALYSIS OF LAMEA SMART THERMOSTAT MARKET, BY COUNTRY, 2019–2027 (%)
FIGURE 43.LATIN AMERICA SMART THERMOSTAT MARKET, 2019–2027 ($MILLION)
FIGURE 44.MIDDLE EAST SMART THERMOSTAT MARKET, 2019–2027 ($MILLION)
FIGURE 45.AFRICA SMART THERMOSTAT MARKET, 2019–2027 ($MILLION)
FIGURE 46.MARKET PLAYER POSITIONING, 2019
FIGURE 47.PRODUCT MAPPING OF TOP 10 PLAYERS
FIGURE 48.COMPETITIVE DASHBOARD
FIGURE 49.COMPETITIVE HEATMAP OF KEY PLAYERS
FIGURE 50.ALPHABET INC.(NEST LABS), 2017–2019 ($MILLION)
FIGURE 51.ALPHABET INC. (NEST LABS): REVENUE, 2017–2019 ($MILLION)
FIGURE 52.ALPHABET INC. (NEST LABS): REVENUE SHARE BY SEGMENT, 2019 (%)
FIGURE 53.ALPHABET INC. (NEST LABS): REVENUE SHARE BY REGION, 2019 (%)
FIGURE 54.EMERSON ELECTRIC, 2018–2020 ($MILLION)
FIGURE 55.EMERSON ELECTRIC: REVENUE, 2018–2020 ($MILLION)
FIGURE 56.ECOBEE: REVENUE SHARE BY SEGMENT, 2020 (%)
FIGURE 57.EMERSON ELECTRIC: REVENUE SHARE BY REGION, 2020 (%)
FIGURE 58.HONEYWELL INTERNATIONAL, 2017–2019 ($MILLION)
FIGURE 59.HONEYWELL INTERNATIONAL: REVENUE, 2017–2019 ($MILLION)
FIGURE 60.HONEYWELL INTERNATIONAL: REVENUE SHARE BY SEGMENT, 2019 (%)
FIGURE 61.HONEYWELL INTERNATIONAL: REVENUE SHARE BY REGION, 2019 (%)
FIGURE 62.JOHNSON CONTROLS, 2018–2020 ($MILLION)
FIGURE 63.JOHNSON CONTROLS: REVENUE, 2018–2020 ($MILLION)
FIGURE 64.JOHNSON CONTROLS: REVENUE SHARE BY SEGMENT, 2020 (%)
FIGURE 65.JOHNSON CONTROLS REVENUE SHARE BY REGION, 2020 (%)
FIGURE 66.NETATMO, 2017–2019 ($MILLION)
FIGURE 67.NETATMO: REVENUE, 2017–2019 ($MILLION)
FIGURE 68.NETATMO: REVENUE SHARE BY REGION, 2019 (%)
FIGURE 69.SCHNEIDER ELECTRIC, 2017–2019 ($MILLION)
FIGURE 70.SCHNEIDER ELECTRIC: REVENUE, 2017–2019 ($MILLION)
FIGURE 71.SCHNEIDER ELECTRIC: REVENUE SHARE BY SEGMENT, 2019 (%)
FIGURE 72.SCHNEIDER ELECTRIC: REVENUE SHARE BY REGION, 2019 (%)
FIGURE 73.SIEMENS AG, 2018–2020 ($MILLION)
FIGURE 74.SIEMENS AG: REVENUE, 2018–2020 ($MILLION)
FIGURE 75.SIEMENS AG: REVENUE SHARE BY SEGMENT, 2020 (%)
FIGURE 76.SIEMENS AG: REVENUE SHARE BY REGION, 2020 (%)
$6159
$9648
HAVE A QUERY?
OUR CUSTOMER

SIMILAR REPORTS