
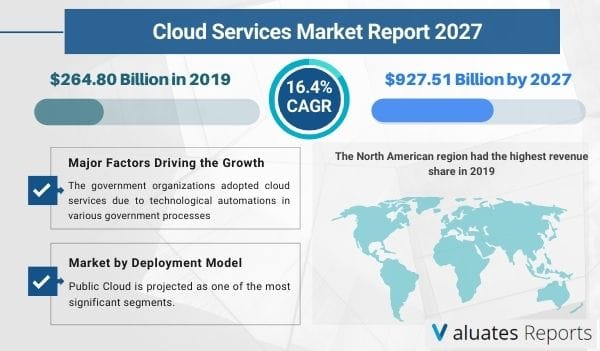
The cloud services market size was valued at $264.80 billion in 2019 and is projected to reach $927.51 billion by 2027, growing at a CAGR of 16.4% from 2020 to 2027. The global adoption of cloud computing services in various sectors such as medical & healthcare, banking financial services & insurance, and the educational sector with the help of various deployment models determine the scope of a further increase in the global cloud computing services market.
Cloud computing refers to the model or network where a program or applications run, which can be accessed by many devices or servers at a time. Cloud computing technology is a shift in the tradition of computing, which has given newer and faster methods to provide computing solutions, infrastructure solutions, and application layers. The cloud services market report focuses on the emerging cloud computing technology and its application. It also gives a comparative analysis of the cloud computing technology with the conventional technology and describes how the cloud computing technology scores an upper hand than the conventional technology.
The cloud computing technology comprises of both hardware as well as the software through which the services are delivered. This report contains only the services category and excludes the hardware. Hence, the report also focuses on the cloud services market opportunities. There lies a great potential in the cloud computing services market due to several benefits such as access to a broader network, on-demand service, pay as you go benefits, resource pooling, business agility, rapid elasticity, cost-cutting, and others.
The government organizations adopted cloud services due to technological automation in various government processes such as ID, passport, and citizen records; therefore, this application had the highest market share in 2019. The BFSI sector had the second-highest market share in 2019 due to the deployment of cloud services to simplify complex procedures that are highly confidential. The private organization's application is expected to grow at the highest CAGR during the forecast period as the IT sector is expected to adopt cloud services on a large scale for developing various software and application for business.
The North American region had the highest revenue share in 2019 billion as it adopted the technology early as most of the market players hail from this region. Europe is a close second in terms of cloud services market share, as the region is adopting the cloud services in various sectors such as healthcare, banking financial services & insurance, and education sector. Asia-Pacific is expected to grow at the highest CAGR for the forecast period of 2020-2027 due to the presence of developing economies such as India and China.
The report focuses on the growth prospects, restraints, and market analysis. The study provides Porter’s five forces analysis of the cloud services industry to understand the impact of various factors such as bargaining power of suppliers, competitive intensity of competitors, threat of new entrants, threat of substitutes, and bargaining power of buyers on the market.
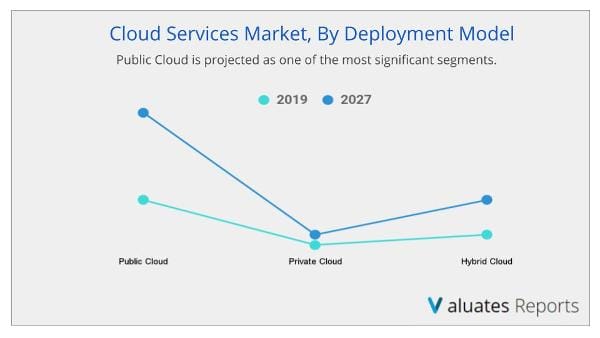
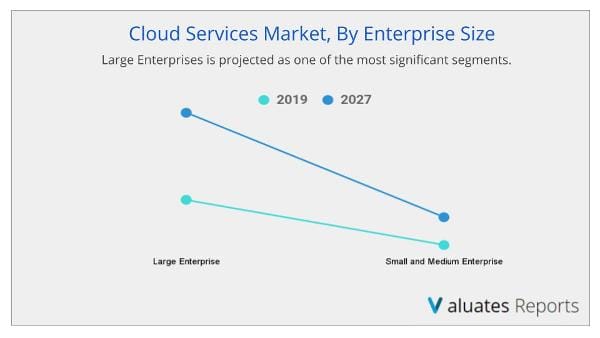
The cloud services market is segmented on the basis of service type, cloud type, enterprise size, industry vertical, and region. By service type, it is categorized into IaaS, PaaS, SaaS, BPaaS, and management and security services. On the basis of cloud type, it is divided into a public cloud, private cloud, and hybrid cloud. By enterprise size, it is classified as intolarge enterprises and small and medium enterprises. Depending on industry vertical, it is divided intoBFSI, IT & telecommunications, government, retail, healthcare, energy & utilities, media & entertainment, manufacturing, and others. By region, the market is analyzed across North America, Europe, Asia-Pacific, and LAMEA.
Top Impacting Factors
The technological maturity of the cloud computing is a primary reason for the shift in the paradigm as the global adoption of cloud would lead innovations in the technology and impact cost correction significantly. An increase in adoption of cloud computing services in SMEs and the financial limitations of the emerging companies provide a platform for cloud computing technology to prove its cost-effective capabilities. These are major factors that drive the growth of the global cloud services market. However, data security creates a feeling of distrust among the organizations and it is observed that the organizations hesitate in adopting the technology which in turn hampers the market growth. Furthermore, the evolving technology market is an opportunistic factor that is completely focused on improvising the functional capabilities in the coming years and in turn boost cloud services market growth.
Over the past few decades, a growth in the number of small as well as medium enterprises has been observed. The increased number of small and medium enterprises has a significant effect on the cloud services market opportunities; however, this factor is expected to have a huge impact on the cloud computing market in the long run. The financial benefits motivate entrepreneurs to opt for cloud computing technology. The growth in these SMEs is expected to propel the growth of the cloud services market forecast. The rise in the number of SMEs has large deployment of cloud computing services possibilities that impacts market growth positively.
Key Benefits for Stakeholders
Ans. By Enterprise Size, Large Enterprises is projected as one of the most significant segments.
Ans. The North American region had the highest revenue share in 2019 billion as it adopted the technology early as most of the market players hail from this region
Ans. The forecast period for the cloud services market is 2020 to 2027
Ans. The global adoption of cloud computing services in various sectors such as medical & healthcare, banking financial services & insurance, and the educational sector with the help of various deployment models determines the scope of a further increase in the global cloud computing services market.
Ans. The market players operating in the cloud services market analysis include Alibaba Cloud, Amazon Web Services, Inc., Cisco System, Inc., Dell Technologies Inc., Google LLC, Hewlett Packard Enterprise Development LP, International Business Machine (IBM) Corporation, Microsoft Corporation, Oracle Corporation, and Rackspace Hosting, Inc.
Ans. The cloud services market size was valued at $264.80 billion in 2019, and is projected to reach $927.51 billion by 2027, growing at a CAGR of 16.4% from 2020 to 2027.
CHAPTER 1:INTRODUCTION
1.1.REPORT DESCRIPTION
1.2.RESEARCH METHODOLOGY
1.2.1.Secondary research
1.2.2.Primary research
1.2.3.Analyst tools & models
CHAPTER 2:EXECUTIVE SUMMARY
2.1.KEY FINDINGS
2.1.1.Top impacting factors
2.1.2.Top investment pockets
2.2.CXO PERSPECTIVE
CHAPTER 3:MARKET OVERVIEW
3.1.MARKET DEFINITION AND SCOPE
3.2.PORTER’S FIVE FORCES ANALYSIS
3.2.1.Moderate -To-High bargaining power of suppliers
3.2.2.Low-To-High bargaining power of buyers
3.2.3.Low-To-High Threat of substitutes
3.2.4.Low threat of new entrants
3.2.5.Low-To-High competitive rivalry
3.3.VALUE CHAIN ANALYSIS
3.3.1.Network connectivity & hardware:
3.3.2.Infrastructure & hosting
3.3.3.Platform and application services
3.3.4.Application management and service bundling
3.3.5.Service delivery & customer support
3.3.6.Consulting and SI
3.4.PRICING MODEL
3.4.1.Consumption based pricing
3.4.2.Subscription based pricing
3.4.3.Advertising based pricing
3.4.4.Market based pricing
3.5.MARKET DYNAMICS
3.5.1.Drivers
3.5.1.1.Increase in demand for cloud services
3.5.1.2.Increase in adoption of cloud in SME’s
3.5.2.Restraint
3.5.2.1.Concerns associated with data security and protection
3.5.3.Opportunities
3.5.3.1.Rise in cloud services adoption in developing regions
3.6.PATENT ANALYSIS
3.6.1.By Region (2010-2019)
3.6.2.By Applicant
3.7.MARKET EVOLUTION/ INDUSTRY ROADMAP
3.8.IMPACT OF GOVERNMENT REGULATIONS ON THE GLOBAL CLOUD SERVICES MARKET
3.8.1.Regulatory compliances
3.8.2.Regulations in Canada:
3.8.3.Regulations in U.S.
3.8.3.1.Contractual issues
3.8.4.Europe and its regulations
3.8.4.1.Privacy and data protection
3.8.4.2.Liability of cloud provider for illegal contract
3.8.5.Asia-Pacific
3.8.5.1.Regulations in Singapore:
3.8.5.2.Regulations in India:
CHAPTER 4:CLOUD SERVICES MARKET, BY SERVICE MODEL
4.1.OVERVIEW
4.2.INFRASTRUCTURE AS A SERVICE (IAAS)
4.2.1.Key market trends, growth factors, and opportunities
4.2.2.Market size and forecast, by region
4.2.3.Market analysis, by country
4.3.PLATFORM AS A SERVICE (PAAS)
4.3.1.Key market trends, growth factors, and opportunities
4.3.2.Market size and forecast, by region
4.3.3.Market analysis, by country
4.4.SOFTWARE AS A SERVICE (SAAS)
4.4.1.Key market trends, growth factors, and opportunities
4.4.2.Market size and forecast, by region
4.4.3.Market analysis, by country
4.5.BUSINESS PROCESS AS A SERVICE (BPAAS)
4.5.1.Key market trends, growth factors, and opportunities
4.5.2.Market size and forecast, by region
4.5.3.Market analysis, by country
4.6.MANAGEMENT AND SECURITY SERVICES
4.6.1.Key market trends, growth factors, and opportunities
4.6.2.Market size and forecast, by region
4.6.3.Market analysis, by country
CHAPTER 5:CLOUD SERVICES MARKET, BY DEPLOYMENT MODEL
5.1.OVERVIEW
5.2.PUBLIC CLOUD
5.2.1.Key market trends, growth factors, and opportunities
5.2.2.Market size and forecast, by region
5.2.3.Market analysis, by country
5.3.PRIVATE CLOUD
5.3.1.Key market trends, growth factors, and opportunities
5.3.2.Market size and forecast, by region
5.3.3.Market analysis, by country
5.4.HYBRID CLOUD
5.4.1.Key market trends, growth factors, and opportunities
5.4.2.Market size and forecast, by region
5.4.3.Market analysis, by country
CHAPTER 6:CLOUD SERVICES MARKET, BY ENTERPRISE SIZE
6.1.OVERVIEW
6.2.LARGE ENTERPRISES
6.2.1.Key market trends, growth factors, and opportunities
6.2.2.Market size and forecast, by region
6.2.3.Market analysis, by country
6.3.SMALL AND MEDIUM ENTERPRISES
6.3.1.Key market trends, growth factors, and opportunities
6.3.2.Market size and forecast, by region
6.3.3.Market analysis, by country
CHAPTER 7:CLOUD SERVICES MARKET, BY INDUSTRY VERTICAL
7.1.OVERVIEW
7.2.BFSI
7.2.1.Key market trends, growth factors, and opportunities
7.2.2.Market size and forecast, by region
7.2.3.Market analysis, by country
7.3.IT & TELECOMMUNICATIONS
7.3.1.Key market trends, growth factors, and opportunities
7.3.2.Market size and forecast, by region
7.3.3.Market analysis, by country
7.4.GOVERNMENT
7.4.1.Key market trends, growth factors, and opportunities
7.4.2.Market size and forecast, by region
7.4.3.Market analysis, by country
7.5.RETAIL
7.5.1.Key market trends, growth factors, and opportunities
7.5.2.Market size and forecast, by region
7.5.3.Market analysis, by country
7.6.HEALTHCARE
7.6.1.Key market trends, growth factors, and opportunities
7.6.2.Market size and forecast, by region
7.6.3.Market analysis, by country
7.7.ENERGY & UTILITIES
7.7.1.Key market trends, growth factors, and opportunities
7.7.2.Market size and forecast, by region
7.7.3.Market analysis, by country
7.8.MEDIA & ENTERTAINMENT
7.8.1.Key market trends, growth factors, and opportunities
7.8.2.Market size and forecast, by region
7.8.3.Market analysis, by country
7.9.MANUFACTURING
7.9.1.Key market trends, growth factors, and opportunities
7.9.2.Market size and forecast, by region
7.9.3.Market analysis, by country
7.10.OTHERS
7.10.1.Key market trends, growth factors, and opportunities
7.10.2.Market size and forecast, by region
7.10.3.Market analysis, by country
CHAPTER 8:CLOUD SERVICES MARKET, BY REGION
8.1.OVERVIEW
8.2.NORTH AMERICA
8.2.1.Key market trends, growth factors and opportunities
8.2.2.Market size and forecast, by service model
8.2.3.Market size and forecast, by deployment model
8.2.4.Market size and forecast, by enterprise size
8.2.5.Market size and forecast, by industry vertical
8.2.6.Market analysis by country
8.2.6.1.U.S.
8.2.6.1.1.Market size and forecast, by service model
8.2.6.1.2.Market size and forecast, by deployment model
8.2.6.1.3.Market size and forecast, by enterprise size
8.2.6.1.4.Market size and forecast, by industry vertical
8.2.6.2.CANADA
8.2.6.2.1.Market size and forecast, by service model
8.2.6.2.2.Market size and forecast, by deployment model
8.2.6.2.3.Market size and forecast, by enterprise size
8.2.6.2.4.Market size and forecast, by industry vertical
8.3.EUROPE
8.3.1.Key market trends, growth factors and opportunities
8.3.2.Market size and forecast, by service model
8.3.3.Market size and forecast, by deployment model
8.3.4.Market size and forecast, by enterprise size
8.3.5.Market size and forecast, by industry vertical
8.3.6.Market analysis by country
8.3.6.1.GERMANY
8.3.6.1.1.Market size and forecast, by service model
8.3.6.1.2.Market size and forecast, by deployment model
8.3.6.1.3.Market size and forecast, by enterprise size
8.3.6.1.4.Market size and forecast, by industry vertical
8.3.6.2.FRANCE
8.3.6.2.1.Market size and forecast, by service model
8.3.6.2.2.Market size and forecast, by deployment model
8.3.6.2.3.Market size and forecast, by enterprise size
8.3.6.2.4.Market size and forecast, by industry vertical
8.3.6.3.UK
8.3.6.3.1.Market size and forecast, by service model
8.3.6.3.2.Market size and forecast, by deployment model
8.3.6.3.3.Market size and forecast, by enterprise size
8.3.6.3.4.Market size and forecast, by industry vertical
8.3.6.4.ITALY
8.3.6.4.1.Market size and forecast, by service model
8.3.6.4.2.Market size and forecast, by deployment model
8.3.6.4.3.Market size and forecast, by enterprise size
8.3.6.4.4.Market size and forecast, by industry vertical
8.3.6.5.REST OF EUROPE
8.3.6.5.1.Market size and forecast, by service model
8.3.6.5.2.Market size and forecast, by deployment model
8.3.6.5.3.Market size and forecast, by enterprise size
8.3.6.5.4.Market size and forecast, by industry vertical
8.4.ASIA-PACIFIC
8.4.1.Key market trends, growth factors and opportunities
8.4.2.Market size and forecast, by service model
8.4.3.Market size and forecast, by deployment model
8.4.4.Market size and forecast, by enterprise size
8.4.5.Market size and forecast, by industry vertical
8.4.6.Market analysis by country
8.4.6.1.JAPAN
8.4.6.1.1.Market size and forecast, by service model
8.4.6.1.2.Market size and forecast, by deployment model
8.4.6.1.3.Market size and forecast, by enterprise size
8.4.6.1.4.Market size and forecast, by industry vertical
8.4.6.2.CHINA
8.4.6.2.1.Market size and forecast, by service model
8.4.6.2.2.Market size and forecast, by deployment model
8.4.6.2.3.Market size and forecast, by enterprise size
8.4.6.2.4.Market size and forecast, by industry vertical
8.4.6.3.AUSTRALIA
8.4.6.3.1.Market size and forecast, by service model
8.4.6.3.2.Market size and forecast, by deployment model
8.4.6.3.3.Market size and forecast, by enterprise size
8.4.6.3.4.Market size and forecast, by industry vertical
8.4.6.4.INDIA
8.4.6.4.1.Market size and forecast, by service model
8.4.6.4.2.Market size and forecast, by deployment model
8.4.6.4.3.Market size and forecast, by enterprise size
8.4.6.4.4.Market size and forecast, by industry vertical
8.4.6.5.REST OF ASIA-PACIFIC
8.4.6.5.1.Market size and forecast, by service model
8.4.6.5.2.Market size and forecast, by deployment model
8.4.6.5.3.Market size and forecast, by enterprise size
8.4.6.5.4.Market size and forecast, by industry vertical
8.5.LAMEA
8.5.1.Key market trends, growth factors and opportunities
8.5.2.Market size and forecast, by service model
8.5.3.Market size and forecast, by deployment model
8.5.4.Market size and forecast, by enterprise size
8.5.5.Market size and forecast, by industry vertical
8.5.6.Market analysis by country
8.5.6.1.LATIN AMERICA
8.5.6.1.1.Market size and forecast, by service model
8.5.6.1.2.Market size and forecast, by deployment model
8.5.6.1.3.Market size and forecast, by enterprise size
8.5.6.1.4.Market size and forecast, by industry vertical
8.5.6.2.MIDDLE EAST
8.5.6.2.1.Market size and forecast, by service model
8.5.6.2.2.Market size and forecast, by deployment model
8.5.6.2.3.Market size and forecast, by enterprise size
8.5.6.2.4.Market size and forecast, by industry vertical
8.5.6.3.AFRICA
8.5.6.3.1.Market size and forecast, by service model
8.5.6.3.2.Market size and forecast, by deployment model
8.5.6.3.3.Market size and forecast, by enterprise size
8.5.6.3.4.Market size and forecast, by industry vertical
CHAPTER 9:COMPETITIVE LANDSCAPE
9.1.KEY PLAYER POSITIONING ANALYSIS, 2019
9.2.TOP WINNING STRATEGIES
9.3.COMPETITIVE DASHBOARD
9.4.KEY DEVELOPMENTS
9.4.1.New product launches
9.4.2.Product development
9.4.3.Collaboration
9.4.4.Acquisition
9.4.5.Partnership
9.4.6.Business Expansion
CHAPTER 10:COMPANY PROFILES
10.1.ALIBABA GROUP HOLDING LIMITED
10.1.1.Company overview
10.1.2.Key Executives
10.1.3.Company snapshot
10.1.4.Operating business segments
10.1.5.Product portfolio
10.1.6.Business performance
10.1.7.Key strategic moves and developments
10.2.AMAZON WEB SERVICES, INC.
10.2.1.Company overview
10.2.2.Key Executives
10.2.3.Company snapshot
10.2.4.Operating business segments
10.2.5.Product portfolio
10.2.6.Business performance
10.2.7.Key strategic moves and developments
10.4.DELL, TECHNOLOGIES INC.
10.4.1.Company overview
10.4.2.Key executives
10.4.3.Company snapshot
10.4.4.Operating business segments
10.4.5.Product portfolio
10.4.6.R&D expenditure
10.4.7.Business performance
10.4.8.Key strategic moves and developments
10.5.GOOGLE LLC
10.5.1.Company overview
10.5.2.Key Executives
10.5.3.Company snapshot
10.5.4.Product portfolio
10.5.5.R&D expenditure
10.5.6.Business performance
10.5.7.Key strategic moves and developments
10.6.HEWLETT PACKARD ENTERPRISE DEVELOPMENT LP
10.6.1.Company overview
10.6.2.Key executives
10.6.3.Company snapshot
10.6.4.Operating business segments
10.6.5.Product portfolio
10.6.6.R&D expenditure
10.6.7.Business performance
10.6.8.Key strategic moves and developments
10.7.INTERNATIONAL BUSINESS MACHINES CORPORATION
10.7.1.Company overview
10.7.2.Key Executives
10.7.3.Company snapshot
10.7.4.Operating business segments
10.7.5.Product portfolio
10.7.6.R&D Expenditure
10.7.7.Business performance
10.7.8.Key strategic moves and developments
10.8.MICROSOFT CORPORATION
10.8.1.Company overview
10.8.2.Key executives
10.8.3.Company snapshot
10.8.4.Operating business segments
10.8.5.Product portfolio
10.8.6.R&D expenditure
10.8.7.Business performance
10.8.8.Key strategic moves and developments
10.9.ORACLE CORPORATION
10.9.1.Company overview
10.9.2.Key executives
10.9.3.Company snapshot
10.9.4.Operating business segments
10.9.5.Product portfolio
10.9.6.R&D expenditure
10.9.7.Business performance
10.9.8.Key strategic moves and developments
10.10.RACKSPACE HOSTING, INC.
10.10.1.Company overview
10.10.2.Key Executives
10.10.3.Company snapshot
10.10.4.Product portfolio
10.10.5.Key strategic moves and developments
Table 01.cloud Services Market, By Service Model, 2019–2027 ($billion)
Table 02.cloud Services Market For Iaas, By Region, 2019–2027 ($billion)
Table 03.cloud Services Market For Paas, By Region, 2019–2027 ($billion)
Table 04.cloud Services Market For Saas, By Region, 2019–2027 ($billion)
Table 05.cloud Services Market For Bpaas, By Region, 2019–2027 ($billion)
Table 06.cloud Services Market For Management And Security Services, By Region, 2019–2027 ($billion)
Table 07.cloud Services Market, By Deployment Model 2019–2027 ($billion)
Table 08.cloud Services Market For Public Cloud, By Region, 2019–2027 ($billion)
Table 09.cloud Services Market For Private Cloud, By Region, 2019–2027 ($billion)
Table 10.cloud Services Market For Hybrid Cloud, By Region, 2019–2027 ($billion)
Table 11.cloud Services Market, By Enterprise Size 2019–2027 ($billion)
Table 12.cloud Services Market For Large Enterprises, By Region, 2019–2027 ($billion)
Table 13.cloud Services Market For Small And Medium Enterprises, By Region, 2019–2027 ($billion)
Table 14.cloud Services Market, By Industry Vertical, 2019–2027 ($billion)
Table 15.cloud Services Market For Bfsi, By Region, 2019–2027 ($billion)
Table 16.cloud Services Market For It & Telecommunications, By Region, 2019–2027 ($billion)
Table 17.cloud Services Market For Government, By Region, 2019–2027 ($billion)
Table 18.cloud Services Market For Retail, By Region, 2019–2027 ($billion)
Table 19.cloud Services Market For Healthcare, By Region, 2019–2027 ($billion)
Table 20.cloud Services Market For Energy & Utilities, By Region, 2019–2027 ($billion)
Table 21.cloud Services Market For Media & Entertainment, By Region, 2019–2027 ($billion)
Table 22.cloud Services Market For Manufacturing, By Region, 2019–2027 ($billion)
Table 23.cloud Services Market For Others, By Region, 2019–2027 ($billion)
Table 24.cloud Services Market, By Region , 2019–2027 ($billion)
Table 25.cloud Services Market, By Region , 2019–2027 ($billion)
Table 26.north America Cloud Services Market, By Service Model 2019-2027 ($billion)
Table 27.north America Cloud Services Market, By Deployment Model, 2019-2027 ($billion)
Table 28.north America Cloud Services Market, By Enterprise Size, 2019-2027 ($billion)
Table 29.north America Cloud Services Market, By Industry Vertical, 2019-2027 ($billion)
Table 30.north America Cloud Services Market, By Country, 2019-2027 ($billion)
Table 31.u.s. Cloud Services Market, By Service Model 2019-2027 ($billion)
Table 32.u.s. Cloud Services Market, By Deployment Model, 2019-2027 ($billion)
Table 33.u.s. Cloud Services Market, By Enterprise Size, 2019-2027 ($billion)
Table 34.u.s. Cloud Services Market, By Industry Vertical, 2019-2027 ($billion)
Table 35.canada Cloud Services Market, By Service Model 2019-2027 ($billion)
Table 36.canada Cloud Services Market, By Deployment Model, 2019-2027 ($billion)
Table 37.canada Cloud Services Market, By Enterprise Size, 2019-2027 ($billion)
Table 38.canada Cloud Services Market, By Industry Vertical, 2019-2027 ($billion)
Table 39.europe Cloud Services Market, By Service Model 2019-2027 ($billion)
Table 40.europe Cloud Services Market, By Deployment Model, 2019-2027 ($billion)
Table 41.europe Cloud Services Market, By Enterprise Size, 2019-2027 ($billion)
Table 42.europe Cloud Services Market, By Industry Vertical, 2019-2027 ($billion)
Table 43.europe Cloud Services Market, By Country, 2019-2027 ($billion)
Table 44.germany Cloud Services Market, By Service Model 2019-2027 ($billion)
Table 45.germany Cloud Services Market, By Deployment Model, 2019-2027 ($billion)
Table 46.germany Cloud Services Market, By Enterprise Size, 2019-2027 ($billion)
Table 47.germany Cloud Services Market, By Industry Vertical, 2019-2027 ($billion)
Table 48.france Cloud Services Market, By Service Model 2019-2027 ($billion)
Table 49.france Cloud Services Market, By Deployment Model, 2019-2027 ($billion)
Table 50.france Cloud Services Market, By Enterprise Size, 2019-2027 ($billion)
Table 51.france Cloud Services Market, By Industry Vertical, 2019-2027 ($billion)
Table 52.uk Cloud Services Market, By Service Model 2019-2027 ($billion)
Table 53.uk Cloud Services Market, By Deployment Model, 2019-2027 ($billion)
Table 54.uk Cloud Services Market, By Enterprise Size, 2019-2027 ($billion)
Table 55.uk Cloud Services Market, By Industry Vertical, 2019-2027 ($billion)
Table 56.italy Cloud Services Market, By Service Model 2019-2027 ($billion)
Table 57.italy Cloud Services Market, By Deployment Model, 2019-2027 ($billion)
Table 58.italy Cloud Services Market, By Enterprise Size, 2019-2027 ($billion)
Table 59.italy Cloud Services Market, By Industry Vertical, 2019-2027 ($billion)
Table 60.rest Of Europe Cloud Services Market, By Service Model 2019-2027 ($billion)
Table 61.rest Of Europe Cloud Services Market, By Deployment Model, 2019-2027 ($billion)
Table 62.rest Of Europe Cloud Services Market, By Enterprise Size, 2019-2027 ($billion)
Table 63.rest Of Europe Cloud Services Market, By Industry Vertical, 2019-2027 ($billion)
Table 64.asia-pacific Cloud Services Market, By Service Model 2019-2027 ($billion)
Table 65.asia-pacific Cloud Services Market, By Deployment Model, 2019-2027 ($billion)
Table 66.asia-pacific Cloud Services Market, By Enterprise Size, 2019-2027 ($billion)
Table 67.asia-pacific Cloud Services Market, By Industry Vertical, 2019-2027 ($billion)
Table 68.asia-pacific Cloud Services Market, By Country, 2019-2027 ($billion)
Table 69.japan Cloud Services Market, By Service Model 2019-2027 ($billion)
Table 70.japan Cloud Services Market, By Deployment Model, 2019-2027 ($billion)
Table 71.japan Cloud Services Market, By Enterprise Size, 2019-2027 ($billion)
Table 72.japan Cloud Services Market, By Industry Vertical, 2019-2027 ($billion)
Table 73.china Cloud Services Market, By Service Model 2019-2027 ($billion)
Table 74.china Cloud Services Market, By Deployment Model, 2019-2027 ($billion)
Table 75.china Cloud Services Market, By Enterprise Size, 2019-2027 ($billion)
Table 76.china Cloud Services Market, By Industry Vertical, 2019-2027 ($billion)
Table 77.australia Cloud Services Market, By Service Model 2019-2027 ($billion)
Table 78.australia Cloud Services Market, By Deployment Model, 2019-2027 ($billion)
Table 79.australia Cloud Services Market, By Enterprise Size, 2019-2027 ($billion)
Table 80.australia Cloud Services Market, By Industry Vertical, 2019-2027 ($billion)
Table 81.india Cloud Services Market, By Service Model 2019-2027 ($billion)
Table 82.india Cloud Services Market, By Deployment Model, 2019-2027 ($billion)
Table 83.india Cloud Services Market, By Enterprise Size, 2019-2027 ($billion)
Table 84.india Cloud Services Market, By Industry Vertical, 2019-2027 ($billion)
Table 85.rest Of Asia-pacific Cloud Services Market, By Service Model 2019-2027 ($billion)
Table 86.rest Of Asia-pacific Cloud Services Market, By Deployment Model, 2019-2027 ($billion)
Table 87.rest Of Asia-pacific Cloud Services Market, By Enterprise Size, 2019-2027 ($billion)
Table 88.rest Of Asia-pacific Cloud Services Market, By Industry Vertical, 2019-2027 ($billion)
Table 89.lamea Cloud Services Market, By Service Model 2019-2027 ($billion)
Table 90.lamea Cloud Services Market, By Deployment Model, 2019-2027 ($billion)
Table 91.lamea Cloud Services Market, By Enterprise Size, 2019-2027 ($billion)
Table 92.lamea Cloud Services Market, By Industry Vertical, 2019-2027 ($billion)
Table 93.latin America Cloud Services Market, By Service Model 2019-2027 ($billion)
Table 94.latin America Cloud Services Market, By Deployment Model, 2019-2027 ($billion)
Table 95.latin America Cloud Services Market, By Enterprise Size, 2019-2027 ($billion)
Table 96.latin America Cloud Services Market, By Industry Vertical, 2019-2027 ($billion)
Table 97.middle East Cloud Services Market, By Service Model 2019-2027 ($billion)
Table 98.middle East Cloud Services Market, By Deployment Model, 2019-2027 ($billion)
Table 99.middle East Cloud Services Market, By Enterprise Size, 2019-2027 ($billion)
Table 100.middle East Cloud Services Market, By Industry Vertical, 2019-2027 ($billion)
Table 101.africa Cloud Services Market, By Service Model 2019-2027 ($billion)
Table 102.africa Cloud Services Market, By Deployment Model, 2019-2027 ($billion)
Table 103.africa Cloud Services Market, By Enterprise Size, 2019-2027 ($billion)
Table 104.africa Cloud Services Market, By Industry Vertical, 2019-2027 ($billion)
Table 105.key New Product Launches (2018-2020)
Table 106.productdevelopment (2018-2020)
Table 107.collaboration (2018-2020)
Table 108.acquistion (2018-2020)
Table 109.partnership (2018-2020)
Table 110.business Expansion (2018-2020)
Table 111.alibaba Group Holding Limited: Company Snapshot
Table 112.alibaba Group Holding Limited: Operating Segments
Table 113.alibaba Group Holding Limited: Product Portfolio
Table 114.amazon Web Services, Inc.: Key Executives
Table 115.amazon Web Services, Inc.: Company Snapshot
Table 116.amazon Web Services, Inc.: Operating Segments
Table 117.amazon Web Services, Inc.: Product Portfolio
Table 121.cisco Systems, Inc.: Key Strategic Moves And Developments
Table 122.dell Technologies Inc.: Key Executives
Table 123.dell Technologies Inc.: Company Snapshot
Table 124.dell Technologies Inc.: Operating Segments
Table 125.dell Technologies Inc.: Product Portfolio
Table 126.dell Technologies Inc.: Key Strategic Moves And Developments
Table 127.google Llc: Key Executives
Table 128.google Inc.: Company Snapshot
Table 129.google Llc: Product Portfolio
Table 130.hewlett Packard Enterprise Development Lp: Key Executives
Table 131.hewlett Packard Enterprise Development Lp: Company Snapshot
Table 132.hewlett Packard Enterprise Development Lp: Operating Segments
Table 133.hewlett Packard Enterprise Development Lp: Product Portfolio
Table 134.hewlett Packard Enterprise Development Lp: Key Strategic Moves And Developments
Table 135.international Business Machines Corporation: Key Executives
Table 136.international Business Machines Corporation: Company Snapshot
Table 137.international Business Machines Corporation: Operating Segments
Table 138.international Business Machines Corporation: Product Portfolio
Table 139.microsoft Corporation: Key Executives
Table 140.microsoft Corporation: Company Snapshot
Table 141.microsoft Corporation: Operating Segments
Table 142.microsoft Corporation: Product Portfolio
Table 143.oracle Corporation: Key Executives
Table 144.oracle Corporation: Company Snapshot
Table 145.oracle Corporation: Operating Segments
Table 146.oracle Corporation: Product Portfolio
Table 147.oracle Corporation: Key Strategic Moves And Developments
Table 148.rackspace Hosting, Inc.: Company Snapshot
Table 149.rackspace Hosting, Inc.: Product Portfolio
List Of Figures
Figure 01.key Market Segments
Figure 02.cloud Services Market, 2019–2027
Figure 03.cloud Services Market, By Country, 2019-2027
Figure 04.top Impacting Factors
Figure 05.top Investment Pockets
Figure 06.moderate -to-high Bargaining Power Of Suppliers
Figure 07.low-to-high Bargaining Power Of Buyers
Figure 08.low-to-high Threat Of Substitutes
Figure 09.low Threat Of New Entrants
Figure 10.low-to-high Competitive Rivalry
Figure 11.value Chain Of Cloud Computing Services Market
Figure 12.market Dynamics: Global E-waste Management Market
Figure 13.faster Return On Investment Using Cloud Computing Services
Figure 14.patent Analysis, By Region
Figure 15.patent Analysis, By Applicant
Figure 16.market Evolution/ Industry Roadmap
Figure 17.impact Of Government Regulations On The Global Cloud Services Market
Figure 18.cloud Services Market, By Service Model, 2019–2027 ($billion)
Figure 19.comparative Share Analysis Of Cloud Services Market For Iaas, By Country, 2019 & 2027 (%)
Figure 20.comparative Share Analysis Of Cloud Services Market For Paas, By Country, 2019 & 2027 (%)
Figure 21.comparative Share Analysis Of Cloud Services Market For Saas, By Country, 2019 & 2027 (%)
Figure 22.business Process As A Service In Organisaton
Figure 23.comparative Share Analysis Of Cloud Services Market For Bpaas, By Country, 2019 & 2027 (%)
Figure 24.comparative Share Analysis Of Cloud Services Market For Management And Security Services, By Country, 2019 & 2027 (%)
Figure 25.cloud Services Market, By Deployment Model, 2019–2027 ($billion)
Figure 26.comparative Share Analysis Of Cloud Services Market For Public Cloud, By Country, 2019 & 2027 (%)
Figure 27.utilisation Of Private Cloud By Organisation
Figure 28.comparative Share Analysis Of Cloud Services Market For Private Cloud, By Country, 2019 & 2027 (%)
Figure 29.comparative Share Analysis Of Cloud Services Market For Hybrid Cloud, By Country, 2019 & 2027 (%)
Figure 30.cloud Services Market, By Enterprise Size, 2019–2027 ($billion)
Figure 31.comparative Share Analysis Of Cloud Services Market For Large Enterprises, By Country, 2019 & 2027 (%)
Figure 32.comparative Share Analysis Of Cloud Services Market For Small And Medium Enterprises, By Country, 2019 & 2027 (%)
Figure 33.cloud Services Market, By Industry Vertical, 2019–2027 ($billion)
Figure 34.comparative Share Analysis Of Cloud Services Market For Bfsi, By Country, 2019 & 2027 (%)
Figure 35.comparative Share Analysis Of Cloud Services Market For It & Telecommunications, By Country, 2019 & 2027 (%)
Figure 36.comparative Share Analysis Of Cloud Services Market For Government, By Country, 2019 & 2027 (%)
Figure 37.comparative Share Analysis Of Cloud Services Market For Retail, By Country, 2019 & 2027 (%)
Figure 38.comparative Share Analysis Of Cloud Services Market For Healthcare, By Country, 2019 & 2027 (%)
Figure 39.comparative Share Analysis Of Cloud Services Market For Energy & Utilities, By Country, 2019 & 2027 (%)
Figure 40.comparative Share Analysis Of Cloud Services Market For Media & Entertainment, By Country, 2019 & 2027 (%)
Figure 41.comparative Share Analysis Of Cloud Services Market For Manufacturing, By Country, 2019 & 2027 (%)
Figure 42.comparative Share Analysis Of Cloud Services Market For Others, By Country, 2019 & 2027 (%)
Figure 43.u.s. Cloud Services Market, 2019-2027 ($billion)
Figure 44.canada Cloud Services Market, 2019-2027 ($billion)
Figure 45.germany Cloud Services Market, 2019-2027 ($billion)
Figure 46.france Cloud Services Market, 2019-2027 ($billion)
Figure 47.uk Cloud Services Market, 2019-2027 ($billion)
Figure 48.italy Cloud Services Market, 2019-2027 ($billion)
Figure 49.rest Of Europe Cloud Services Market, 2019-2027 ($billion)
Figure 50.japan Cloud Services Market, 2019-2027 ($billion)
Figure 51.china Cloud Services Market, 2019-2027 ($billion)
Figure 52.australia Cloud Services Market, 2019-2027 ($billion)
Figure 53.india Cloud Services Market, 2019-2027 ($billion)
Figure 54.rest Of Asia-pacific Cloud Services Market, 2019-2027 ($billion)
Figure 55.lamea Cloud Services Market, By Country, 2019-2027 ($billion)
Figure 56.latin America Cloud Services Market, 2019-2027 ($billion)
Figure 57.middle East Cloud Services Market, 2019-2027 ($billion)
Figure 58.africa Cloud Services Market, 2019-2027 ($billion)
Figure 59.key Player Positioning Anlysis: Global Cloud Services Market
Figure 60.top Winning Strategies, By Year, 2018-2020
Figure 61.top Winning Strategies, By Development, 2018-2020
Figure 62.top Winning Strategies, By Company, 2018-2020
Figure 63.competitive Dashboard
Figure 64.competitive Dashboard
Figure 65.competitive Heatmap Of Key Players
Figure 66.alibaba Group Holding Limited: Key Executives
Figure 67.alibaba Group Holding Limited: Revenue, 2017–2019 ($billion)
Figure 68.alibaba Group Holding Limited: Revenue Share By Segment, 2019 (%)
Figure 69.amazon.com, Inc.: Revenue, 2016–2018 ($billion)
Figure 70.amazon Web Services, Inc.: Revenue Share By Segment, 2018 (%)
Figure 71.amazon Web Services, Inc.: Revenue Share By Region, 2018 (%)
Figure 75.r&d Expenditure, 2016–2018 ($billion)
Figure 76.dell Technologies Inc.: Revenue, 2016–2018 ($billion)
Figure 77.dell Technologies Inc.: Revenue Share By Segment, 2018 (%)
Figure 78.dell Technologies Inc.: Revenue Share By Region, 2018 (%)
Figure 79.r&d Expenditure, 2016–2018 ($billion)
Figure 80.alphabet Inc.: Revenue, 2016–2018 ($billion)
Figure 81.alphabet Inc.: Revenue Share By Region, 2018 (%)
Figure 82.r&d Expenditure, 2016–2018 ($billion)
Figure 83.hewlett Packard Enterprise Development Lp: Revenue, 2016–2018 ($billion)
Figure 84.hewlett Packard Enterprise Development Lp: Revenue Share By Segment, 2018 (%)
Figure 85.r&d Expenditure, 2016–2018 ($billion)
Figure 86.international Business Machines Corporation: Revenue, 2016–2018 ($billion)
Figure 87.international Business Machines Corporation: Revenue Share By Segment, 2018 (%)
Figure 88.international Business Machines Corporation: Revenue Share By Region, 2018 (%)
Figure 89.r&d Expenditure, 2016–2018 ($billion)
Figure 90.microsoft Corporation: Revenue, 2016–2018 ($billion)
Figure 91.microsoft Corporation: Revenue Share By Segment, 2018 (%)
Figure 92.microsoft Corporation: Revenue Share By Region, 2018 (%)
Figure 93.r&d Expenditure, 2016–2018 ($billion)
Figure 94.oracle Corporation: Revenue, 2016–2018 ($billion)
Figure 95.oracle Corporation: Revenue Share By Segment, 2018 (%)
Figure 96.oracle Corporation: Revenue Share By Region, 2018 (%)
Figure 97.rackspace Hosting, Inc.: Key Executives
$5370
$8995
HAVE A QUERY?
OUR CUSTOMER
