
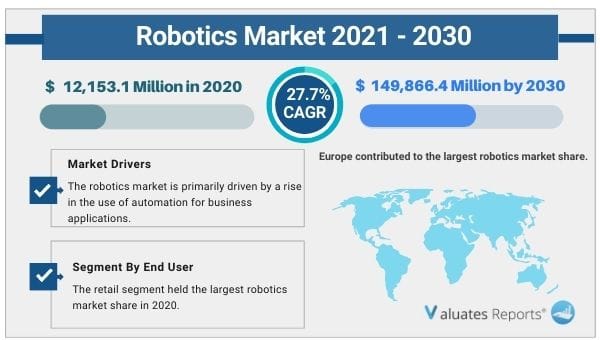
The global robotics market size was valued at $12,153.1 million in 2020, and is expected to reach $149,866.4 million by 2030, with a CAGR of 27.7% from 2021 to 2030. Key drivers of the robotics market are increasing demand for disinfection equipment and a rise in security, inspection, and delivery robots for commercial purposes. Moreover, growing R&D initiatives, increasing demand for robots, and robotic exhibitions are expected to propel the growth of the market during the forecast period. Further benefits offered such as low labor costs and increased efficiency are just some of the factors driving the growth of the robotics market during the forecast period.
There has been a sudden rise in disinfection robots after the outbreak of covid-19. These robots are being deployed in hospitals, airports, transportation sectors, hotels, restaurants, and other facilities for purifying the air and disinfecting surrounding environments. Further growing need for robots for security and delivery purposes in the commercial sector and the need to derive efficiency, ensure the safety of workers is leading to widescale adoption of robots ultimately surging the growth of the robotics market during the forecast period.
The demand for robotics is rising continuously along with increasing R&D initiatives for developing new technologies to make robots more efficient. Moreover, developers and innovators of robotics are increasingly attending robotic exhibitions for funding purposes to commercially enter the market. Thus growing R&D initiatives, robotic exhibitions, and the continuous commercialization of robots for rapid operation are fueling the demand for the robotics market during the forecast period.
Robots help in reducing labor costs in commercial, industrial, and residential facilities. They can easily replace human beings and provide continuous service without any interruptions leading to a huge improvement in efficiency. Also, robots can provide uninterrupted service and surveillance in healthcare, warehouse, retail stores, and other facilities. Further, the operating costs of managing robots are much lower than human wages. Thus huge efficiency, low labor costs, low operating costs, and growing adoption in a variety of industries are propelling the growth of the robotics market across the world.
Based on application, the security and inspection segment dominated the market in 2020 but the shelf-scanning segment is expected to create lucrative opportunities for growth in the robotics market share and will grow significantly at a CAGR of 46.5% during the forecast period.
Based on end-user, the retail segment dominated the market in 2020 but the others segment is expected to provide lucrative opportunities for growth in the robotics market share and will grow significantly during the forecast period.
Based on region, Europe is expected to provide lucrative opportunities for growth while the LAMEA region will be the fastest-growing segment during the forecast period.
|
Report Metric |
Details |
|
Report Name |
Robotics Market |
|
The market size in 2020 |
USD 12153.1 Million |
|
The revenue forecast in 2030 |
USD 149866.4 Million |
|
Growth Rate |
Compound Annual Growth Rate (CAGR) of 27.7% from 2021 to 2030 |
|
Market size available for years |
2021-2030 |
|
Forecast units |
Value (USD) |
|
Segments covered |
By End User, Application, and Region |
|
Report coverage |
Revenue & volume forecast, company share, competitive landscape, growth factors, and trends |
|
Geographic regions covered |
North America, Europe, Asia Pacific, Latin America, Middle East & Africa |
Ans. The global robotics market size was valued at US$ 12153.1 million in 2020 and is projected to reach US$ 149866.4 million by 2030.
Ans. The global Digital Twin market is expected to grow at a compound annual growth rate of 27.7% from 2021 to 2030.
Ans. Some of the major companies are Blue Ocean Robotics, Brain Corporation, Fetch Robotics, Inc., Honeywell International Inc., Motorola Solutions, Inc., RoboAds, Siemens, Simbe Robotics, Inc., SMP Robotics and Xenex Disinfection Services Inc.
CHAPTER 1:INTRODUCTION
1.1.Report description
1.2.Key Benefits for Stakeholders
1.3.Global Robotics Market Segments
1.4.Research methodology
1.4.1.Primary research
1.4.2.Secondary research
1.4.3.Analyst tools and models
CHAPTER 2:EXECUTIVE SUMMARY
2.1.CXO perspective
CHAPTER 3:MARKET OVERVIEW
3.1.Market definition and scope
3.2.Key findings
3.2.1.Top investment pockets
3.2.2.Market player positioning
3.3.Key forces shaping robotics industry
3.4.Market dynamics
3.4.1.Drivers
3.4.1.1.Rise in demand for disinfection equipment
3.4.1.2.Reduction of labor cost
3.4.1.3.Need for continuous surveillance devices
3.4.2.Restraints
3.4.2.1.High initial cost of robots
3.4.2.2.Lack of operating systems
3.4.3.Opportunity
3.4.3.1.Rise in funding for development of innovative robots
3.5.COVID-19 impact analysis
CHAPTER 4:ROBOTICS MARKET, BY APPLICATION
4.1.Market overview
4.1.1.Market size and forecast, by application
4.2.Disinfection
4.2.1.Key market trends, growth factors, and opportunities
4.2.2.Market size and forecast, by region
4.2.3.Market analysis, by country
4.3.Shelf scanning
4.3.1.Key market trends, growth factors, and opportunities
4.3.2.Market size and forecast, by region
4.3.3.Market analysis, by country
4.4.RFID scanning
4.4.1.Key market trends, growth factors, and opportunities
4.4.2.Market size and forecast, by region
4.4.3.Market analysis, by country
4.5.Delivery
4.5.1.Key market trends, growth factors, and opportunities
4.5.2.Market size and forecast, by region
4.5.3.Market analysis, by country
4.6.Security & inspection
4.6.1.Key market trends, growth factors, and opportunities
4.6.2.Market size and forecast, by region
4.6.3.Market analysis, by country
4.7.Advertising
4.7.1.Key market trends, growth factors, and opportunities
4.7.2.Market size and forecast, by region
4.7.3.Market analysis, by country
CHAPTER 5:ROBOTICS MARKET, BY END USER
5.1.Market overview
5.1.1.Market size and forecast, by end user
5.2.Automotive
5.2.1.Key market trends, growth factors, and opportunities
5.2.2.Market size and forecast, by region
5.2.3.Market analysis, by country
5.3.Retail
5.3.1.Key market trends, growth factors, and opportunities
5.3.2.Market size and forecast, by region
5.3.3.Market analysis, by country
5.4.Healthcare
5.4.1.Key market trends, growth factors, and opportunities
5.4.2.Market size and forecast, by region
5.4.3.Market analysis, by country
5.5.Electronics
5.5.1.Key market trends, growth factors, and opportunities
5.5.2.Market size and forecast, by region
5.5.3.Market analysis, by country
5.6.Others
5.6.1.Key market trends, growth factors, and opportunities
5.6.2.Market size and forecast, by region
5.6.3.Market analysis, by country
CHAPTER 6:ROBOTICS MARKET, BY REGION
6.1.Market overview
6.1.1.Market size and forecast, by region
6.2.North America
6.2.1.Key market trends, growth factors, and opportunities
6.2.2.Market size and forecast, by application
6.2.3.Market size and forecast, by end user
6.2.4.Market size and forecast, by country
6.2.4.1.U.S.
6.2.4.1.1.Market size and forecast, by application
6.2.4.1.2.Market size and forecast, by end user
6.2.4.2.Canada
6.2.4.2.1.Market size and forecast, by application
6.2.4.2.2.Market size and forecast, by end user
6.2.4.3.Mexico
6.2.4.3.1.Market size and forecast, by application
6.2.4.3.2.Market size and forecast, by end user
6.3.Europe
6.3.1.Key market trends, growth factors, and opportunities
6.3.2.Market size and forecast, by application
6.3.3.Market size and forecast, by end user
6.3.4.Market size and forecast, by country
6.3.4.1.Germany
6.3.4.1.1.Market size and forecast, by application
6.3.4.1.2.Market size and forecast, by end user
6.3.4.2.UK
6.3.4.2.1.Market size and forecast, by application
6.3.4.2.2.Market size and forecast, by end user
6.3.4.3.France
6.3.4.3.1.Market size and forecast, by application
6.3.4.3.2.Market size and forecast, by end user
6.3.4.4.Italy
6.3.4.4.1.Market size and forecast, by application
6.3.4.4.2.Market size and forecast, by end user
6.3.4.5.Rest of Europe
6.3.4.5.1.Market size and forecast, by application
6.3.4.5.2.Market size and forecast, by end user
6.4.Asia-Pacific
6.4.1.Key market trends, growth factors, and opportunities
6.4.2.Market size and forecast, by application
6.4.3.Market size and forecast, by end user
6.4.4.Market size and forecast, by country
6.4.4.1.China
6.4.4.1.1.Market size and forecast, by application
6.4.4.1.2.Market size and forecast, by end user
6.4.4.2.Japan
6.4.4.2.1.Market size and forecast, by application
6.4.4.2.2.Market size and forecast, by end user
6.4.4.3.South Korea
6.4.4.3.1.Market size and forecast, by application
6.4.4.3.2.Market size and forecast, by end user
6.4.4.4.India
6.4.4.4.1.Market size and forecast, by application
6.4.4.4.2.Market size and forecast, by end user
6.4.4.5.Rest of Asia-Pacific
6.4.4.5.1.Market size and forecast, by application
6.4.4.5.2.Market size and forecast, by end user
6.5.LAMEA
6.5.1.Key market trends, growth factors, and opportunities
6.5.2.Market size and forecast, by application
6.5.3.Market size and forecast, by end user
6.5.4.Market size and forecast, by country
6.5.4.1.Latin America
6.5.4.1.1.Market size and forecast, by application
6.5.4.1.2.Market size and forecast, by end user
6.5.4.2.Middle East
6.5.4.2.1.Market size and forecast, by application
6.5.4.2.2.Market size and forecast, by end user
6.5.4.3.Africa
6.5.4.3.1.Market size and forecast, by application
6.5.4.3.2.Market size and forecast, by end user
CHAPTER 7:COMPETITIVE LANDSCAPE
7.1.Introduction
7.2.Top winning strategies
7.2.1.Top winning strategies, by year
7.2.2.Top winning strategies, by development
7.2.3.Top winning strategies, by company
7.3.Key developments
7.3.1.Business expansion
7.3.2.Partnership
7.3.3.Agreement
7.3.4.Product launch
7.3.5.Acquisition
CHAPTER 8:COMPANY PROFILES
8.1.BLUE OCEAN ROBOTICS
8.1.1.Company overview
8.1.2.Key executives
8.1.3.Company snapshot
8.1.4.Operating business categories
8.1.5.Product portfolio
8.1.6.Key strategic moves and developments
8.2.BRAIN CORPORATION
8.2.1.Company overview
8.2.2.Key executives
8.2.3.Company snapshot
8.2.4.Operating Business Categories
8.2.5.Product portfolio
8.2.6.Key strategic moves and developments
8.3.FETCH ROBOTICS, INC.
8.3.1.Company overview
8.3.2.Key executives
8.3.3.Company snapshot
8.3.4.Operating Business categories
8.3.5.Product portfolio
8.3.6.Key strategic moves and developments
8.4.HONEYWELL INTERNATIONAL INC.
8.4.1.Company overview
8.4.2.Key executives
8.4.3.Company snapshot
8.4.4.Operating business segments
8.4.5.Product portfolio
8.4.6.R&D Expenditure
8.4.7.Business performance
8.5.MOTOROLA SOLUTIONS, INC.
8.5.1.Company overview
8.5.2.Key executives
8.5.3.Company snapshot
8.5.4.Operating business segments
8.5.5.Product portfolio
8.5.6.R&D Expenditure
8.5.7.Business performance
8.5.8.Key strategic moves and developments
8.6.ROBOADS
8.6.1.Company overview
8.6.2.Key executives
8.6.3.Company snapshot
8.6.4.Operating business categories
8.6.5.Product portfolio
8.6.6.Key strategic moves and developments
8.7.SIEMENS
8.7.1.Company overview
8.7.2.Key executives
8.7.3.Company snapshot
8.7.4.Operating business segments
8.7.5.Product portfolio
8.7.6.R&D Expenditure
8.7.7.Business performance
8.7.8.Key strategic moves and developments
8.8.SIMBE ROBOTICS, INC.
8.8.1.Company overview
8.8.2.Key executives
8.8.3.Company snapshot
8.8.4.Operating business categories
8.8.5.Product portfolio
8.8.6.Key strategic moves and developments
8.9.SMP ROBOTICS
8.9.1.Company overview
8.9.2.Key executives
8.9.3.Company snapshot
8.9.4.Operating business categories
8.9.5.Product portfolio
8.9.6.Key strategic moves and developments
8.10.XENEX DISINFECTION SERVICES INC.
8.10.1.Company overview
8.10.2.Key executives
8.10.3.Company snapshot
8.10.4.Operating business categories
8.10.5.Product portfolio
8.10.6.Key strategic moves and developments
LIST OF TABLES
TABLE 01.ROBOTICS MARKET REVENUE, BY APPLICATION, 2020–2030 ($MILLION)
TABLE 02.ROBOTICS MARKET REVENUE FOR DISINFECTION, BY REGION, 2020–2030 ($MILLION)
TABLE 03.ROBOTICS MARKET REVENUE FOR SHELF SCANNING, BY REGION, 2020–2030 ($MILLION)
TABLE 04.ROBOTICS MARKET REVENUE FOR RFID SCANNING, BY REGION, 2020–2030 ($MILLION)
TABLE 05.ROBOTICS MARKET REVENUE FOR DELIVERY, BY REGION, 2020–2030 ($MILLION)
TABLE 06.ROBOTICS MARKET REVENUE FOR SECURITY & INSPECTION, BY REGION, 2020–2030 ($MILLION)
TABLE 07.ROBOTICS MARKET REVENUE FOR ADVERTISING, BY REGION, 2020–2030 ($MILLION)
TABLE 08.ROBOTICS MARKET REVENUE, BY END USER, 2020–2030 ($MILLION)
TABLE 09.ROBOTICS MARKET REVENUE FOR AUTOMOTIVE, BY REGION, 2020–2030 ($MILLION)
TABLE 10.ROBOTICS MARKET REVENUE FOR RETAIL, BY REGION, 2020–2030 ($MILLION)
TABLE 11.ROBOTICS MARKET REVENUE FOR HEALTHCARE, BY REGION, 2020–2030 ($MILLION)
TABLE 12.ROBOTICS MARKET REVENUE FOR ELECTRONICS, BY REGION, 2020–2030 ($MILLION)
TABLE 13.ROBOTICS MARKET REVENUE FOR OTHERS, BY REGION, 2020–2030 ($MILLION)
TABLE 14.ROBOTICS MARKET, BY REGION, 2020–2030 ($MILLION)
TABLE 15.NORTH AMERICA ROBOTICS MARKET, BY APPLICATION, 2020–2030 ($MILLION)
TABLE 16.NORTH AMERICA ROBOTICS MARKET, BY END USER, 2020–2030 ($MILLION)
TABLE 17.NORTH AMERICA ROBOTICS MARKET, BY COUNTRY, 2020–2030 ($MILLION)
TABLE 18.U.S. ROBOTICS MARKET, BY APPLICATION, 2020–2030 ($MILLION)
TABLE 19.U.S. ROBOTICS MARKET, BY END USER, 2020–2030 ($MILLION)
TABLE 20.CANADA ROBOTICS MARKET, BY APPLICATION, 2020–2030 ($MILLION)
TABLE 21.CANADA ROBOTICS MARKET, BY END USER, 2020–2030 ($MILLION)
TABLE 22.MEXICO ROBOTICS MARKET, BY APPLICATION, 2020–2030 ($MILLION)
TABLE 23.MEXICO ROBOTICS MARKET, BY END USER, 2020–2030 ($MILLION)
TABLE 24.EUROPE ROBOTICS MARKET, BY APPLICATION, 2020–2030 ($MILLION)
TABLE 25.EUROPE ROBOTICS MARKET, BY END USER, 2020–2030 ($MILLION)
TABLE 26.EUROPE ROBOTICS MARKET, BY COUNTRY, 2020–2030 ($MILLION)
TABLE 27.GERMANY ROBOTICS MARKET, BY APPLICATION, 2020–2030 ($MILLION)
TABLE 28.GERMANY ROBOTICS MARKET, BY END USER, 2020–2030 ($MILLION)
TABLE 29.UK ROBOTICS MARKET, BY APPLICATION, 2020–2030 ($MILLION)
TABLE 30.UK ROBOTICS MARKET, BY END USER, 2020–2030 ($MILLION)
TABLE 31.FRANCE ROBOTICS MARKET, BY APPLICATION, 2020–2030 ($MILLION)
TABLE 32.FRANCE ROBOTICS MARKET, BY END USER, 2020–2030 ($MILLION)
TABLE 33.ITALY ROBOTICS MARKET, BY APPLICATION, 2020–2030 ($MILLION)
TABLE 34.ITALY ROBOTICS MARKET, BY END USER, 2020–2030 ($MILLION)
TABLE 35.REST OF EUROPE ROBOTICS MARKET, BY APPLICATION, 2020–2030 ($MILLION)
TABLE 36.REST OF EUROPE ROBOTICS MARKET, BY END USER, 2020–2030 ($MILLION)
TABLE 37.ASIA-PACIFIC ROBOTICS MARKET, BY APPLICATION, 2020–2030 ($MILLION)
TABLE 38.ASIA-PACIFIC ROBOTICS MARKET, BY END USER, 2020–2030 ($MILLION)
TABLE 39.ASIA-PACIFIC ROBOTICS MARKET, BY COUNTRY, 2020–2030 ($MILLION)
TABLE 40.CHINA ROBOTICS MARKET, BY APPLICATION, 2020–2030 ($MILLION)
TABLE 41.CHINA ROBOTICS MARKET, BY END USER, 2020–2030 ($MILLION)
TABLE 42.JAPAN ROBOTICS MARKET, BY APPLICATION, 2020–2030 ($MILLION)
TABLE 43.JAPAN ROBOTICS MARKET, BY END USER, 2020–2030 ($MILLION)
TABLE 44.SOUTH KOREA ROBOTICS MARKET, BY APPLICATION, 2020–2030 ($MILLION)
TABLE 45.SOUTH KOREA ROBOTICS MARKET, BY END USER, 2020–2030 ($MILLION)
TABLE 46.INDIA ROBOTICS MARKET, BY APPLICATION, 2020–2030 ($MILLION)
TABLE 47.INDIA ROBOTICS MARKET, BY END USER, 2020–2030 ($MILLION)
TABLE 48.REST OF ASIA-PACIFIC ROBOTICS MARKET, BY APPLICATION, 2020–2030 ($MILLION)
TABLE 49.REST OF ASIA-PACIFIC ROBOTICS MARKET, BY END USER, 2020–2030 ($MILLION)
TABLE 50.LAMEA ROBOTICS MARKET, BY APPLICATION, 2020–2030 ($MILLION)
TABLE 51.LAMEA ROBOTICS MARKET, BY END USER, 2020–2030 ($MILLION)
TABLE 52.LAMEA ROBOTICS MARKET, BY COUNTRY, 2020–2030 ($MILLION)
TABLE 53.LATIN AMERICA ROBOTICS MARKET, BY APPLICATION, 2020–2030 ($MILLION)
TABLE 54.LATIN AMERICA ROBOTICS MARKET, BY END USER, 2020–2030 ($MILLION)
TABLE 55.MIDDLE EAST ROBOTICS MARKET, BY APPLICATION, 2020–2030 ($MILLION)
TABLE 56.MIDDLE EAST ROBOTICS MARKET, BY END USER, 2020–2030 ($MILLION)
TABLE 57.AFRICA ROBOTICS MARKET, BY APPLICATION, 2020–2030 ($MILLION)
TABLE 58.AFRICA ROBOTICS MARKET, BY END USER, 2020–2030 ($MILLION)
TABLE 59.KEY BUSINESS EXPANSION, (2019–2021)
TABLE 60.KEY PARTNERSHIP, (2019–2021)
TABLE 61.KEY AGREEMENT, (2019–2021)
TABLE 62.KEY PRODUCT LAUNCH, (2019–2021)
TABLE 63.KEY ACQUISITION, (2019–2021)
TABLE 64.BLUE OCEAN ROBOTICS: KEY EXECUTIVES
TABLE 65.BLUE OCEAN ROBOTICS: COMPANY SNAPSHOT
TABLE 66.BLUE OCEAN ROBOTICS: BUSINESS CATEGORIES
TABLE 67.BLUE OCEAN ROBOTICS: PRODUCT PORTFOLIO
TABLE 68.BRAIN CORPORATION: KEY EXECUTIVES
TABLE 69.BRAIN CORPORATION: COMPANY SNAPSHOT
TABLE 70.BRAIN CORPORATION: BUSINESS CATEGORIES
TABLE 71.BRAIN CORPORATION: PRODUCT PORTFOLIO
TABLE 72.FETCH ROBOTICS, INC.: KEY EXECUTIVES
TABLE 73.FETCH ROBOTICS, INC.: COMPANY SNAPSHOT
TABLE 74.FETCH ROBOTICS, INC.: BUSINESS CATEGORIES
TABLE 75.FETCH ROBOTICS, INC.: PRODUCT PORTFOLIO
TABLE 76.HONEYWELL INTERNATIONAL INC.: KEY EXECUTIVES
TABLE 77.HONEYWELL INTERNATIONAL INC.: COMPANY SNAPSHOT
TABLE 78.HONEYWELL INTERNATIONAL INC.: OPERATING SEGMENTS
TABLE 79.HONEYWELL INTERNATIONAL INC.: PRODUCT PORTFOLIO
TABLE 80.MOTOROLA SOLUTIONS, INC.: KEY EXECUTIVES
TABLE 81.MOTOROLA SOLUTIONS, INC.: COMPANY SNAPSHOT
TABLE 82.MOTOROLA SOLUTIONS, INC.: OPERATING SEGMENTS
TABLE 83.MOTOROLA SOLUTIONS, INC.: PRODUCT PORTFOLIO
TABLE 84.ROBOADS: KEY EXECUTIVES
TABLE 85.ROBOADS: COMPANY SNAPSHOT
TABLE 86.ROBOADS: BUSINESS CATEGORIES
TABLE 87.ROBOADS: PRODUCT PORTFOLIO
TABLE 88.SIEMENS: KEY EXECUTIVES
TABLE 89.SIEMENS: COMPANY SNAPSHOT
TABLE 90.SIEMENS: OPERATING SEGMENTS
TABLE 91.SIEMENS: PRODUCT PORTFOLIO
TABLE 92.SIMBE ROBOTICS, INC.: KEY EXECUTIVES
TABLE 93.SIMBE ROBOTICS, INC.: COMPANY SNAPSHOT
TABLE 94.SIMBE ROBOTICS, INC.: BUSINESS CATEGORIES
TABLE 95.SIMBE ROBOTICS, INC.: PRODUCT PORTFOLIO
TABLE 96.SMP ROBOTICS: KEY EXECUTIVES
TABLE 97.SMP ROBOTICS: COMPANY SNAPSHOT
TABLE 98.SMP ROBOTICS: PRODUCT PORTFOLIO
TABLE 99.XENEX DISINFECTION SERVICES INC.: KEY EXECUTIVES
TABLE 100.XENEX DISINFECTION SERVICES INC.: COMPANY SNAPSHOT
TABLE 101.XENEX DISINFECTION SERVICES INC.: PRODUCT PORTFOLIO
LIST OF FIGURES
FIGURE 01.KEY MARKET SEGMENTS
FIGURE 02.GLOBAL ROBOTICS MARKET SNAPSHOT, 2020–2030
FIGURE 03.ROBOTICS MARKET SNAPSHOT, BY COUNTRY, 2020–2030
FIGURE 04.GLOBAL ROBOTICS MARKET: KEY PLAYERS
FIGURE 05.TOP INVESTMENT POCKETS
FIGURE 06.MARKET PLAYER POSITIONING
FIGURE 07.LOW-TO-MODERATE BARGAINING POWER OF SUPPLIERS
FIGURE 08.MODERATE-TO-HIGH THREAT OF NEW ENTRANTS
FIGURE 09.MODERATE-TO-HIGH THREAT OF SUBSTITUTES
FIGURE 10.MODERATE BARGAINING POWER OF BUYERS
FIGURE 11.LOW INTENSITY OF RIVALRY
FIGURE 12.MARKET DYNAMICS
FIGURE 13.ROBOTICS MARKET, BY APPLICATION, 2020–2030
FIGURE 14.COMPARATIVE SHARE ANALYSIS OF ROBOTICS MARKET FOR DISINFECTION, BY COUNTRY, 2020 & 2030 (%)
FIGURE 15.COMPARATIVE SHARE ANALYSIS OF ROBOTICS MARKET FOR SHELF SCANNING, BY COUNTRY, 2020 & 2030 (%)
FIGURE 16.COMPARATIVE SHARE ANALYSIS OF ROBOTICS MARKET FOR RFID SCANNING, BY COUNTRY, 2020 & 2030 (%)
FIGURE 17.COMPARATIVE SHARE ANALYSIS OF ROBOTICS MARKET FOR DELIVERY, BY COUNTRY, 2020 & 2030 (%)
FIGURE 18.COMPARATIVE SHARE ANALYSIS OF ROBOTICS MARKET FOR SECURITY & INSPECTION, BY COUNTRY, 2020 & 2030 (%)
FIGURE 19.COMPARATIVE SHARE ANALYSIS OF ROBOTICS MARKET FOR ADVERTISING, BY COUNTRY, 2020 & 2030 (%)
FIGURE 20.ROBOTICS MARKET, BY END USER, 2020–2030
FIGURE 21.COMPARATIVE SHARE ANALYSIS OF ROBOTICS MARKET FOR AUTOMOTIVE, BY COUNTRY, 2020 & 2030 (%)
FIGURE 22.COMPARATIVE SHARE ANALYSIS OF ROBOTICS MARKET FOR RETAIL, BY COUNTRY, 2020 & 2030 (%)
FIGURE 23.COMPARATIVE SHARE ANALYSIS OF ROBOTICS MARKET FOR HEALTHCARE, BY COUNTRY, 2020 & 2030 (%)
FIGURE 24.COMPARATIVE SHARE ANALYSIS OF ROBOTICS MARKET FOR ELECTRONICS, BY COUNTRY, 2020 & 2030 (%)
FIGURE 25.COMPARATIVE SHARE ANALYSIS OF ROBOTICS MARKET FOR OTHERS, BY COUNTRY, 2020 & 2030 (%)
FIGURE 26.ROBOTICS MARKET, BY REGION, 2020–2030
FIGURE 27.U.S. ROBOTICS MARKET REVENUE, 2020–2030 ($MILLION)
FIGURE 28.CANADA ROBOTICS MARKET REVENUE, 2020–2030 ($MILLION)
FIGURE 29.MEXICO ROBOTICS MARKET REVENUE, 2020–2030 ($MILLION)
FIGURE 30.GERMANY ROBOTICS MARKET REVENUE, 2020–2030 ($MILLION)
FIGURE 31.UK ROBOTICS MARKET REVENUE, 2020–2030 ($MILLION)
FIGURE 32.FRANCE ROBOTICS MARKET REVENUE, 2020–2030 ($MILLION)
FIGURE 33.ITALY ROBOTICS MARKET REVENUE, 2020–2030 ($MILLION)
FIGURE 34.REST OF EUROPE ROBOTICS MARKET REVENUE, 2020–2030 ($MILLION)
FIGURE 35.CHINA ROBOTICS MARKET REVENUE, 2020–2030 ($MILLION)
FIGURE 36.JAPAN ROBOTICS MARKET REVENUE, 2020–2030 ($MILLION)
FIGURE 37.SOUTH KOREA ROBOTICS MARKET REVENUE, 2020–2030 ($MILLION)
FIGURE 38.INDIA ROBOTICS MARKET REVENUE, 2020–2030 ($MILLION)
FIGURE 39.REST OF ASIA-PACIFIC ROBOTICS MARKET REVENUE, 2020–2030 ($MILLION)
FIGURE 40.LATIN AMERICA ROBOTICS MARKET REVENUE, 2020–2030 ($MILLION)
FIGURE 41.MIDDLE EAST ROBOTICS MARKET REVENUE, 2020–2030 ($MILLION)
FIGURE 42.AFRICA ROBOTICS MARKET REVENUE, 2020–2030 ($MILLION)
FIGURE 43.TOP WINNING STRATEGIES, BY YEAR, 2019–2021
FIGURE 44.TOP WINNING STRATEGIES, BY DEVELOPMENT, 2019–2021 (%)
FIGURE 45.TOP WINNING STRATEGIES, BY COMPANY, 2019–2021
FIGURE 46.HONEYWELL INTERNATIONAL INC.: R&D EXPENDITURE, 2018–2020 ($MILLION)
FIGURE 47.HONEYWELL INTERNATIONAL INC.: NET SALES, 2018–2020 ($MILLION)
FIGURE 48.HONEYWELL INTERNATIONAL INC.: REVENUE SHARE BY SEGMENT, 2020 (%)
FIGURE 49.HONEYWELL INTERNATIONAL INC.: REVENUE SHARE BY REGION, 2020 (%)
FIGURE 50.MOTOROLA SOLUTIONS, INC.: R&D EXPENDITURE, 2018–2020 ($MILLION)
FIGURE 51.MOTOROLA SOLUTIONS, INC.: NET SALES, 2018–2020 ($MILLION)
FIGURE 52.MOTOROLA SOLUTIONS, INC.: REVENUE SHARE BY SEGMENT, 2020 (%)
FIGURE 53.MOTOROLA SOLUTIONS, INC.: REVENUE SHARE BY REGION, 2020 (%)
FIGURE 54.SIEMENS: R&D EXPENDITURE, 2018–2020 ($MILLION)
FIGURE 55.SIEMENS: NET SALES, 2018–2020 ($MILLION)
FIGURE 56.SIEMENS: REVENUE SHARE BY SEGMENT, 2020 (%)
FIGURE 57.SIEMENS: REVENUE SHARE BY REGION, 2020 (%)
$5769
$6450
$9995
HAVE A QUERY?
OUR CUSTOMER

SIMILAR REPORTS
Add to Cart
Add to Cart
Add to Cart
Add to Cart