
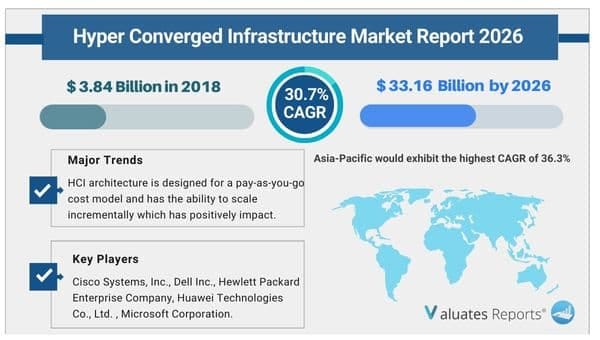
The hyper-converged infrastructure market size was valued at USD 3.84 Billion in 2018, and is projected to reach USD 33.16 Billion by 2026, growing at a CAGR of 30.7% from 2019 to 2026.
Hyper-converged infrastructure (HCI) is a single system framework that includes storage, computing, and network resources that help companies to easily deploy and manage with a single user interface.
Hyper-converged infrastructure (HCI) is a single system framework that includes storage, computing, and network resources that help companies to easily deploy and manage a single user interface. Major drivers for the growth of Hyper-Converged Infrastructure market size include advantages such as decreased capital investment and operating expenditure and flexibility for recovery from disasters.
This study includes the market opportunity, analysis, trends, and future estimations to determine the imminent investment pockets. The HYPER-CONVERGED INFRASTRUCTURE market report presents key drivers, restraints, and opportunities for the hyper-converged infrastructure industry.
The HCI market in North America dominated in terms of revenue share in 2018. Rise in shift toward innovative technology that provides cloud-like economics for existing data centers without the need to compromise in its performance, availability, or reliability is a major factor that drives the adoption of HCI market in the region. This allows HCI adopters to witness improved operational efficiency, scalability, and accelerated deployment time.
The report focuses on the HCI market growth prospects, restraints, and analysis. The study provides Porter’s five forces analysis of the hyper-converged infrastructure industry to understand the impact of various factors such as bargaining power of suppliers, competitive intensity of competitors, threat of new entrants, threat of substitutes, and bargaining power of buyers on the market.
Major players operating in the HCI market have witnessed high growth in demand for hyper-converged infrastructure, especially due to on-going data center modernization projects or initiatives among the data center industry across the globe. This study includes hyper-converged infrastructure market analysis, trends, and future estimations to determine the imminent investment pockets.
Several businesses around the world are moving their entire IT infrastructure into the cloud because it offers a high degree of versatility. There are risks associated with storing data on the public cloud for an organization, though. Because these systems are easy to administer and help reduce the costs associated with conventional data center systems, HCI solutions are rapidly emerging as the perfect alternative to public cloud services such as Azure or AWS.
|
Report Metric |
Details |
|
Report Name |
Hyper Converged Infrastructure Market |
|
Market size value in 2018 |
USD 3.84 Billion |
|
Revenue forecast in 2026 |
USD 33.16 Billion |
|
Growth Rate |
CAGR of 30.7% |
|
Base year considered |
2028 |
|
Forecast Period |
2019-2026 |
|
By Component |
Software and Services |
|
By Application |
Remote Office Or Branch Office, Virtualization Desktop Infrastructure (VDI), Data Center Consolidation, Backup Recovery / Disaster Recovery, Critical Applications Virtualization |
|
Report Coverage |
Revenue & volume forecast, company share, competitive landscape, growth factors, and trends |
|
Segments Covered |
By Type, Application, and Region |
|
Geographic Regions Covered |
North America, Europe, Asia Pacific, Latin America, Middle East & Africa |
Ans. The hyper-converged infrastructure market size was valued at $3.84 billion in 2018, and is projected to reach $33.16 billion by 2026, growing at a CAGR of 30.7% from 2019 to 2026.
Ans. The key players operating in the global hyper-converged infrastructure market forecast include Cisco Systems, Inc., Dell Inc., Hewlett Packard Enterprise Company, Huawei Technologies Co., Ltd. , Microsoft Corporation
Ans. Yes, the report includes a COVID-19 impact analysis. Also, it is further extended into every individual segment of the report.
CHAPTER 1: INTRODUCTION
1.1. Report description
1.2. Key benefits for stakeholders
1.3. Key market segments
1.4. Key market players
1.5. Research methodology
1.5.1. Secondary research
1.5.2. Primary research
1.5.3. Analyst tools & models
CHAPTER 2: EXECUTIVE SUMMARY
2.1. Key findings
2.1.1. Top impacting factors
2.1.2. Top investment pockets
2.2. CXO perspective
CHAPTER 3: MARKET OVERVIEW
3.1. Market definition and scope
3.2. Key forces shaping the global Hyper-Converged Infrastructure market
3.3. Market dynamics
3.3.1. Drivers
3.3.1.1. Growing need for data protection and disaster recovery
3.3.1.2. Reduction in Capital Expenditure (CAPEX) and Operational Expenditure (OPEX)
3.3.2. Restraints
3.3.2.1. Vendor lock-In
3.3.3. Opportunities
3.3.3.1. Rise in investments in data center infrastructures
3.4. Industry roadmap of hyper-converged infrastructure
3.5. Impact of government regulations on the global hyper-converged infrastructure market
CHAPTER 4: GLOBAL HYPER-CONVERGED INFRASTRUCTURE MARKET, BY COMPONENT
4.1. Overview
4.2. Hardware
4.2.1. Key market trends, growth factors, and opportunities
4.2.2. Market size and forecast, by region
4.2.3. Market analysis, by country
4.3. Software
4.3.1. Key market trends, growth factors, and opportunities
4.3.2. Market size and forecast, by region
4.3.3. Market analysis, by country
CHAPTER 5: GLOBAL HYPER-CONVERGED INFRASTRUCTURE MARKET, BY APPLICATION
5.1. Overview
5.2. Remote Office/ Branch Office
5.2.1. Key market trends, growth factors, and opportunities
5.2.2. Market size and forecast, by region
5.2.3. Market analysis, by country
5.3. Virtualization desktop infrastructure
5.3.1. Key market trends, growth factors, and opportunities
5.3.2. Market size and forecast, by region
5.3.3. Market analysis, by country
5.4. Data center consolidation
5.4.1. Key market trends, growth factors, and opportunities
5.4.2. Market size and forecast, by region
5.4.3. Market analysis, by country
5.5. Backup Recovery/ Disaster Recovery
5.5.1. Key market trends, growth factors, and opportunities
5.5.2. Market size and forecast, by region
5.5.3. Market analysis, by country
5.6. Virtualizing critical applications
5.6.1. Key market trends, growth factors, and opportunities
5.6.2. Market size and forecast, by region
5.6.3. Market analysis, by country
5.7. Others
5.7.1. Key market trends, growth factors, and opportunities
5.7.2. Market size and forecast, by region
5.7.3. Market analysis, by country
CHAPTER 6: GLOBAL HYPER-CONVERGED INFRASTRUCTURE MARKET, BY INDUSTRY VERTICAL
6.1. Overview
6.2. BFSI
6.2.1. Key market trends, growth factors, and opportunities
6.2.2. Market size and forecast, by region
6.2.3. Market analysis, by country
6.3. IT & Telecommunications
6.3.1. Key market trends, growth factors, and opportunities
6.3.2. Market size and forecast, by region
6.3.3. Market analysis, by country
6.4. Government
6.4.1. Key market trends, growth factors, and opportunities
6.4.2. Market size and forecast, by region
6.4.3. Market analysis, by country
6.5. Healthcare
6.5.1. Key market trends, growth factors, and opportunities
6.5.2. Market size and forecast, by region
6.5.3. Market analysis, by country
6.6. Manufacturing
6.6.1. Key market trends, growth factors, and opportunities
6.6.2. Market size and forecast, by region
6.6.3. Market analysis, by country
6.7. Energy & Utilities
6.7.1. Key market trends, growth factors, and opportunities
6.7.2. Market size and forecast, by region
6.7.3. Market analysis, by country
6.8. Education
6.8.1. Key market trends, growth factors, and opportunities
6.8.2. Market size and forecast, by region
6.8.3. Market analysis, by country
6.9. Others
6.9.1. Key market trends, growth factors, and opportunities
6.9.2. Market size and forecast, by region
6.9.3. Market analysis, by country
CHAPTER 7: GLOBAL HYPER-CONVERGED INFRASTRUCTURE MARKET, BY REGION
7.1. Overview
7.1.1. Market size and forecast, by region
7.2. North America
7.2.1. Key market trends, growth factors, and opportunities
7.2.2. Market size and forecast, by component
7.2.3. Market size and forecast, by Application
7.2.4. Market size and forecast, by industry vertical
7.2.5. Market analysis, by country
7.2.5.1. U.S.
7.2.5.1.1. Market size and forecast, by component
7.2.5.1.2. Market size and forecast, by Application
7.2.5.1.3. Market size and forecast, by industry vertical
7.2.5.2. Canada
7.2.5.2.1. Market size and forecast, by component
7.2.5.2.2. Market size and forecast, by Application
7.2.5.2.3. Market size and forecast, by industry vertical
7.3. Europe
7.3.1. Key market trends, growth factors, and opportunities
7.3.2. Market size and forecast, by component
7.3.3. Market size and forecast, by Application
7.3.4. Market size and forecast, by industry vertical
7.3.5. Market analysis, by country
7.3.5.1. Germany
7.3.5.1.1. Market size and forecast, by component
7.3.5.1.2. Market size and forecast, by Application
7.3.5.1.3. Market size and forecast, by industry vertical
7.3.5.2. UK
7.3.5.2.1. Market size and forecast, by component
7.3.5.2.2. Market size and forecast, by Application
7.3.5.2.3. Market size and forecast, by industry vertical
7.3.5.3. France
7.3.5.3.1. Market size and forecast, by component
7.3.5.3.2. Market size and forecast, by Application
7.3.5.3.3. Market size and forecast, by industry vertical
7.3.5.4. Rest of Europe
7.3.5.4.1. Market size and forecast, by component
7.3.5.4.2. Market size and forecast, by Application
7.3.5.4.3. Market size and forecast, by industry vertical
7.4. Asia-Pacific
7.4.1. Key market trends, growth factors, and opportunities
7.4.2. Market size and forecast, by component
7.4.3. Market size and forecast, by Application
7.4.4. Market size and forecast, by industry vertical
7.4.5. Market analysis, by country
7.4.5.1. Japan
7.4.5.1.1. Market size and forecast, by component
7.4.5.1.2. Market size and forecast, by Application
7.4.5.1.3. Market size and forecast, by industry vertical
7.4.5.2. China
7.4.5.2.1. Market size and forecast, by component
7.4.5.2.2. Market size and forecast, by Application
7.4.5.2.3. Market size and forecast, by industry vertical
7.4.5.3. India
7.4.5.3.1. Market size and forecast, by component
7.4.5.3.2. Market size and forecast, by Application
7.4.5.3.3. Market size and forecast, by industry vertical
7.4.5.4. Rest of Asia-Pacific
7.4.5.4.1. Market size and forecast, by component
7.4.5.4.2. Market size and forecast, by Application
7.4.5.4.3. Market size and forecast, by industry vertical
7.5. LAMEA
7.5.1. Key market trends, growth factors, and opportunities
7.5.2. Market size and forecast, by component
7.5.3. Market size and forecast, by Application
7.5.4. Market size and forecast, by industry vertical
7.5.5. Market analysis, by country
7.5.5.1. Latin America
7.5.5.1.1. Market size and forecast, by component
7.5.5.1.2. Market size and forecast, by Application
7.5.5.1.3. Market size and forecast, by industry vertical
7.5.5.2. Middle East
7.5.5.2.1. Market size and forecast, by component
7.5.5.2.2. Market size and forecast, by Application
7.5.5.2.3. Market size and forecast, by industry vertical
7.5.5.3. Africa
7.5.5.3.1. Market size and forecast, by component
7.5.5.3.2. Market size and forecast, by Application
7.5.5.3.3. Market size and forecast, by industry vertical
CHAPTER 8: COMPETITIVE LANDSCAPE
8.1. Key players positioning analysis, 2018
8.2. Top winning strategies
8.3. Competitive dashboard
8.4. Key developments
8.4.1. Product launches
8.4.2. Collaboration
8.4.3. Partnership
8.4.4. Product development
8.4.5. Business expansion
8.4.6. Acquisition
8.5. Patent analysis
8.5.1. By region (2016-2019)
8.5.2. By applicant
CHAPTER 9: COMPANY PROFILE
9.1. Dell, Technologies Inc.
9.1.1. Company overview
9.1.2. Key executives
9.1.3. Company snapshot
9.1.4. Operating business segments
9.1.5. Product portfolio
9.1.6. R&D expenditure
9.1.7. Business performance
9.1.8. Key strategic moves and developments
9.2. HEWLETT PACKARD ENTERPRISE DEVELOPMENT LP
9.2.1. Company overview
9.2.2. Key executives
9.2.3. Company snapshot
9.2.4. Operating business segments
9.2.5. Product portfolio
9.2.6. R&D expenditure
9.2.7. Business performance
9.2.8. Key strategic moves and developments
9.3. Huawei Technologies Co., Ltd.
9.3.1. Company overview
9.3.2. Key Executives
9.3.3. Company snapshot
9.3.4. Operating business segments
9.3.5. Product portfolio
9.3.6. R&D Expenditure
9.3.7. Business performance
9.3.8. Key strategic moves and developments
9.4. Microsoft Corporation
9.4.1. Company overview
9.4.2. Key executives
9.4.3. Company snapshot
9.4.4. Operating business segments
9.4.5. Product portfolio
9.4.6. R&D Expenditure
9.4.7. Business performance
9.4.8. Key strategic moves and developments
9.5. Netapp, Inc.
9.5.1. Company overview
9.5.2. Key executives
9.5.3. Company snapshot
9.5.4. Operating business segments
9.5.5. Product portfolio
9.5.6. R&D expenditure
9.5.7. Business performance
9.5.8. Key strategic moves and developments
9.6. Nutanix, Inc.
9.6.1. Company overview
9.6.2. Key Executives
9.6.3. Company snapshot
9.6.4. Product portfolio
9.6.5. R&D expenditure
9.6.6. Business performance
9.6.7. Key strategic moves and developments
9.7. Pivot3
9.7.1. Company overview
9.7.2. Key Executives
9.7.3. Company snapshot
9.7.4. Product portfolio
9.7.5. Key strategic moves and developments
9.8. Scale Computing
9.8.1. Company overview
9.8.2. Key Executives
9.8.3. Company snapshot
9.8.4. Product portfolio
9.8.5. Key strategic moves and developments
9.9. VMware, Inc.
9.9.1. Company overview
9.9.2. Key Executives
9.9.3. Company snapshot
9.9.4. Product portfolio
9.9.5. Business performance
9.9.6. Key strategic moves and developments
LIST OF TABLES
TABLE 01. GLOBAL HYPER-CONVERGED INFRASTRUCTURE MARKET REVENUE, BY COMPONENT, 2018-2026 ($MILLION)
TABLE 02. GLOBAL HYPER-CONVERGED INFRASTRUCTURE MARKET REVENUE FOR HARDWARE, BY REGION 2018–2026 ($MILLION)
TABLE 03. GLOBAL HYPER-CONVERGED INFRASTRUCTURE MARKET REVENUE FOR SOFTWARE, BY REGION 2018–2026 ($MILLION)
TABLE 04. GLOBAL HYPER-CONVERGED INFRASTRUCTURE MARKET, BY APPLICATION, 2018–2026 ($MILLION)
TABLE 05. GLOBAL HYPER-CONVERGED INFRASTRUCTURE MARKET REVENUE FOR REMOTE OFFICE/ BRANCH OFFICE, BY REGION, 2018–2026 ($MILLION)
TABLE 06. GLOBAL HYPER-CONVERGED INFRASTRUCTURE MARKET REVENUE FOR VIRTUALIZATION DESKTOP INFRASTRUCTURE, BY REGION, 2018–2026 ($MILLION)
TABLE 07. GLOBAL HYPER-CONVERGED INFRASTRUCTURE MARKET REVENUE FOR DATA CENTER CONSOLIDATION, BY REGION, 2018–2026 ($MILLION)
TABLE 08. GLOBAL HYPER-CONVERGED INFRASTRUCTURE MARKET REVENUE FOR BACKUP RECOVERY/ DISASTER RECOVERY, BY REGION, 2018–2026 ($MILLION)
TABLE 09. GLOBAL HYPER-CONVERGED INFRASTRUCTURE MARKET REVENUE FOR VIRTUALIZING CRITICAL APPLICATIONS, BY REGION, 2018–2026 ($MILLION)
TABLE 10. GLOBAL HYPER-CONVERGED INFRASTRUCTURE MARKET REVENUE FOR OTHERS, BY REGION, 2018–2026 ($MILLION)
TABLE 11. GLOBAL HYPER-CONVERGED INFRASTRUCTURE MARKET REVENUE, BY INDUSTRY VERTICAL, 2018-2026 ($MILLION)
TABLE 12. GLOBAL HYPER-CONVERGED INFRASTRUCTURE MARKET REVENUE FOR BFSI, BY REGION 2018–2026 ($MILLION)
TABLE 13. GLOBAL HYPER-CONVERGED INFRASTRUCTURE MARKET REVENUE FOR IT & TELECOMMUNICATIONS , BY REGION 2018–2026 ($MILLION)
TABLE 14. GLOBAL HYPER-CONVERGED INFRASTRUCTURE MARKET REVENUE FOR GOVERNMENT, BY REGION 2018–2026 ($MILLION)
TABLE 15. GLOBAL HYPER-CONVERGED INFRASTRUCTURE MARKET REVENUE FOR HEALTHCARE, BY REGION 2018–2026 ($MILLION)
TABLE 16. GLOBAL HYPER-CONVERGED INFRASTRUCTURE MARKET REVENUE FOR MANUFACTURING, BY REGION, 2018–2026 ($MILLION)
TABLE 17. GLOBAL HYPER-CONVERGED INFRASTRUCTURE MARKET REVENUE FOR ENERGY & UTILITIES, BY REGION 2018–2026 ($MILLION)
TABLE 18. GLOBAL HYPER-CONVERGED INFRASTRUCTURE MARKET REVENUE FOR EDUCATION, BY REGION 2018–2026 ($MILLION)
TABLE 19. GLOBAL HYPER-CONVERGED INFRASTRUCTURE MARKET REVENUE FOR OTHERS, BY REGION 2018–2026 ($MILLION)
TABLE 20. GLOBAL HYPER-CONVERGED INFRASTRUCTURE MARKET REVENUE, BY REGION, 2018–2026 ($MILLION)
TABLE 21. NORTH AMERICA HYPER-CONVERGED INFRASTRUCTURE MARKET REVENUE, BY COMPONENT, 2018–2026 ($MILLION)
TABLE 22. NORTH AMERICA HYPER-CONVERGED INFRASTRUCTURE MARKET REVENUE, BY APPLICATION 2018–2026 ($MILLION)
TABLE 23. NORTH AMERICA HYPER-CONVERGED INFRASTRUCTURE MARKET REVENUE, BY INDUSTRY VERTICAL, 2018–2026 ($MILLION)
TABLE 24. NORTH AMERICA HYPER-CONVERGED INFRASTRUCTURE MARKET REVENUE, BY COUNTRY, 2018–2026 ($MILLION)
TABLE 25. U.S. HYPER-CONVERGED INFRASTRUCTURE MARKET REVENUE, BY COMPONENT, 2018–2026 ($MILLION)
TABLE 26. U.S. HYPER-CONVERGED INFRASTRUCTURE MARKET REVENUE, BY APPLICATION 2018–2026 ($MILLION)
TABLE 27. U.S. HYPER-CONVERGED INFRASTRUCTURE MARKET REVENUE, BY INDUSTRY VERTICAL, 2018–2026 ($MILLION)
TABLE 28. CANADA HYPER-CONVERGED INFRASTRUCTURE MARKET REVENUE, BY COMPONENT, 2018–2026 ($MILLION)
TABLE 29. CANADA HYPER-CONVERGED INFRASTRUCTURE MARKET REVENUE, BY APPLICATION 2018–2026 ($MILLION)
TABLE 30. CANADA HYPER-CONVERGED INFRASTRUCTURE MARKET REVENUE, BY INDUSTRY VERTICAL, 2018–2026 ($MILLION)
TABLE 31. EUROPE HYPER-CONVERGED INFRASTRUCTURE MARKET REVENUE, BY COMPONENT, 2018–2026 ($MILLION)
TABLE 32. EUROPE HYPER-CONVERGED INFRASTRUCTURE MARKET REVENUE, BY APPLICATION 2018–2026 ($MILLION)
TABLE 33. EUROPE HYPER-CONVERGED INFRASTRUCTURE MARKET REVENUE, BY INDUSTRY VERTICAL, 2018–2026 ($MILLION)
TABLE 34. EUROPE HYPER-CONVERGED INFRASTRUCTURE MARKET REVENUE, BY COUNTRY, 2018–2026 ($MILLION)
TABLE 35. GERMANY HYPER-CONVERGED INFRASTRUCTURE MARKET REVENUE, BY COMPONENT, 2018–2026 ($MILLION)
TABLE 36. GERMANY HYPER-CONVERGED INFRASTRUCTURE MARKET REVENUE, BY APPLICATION 2018–2026 ($MILLION)
TABLE 37. GERMANY HYPER-CONVERGED INFRASTRUCTURE MARKET REVENUE, BY INDUSTRY VERTICAL, 2018–2026 ($MILLION)
TABLE 38. UK HYPER-CONVERGED INFRASTRUCTURE MARKET REVENUE, BY COMPONENT, 2018–2026 ($MILLION)
TABLE 39. UK HYPER-CONVERGED INFRASTRUCTURE MARKET REVENUE, BY APPLICATION 2018–2026 ($MILLION)
TABLE 40. UK HYPER-CONVERGED INFRASTRUCTURE MARKET REVENUE, BY INDUSTRY VERTICAL, 2018–2026 ($MILLION)
TABLE 41. FRANCE HYPER-CONVERGED INFRASTRUCTURE MARKET REVENUE, BY COMPONENT, 2018–2026 ($MILLION)
TABLE 42. FRANCE HYPER-CONVERGED INFRASTRUCTURE MARKET REVENUE, BY APPLICATION 2018–2026 ($MILLION)
TABLE 43. FRANCE HYPER-CONVERGED INFRASTRUCTURE MARKET REVENUE, BY INDUSTRY VERTICAL, 2018–2026 ($MILLION)
TABLE 44. REST OF EUROPE HYPER-CONVERGED INFRASTRUCTURE MARKET REVENUE, BY COMPONENT, 2018–2026 ($MILLION)
TABLE 45. REST OF EUROPE HYPER-CONVERGED INFRASTRUCTURE MARKET REVENUE, BY APPLICATION 2018–2026 ($MILLION)
TABLE 46. REST OF EUROPE HYPER-CONVERGED INFRASTRUCTURE MARKET REVENUE, BY INDUSTRY VERTICAL, 2018–2026 ($MILLION)
TABLE 47. ASIA-PACIFIC HYPER-CONVERGED INFRASTRUCTURE MARKET REVENUE, BY COMPONENT, 2018–2026 ($MILLION)
TABLE 48. ASIA-PACIFIC HYPER-CONVERGED INFRASTRUCTURE MARKET REVENUE, BY APPLICATION 2018–2026 ($MILLION)
TABLE 49. ASIA-PACIFIC HYPER-CONVERGED INFRASTRUCTURE MARKET REVENUE, BY INDUSTRY VERTICAL, 2018–2026 ($MILLION)
TABLE 50. ASIA-PACIFIC HYPER-CONVERGED INFRASTRUCTURE MARKET REVENUE, BY COUNTRY, 2018–2026 ($MILLION)
TABLE 51. JAPAN HYPER-CONVERGED INFRASTRUCTURE MARKET REVENUE, BY COMPONENT, 2018–2026 ($MILLION)
TABLE 52. JAPAN HYPER-CONVERGED INFRASTRUCTURE MARKET REVENUE, BY APPLICATION 2018–2026 ($MILLION)
TABLE 53. JAPAN HYPER-CONVERGED INFRASTRUCTURE MARKET REVENUE, BY INDUSTRY VERTICAL, 2018–2026 ($MILLION)
TABLE 54. CHINA HYPER-CONVERGED INFRASTRUCTURE MARKET REVENUE, BY COMPONENT, 2018–2026 ($MILLION)
TABLE 55. CHINA HYPER-CONVERGED INFRASTRUCTURE MARKET REVENUE, BY APPLICATION 2018–2026 ($MILLION)
TABLE 56. CHINA HYPER-CONVERGED INFRASTRUCTURE MARKET REVENUE, BY INDUSTRY VERTICAL, 2018–2026 ($MILLION)
TABLE 57. INDIA HYPER-CONVERGED INFRASTRUCTURE MARKET REVENUE, BY COMPONENT, 2018–2026 ($MILLION)
TABLE 58. INDIA HYPER-CONVERGED INFRASTRUCTURE MARKET REVENUE, BY APPLICATION 2018–2026 ($MILLION)
TABLE 59. INDIA HYPER-CONVERGED INFRASTRUCTURE MARKET REVENUE, BY INDUSTRY VERTICAL, 2018–2026 ($MILLION)
TABLE 60. REST OF ASIA-PACIFIC HYPER-CONVERGED INFRASTRUCTURE MARKET REVENUE, BY COMPONENT, 2018–2026 ($MILLION)
TABLE 61. REST OF ASIA-PACIFIC HYPER-CONVERGED INFRASTRUCTURE MARKET REVENUE, BY APPLICATION 2018–2026 ($MILLION)
TABLE 62. REST OF ASIA-PACIFIC HYPER-CONVERGED INFRASTRUCTURE MARKET REVENUE, BY INDUSTRY VERTICAL, 2018–2026 ($MILLION)
TABLE 63. LAMEA HYPER-CONVERGED INFRASTRUCTURE MARKET REVENUE, BY COMPONENT, 2018–2026 ($MILLION)
TABLE 64. LAMEA HYPER-CONVERGED INFRASTRUCTURE MARKET REVENUE, BY APPLICATION 2018–2026 ($MILLION)
TABLE 65. LAMEA HYPER-CONVERGED INFRASTRUCTURE MARKET REVENUE, BY INDUSTRY VERTICAL, 2018–2026 ($MILLION)
TABLE 66. LAMEA HYPER-CONVERGED INFRASTRUCTURE MARKET REVENUE, BY COUNTRY, 2018–2026 ($MILLION)
TABLE 67. LATIN AMERICA HYPER-CONVERGED INFRASTRUCTURE MARKET REVENUE, BY COMPONENT, 2018–2026 ($MILLION)
TABLE 68. LATIN AMERICA HYPER-CONVERGED INFRASTRUCTURE MARKET REVENUE, BY APPLICATION 2018–2026 ($MILLION)
TABLE 69. LATIN AMERICA HYPER-CONVERGED INFRASTRUCTURE MARKET REVENUE, BY INDUSTRY VERTICAL, 2018–2026 ($MILLION)
TABLE 70. MIDDLE EAST HYPER-CONVERGED INFRASTRUCTURE MARKET REVENUE, BY COMPONENT, 2018–2026 ($MILLION)
TABLE 71. MIDDLE EAST HYPER-CONVERGED INFRASTRUCTURE MARKET REVENUE, BY APPLICATION 2018–2026 ($MILLION)
TABLE 72. MIDDLE EAST HYPER-CONVERGED INFRASTRUCTURE MARKET REVENUE, BY INDUSTRY VERTICAL, 2018–2026 ($MILLION)
TABLE 73. AFRICA HYPER-CONVERGED INFRASTRUCTURE MARKET REVENUE, BY COMPONENT, 2018–2026 ($MILLION)
TABLE 74. AFRICA HYPER-CONVERGED INFRASTRUCTURE MARKET REVENUE, BY APPLICATION 2018–2026 ($MILLION)
TABLE 75. AFRICA HYPER-CONVERGED INFRASTRUCTURE MARKET REVENUE, BY INDUSTRY VERTICAL, 2018–2026 ($MILLION)
TABLE 76. KEY NEW PRODUCT LAUNCHES (2016-2019)
TABLE 77. COLLABORATION (2016-2019)
TABLE 78. PARTNERSHIP (2016-2019)
TABLE 79. PRODUCT DEVELOPMENT (2016-2019)
TABLE 80. KEY EXPANSION (2016-2019)
TABLE 81. KEY ACQUISITION (2016-2019)
TABLE 85. CISCO SYSTEMS, INC.: KEY STRATEGIC MOVES AND DEVELOPMENTS
TABLE 86. DELL TECHNOLOGIES INC.: KEY EXECUTIVES
TABLE 87. DELL TECHNOLOGIES INC.: COMPANY SNAPSHOT
TABLE 88. DELL TECHNOLOGIES INC.: OPERATING SEGMENTS
TABLE 89. DELL TECHNOLOGIES INC.: PRODUCT PORTFOLIO
TABLE 90. DELL TECHNOLOGIES INC.: KEY STRATEGIC MOVES AND DEVELOPMENTS
TABLE 91. HEWLETT PACKARD ENTERPRISE DEVELOPMENT LP: KEY EXECUTIVES
TABLE 92. HEWLETT PACKARD ENTERPRISE DEVELOPMENT LP: COMPANY SNAPSHOT
TABLE 93. HEWLETT PACKARD ENTERPRISE DEVELOPMENT LP: OPERATING SEGMENTS
TABLE 94. HEWLETT PACKARD ENTERPRISE DEVELOPMENT LP: PRODUCT PORTFOLIO
TABLE 95. HEWLETT PACKARD ENTERPRISE: KEY STRATEGIC MOVES AND DEVELOPMENTS
TABLE 96. HUAWEI TECHNOLOGIES CO., LTD.: KEY EXECUTIVES
TABLE 97. HUAWEI TECHNOLOGIES CO., LTD.: COMPANY SNAPSHOT
TABLE 98. HUAWEI TECHNOLOGIES CO., LTD.: OPERATING SEGMENTS
TABLE 99. HUAWEI TECHNOLOGIES CO., LTD.: PRODUCT PORTFOLIO
TABLE 100. HUAWEI TECHNOLOGIES CO., LTD.: KEY STRATEGIC MOVES AND DEVELOPMENTS
TABLE 101. MICROSOFT CORPORATION: KEY EXECUTIVES
TABLE 102. MICROSOFT CORPORATION: COMPANY SNAPSHOT
TABLE 103. MICROSOFT CORPORATION: OPERATING SEGMENTS
TABLE 104. MICROSOFT CORPORATION: PRODUCT PORTFOLIO
TABLE 105. MICROSOFT CORPORATION: KEY STRATEGIC MOVES AND DEVELOPMENTS
TABLE 106. NETAPP, INC.: KEY EXECUTIVES
TABLE 107. NETAPP, INC.: COMPANY SNAPSHOT
TABLE 108. NETAPP, INC.: OPERATING SEGMENTS
TABLE 109. NETAPP, INC.: PRODUCT PORTFOLIO
TABLE 110. NETAPP, INC.: KEY STRATEGIC MOVES AND DEVELOPMENTS
TABLE 111. NUTANIX, INC.: KEY EXECUTIVES
TABLE 112. NUTANIX, INC.: COMPANY SNAPSHOT
TABLE 113. NUTANIX, INC.: PRODUCT PORTFOLIO
TABLE 114. NUTANIX, INC.: KEY STRATEGIC MOVES AND DEVELOPMENTS
TABLE 115. PIVOT3: KEY EXECUTIVES
TABLE 116. PIVOT3: COMPANY SNAPSHOT
TABLE 117. PIVOT3: PRODUCT PORTFOLIO
TABLE 118. PIVOT3: KEY STRATEGIC MOVES AND DEVELOPMENTS
TABLE 119. SCALE COMPUTING: KEY EXECUTIVES
TABLE 120. SCALE COMPUTING: COMPANY SNAPSHOT
TABLE 121. SCALE COMPUTING: PRODUCT PORTFOLIO
TABLE 122. SCALE COMPUTING: KEY STRATEGIC MOVES AND DEVELOPMENTS
TABLE 123. VMWARE, INC.: KEY EXECUTIVES
TABLE 124. VMWARE, INC.: COMPANY SNAPSHOT
TABLE 125. VMWARE, INC.: PRODUCT PORTFOLIO
TABLE 126. VMWARE, INC.: KEY STRATEGIC MOVES AND DEVELOPMENTS
LIST OF FIGURES
FIGURE 01. KEY MARKET SEGMENTS
FIGURE 02. GLOBAL HYPER-CONVERGED INFRASTRUCTURE MARKET, 2018–2026
FIGURE 03. GLOBAL HYPER-CONVERGED INFRASTRUCTURE MARKET, BY REGION, 2018–2026
FIGURE 04. TOP IMPACTING FACTORS
FIGURE 05. TOP INVESTMENT POCKETS
FIGURE 06. TOP PLAYERS OF THE GLOBAL HYPER-CONVERGED INFRASTRUCTURE MARKET
FIGURE 07. MODERATE-TO-HIGH BARGAINING POWER OF SUPPLIERS
FIGURE 08. MODERATE-TO-HIGH BARGAINING POWER OF BUYER
FIGURE 09. MODERATE-TO-HIGH THREAT OF SUBSTITUTES
FIGURE 10. MODERATE-TO-HIGH THREAT OF NEW ENTRANTS
FIGURE 11. LOW-TO-HIGH COMPETITIVE RIVALRY
FIGURE 12. MARKET DYNAMICS: GLOBAL HYPER-CONVERGED INFRASTRUCTURE MARKET
FIGURE 13. BENEFITS OF HYPER-CONVERGED INFRASTRUCTURE
FIGURE 14. INDUSTRY ROADMAP OF HYPER-CONVERGED INFRASTRUCTURE
FIGURE 15. IMPACT OF GOVERNMENT REGULATIONS ON THE GLOBAL HYPER-CONVERGED INFRASTRUCTURE MARKET
FIGURE 16. GLOBAL HYPER-CONVERGED INFRASTRUCTURE MARKET, BY COMPONENT, 2018-2026
FIGURE 17. COMPARATIVE SHARE ANALYSIS GLOBAL HYPER-CONVERGED INFRASTRUCTURE MARKET FOR HARDWARE, BY COUNTRY, 2018 & 2026 (%)
FIGURE 18. COMPARATIVE SHARE ANALYSIS GLOBAL HYPER-CONVERGED INFRASTRUCTURE MARKET FOR SOFTWARE, BY COUNTRY, 2018 & 2026 (%)
FIGURE 19. GLOBAL HYPER-CONVERGED INFRASTRUCTURE MARKET REVENUE, BY APPLICATION, 2018–2026 ($MILLION)
FIGURE 20. COMPARATIVE SHARE ANALYSIS OF GLOBAL HYPER-CONVERGED INFRASTRUCTURE MARKET FOR REMOTE OFFICE/ BRANCH OFFICE, BY COUNTRY, 2018 & 2026 (%)
FIGURE 21. COMPARATIVE SHARE ANALYSIS OF GLOBAL HYPER-CONVERGED INFRASTRUCTURE MARKET FOR VIRTUALIZATION DESKTOP INFRASTRUCTURE, BY COUNTRY, 2018 & 2026 (%)
FIGURE 22. COMPARATIVE SHARE ANALYSIS OF GLOBAL HYPER-CONVERGED INFRASTRUCTURE MARKET FOR DATA CENTER CONSOLIDATION, BY COUNTRY, 2018 & 2026 (%)
FIGURE 23. COMPARATIVE SHARE ANALYSIS OF GLOBAL HYPER-CONVERGED INFRASTRUCTURE MARKET FOR BACKUP RECOVERY/ DISASTER RECOVERY, BY COUNTRY, 2018 & 2026 (%)
FIGURE 24. COMPARATIVE SHARE ANALYSIS OF GLOBAL HYPER-CONVERGED INFRASTRUCTURE MARKET FOR VIRTUALIZING CRITICAL APPLICATIONS, BY COUNTRY, 2018 & 2026 (%)
FIGURE 25. COMPARATIVE SHARE ANALYSIS OF GLOBAL HYPER-CONVERGED INFRASTRUCTURE MARKET FOR OTHERS, BY COUNTRY, 2018 & 2026 (%)
FIGURE 26. GLOBAL HYPER-CONVERGED INFRASTRUCTURE MARKET, BY INDUSTRY VERTICAL, 2018–2026
FIGURE 27. COMPARATIVE SHARE ANALYSIS GLOBAL HYPER-CONVERGED INFRASTRUCTURE MARKET FOR BFSI, BY COUNTRY, 2018 & 2026 (%)
FIGURE 28. COMPARATIVE SHARE ANALYSIS GLOBAL HYPER-CONVERGED INFRASTRUCTURE MARKET FOR IT & TELECOMMUNICATIONS , BY COUNTRY, 2018 & 2026 (%)
FIGURE 29. COMPARATIVE SHARE ANALYSIS GLOBAL HYPER-CONVERGED INFRASTRUCTURE MARKET FOR GOVERNMENT, BY COUNTRY, 2018 & 2026 (%)
FIGURE 30. COMPARATIVE SHARE ANALYSIS GLOBAL HYPER-CONVERGED INFRASTRUCTURE MARKET FOR HEALTHCARE, BY COUNTRY, 2018 & 2026(%)
FIGURE 31. COMPARATIVE SHARE ANALYSIS OF GLOBAL HYPER-CONVERGED INFRASTRUCTURE MARKET FOR MANUFACTURING, BY COUNTRY, 2018 & 2026 (%)
FIGURE 32. COMPARATIVE SHARE ANALYSIS GLOBAL HYPER-CONVERGED INFRASTRUCTURE MARKET FOR ENERGY & UTILITIES, BY COUNTRY, 2018 & 2026 (%)
FIGURE 33. COMPARATIVE SHARE ANALYSIS GLOBAL HYPER-CONVERGED INFRASTRUCTURE MARKET FOR EDUCATION, BY COUNTRY, 2018 & 2026 (%)
FIGURE 34. COMPARATIVE SHARE ANALYSIS GLOBAL HYPER-CONVERGED INFRASTRUCTURE MARKET FOR OTHERS, BY COUNTRY, 2018 & 2026 (%)
FIGURE 35. GLOBAL HYPER-CONVERGED INFRASTRUCTURE MARKET REVENUE, BY REGION, 2018–2026 ($MILLION)
FIGURE 36. U.S. HYPER-CONVERGED INFRASTRUCTURE MARKET REVENUE, 2018–2026 ($MILLION)
FIGURE 37. CANADA HYPER-CONVERGED INFRASTRUCTURE MARKET REVENUE, 2018-2026 ($MILLION)
FIGURE 38. GERMANY HYPER-CONVERGED INFRASTRUCTURE MARKET REVENUE, 2018-2026 ($MILLION)
FIGURE 39. UK HYPER-CONVERGED INFRASTRUCTURE MARKET REVENUE, 2018-2026 ($MILLION)
FIGURE 40. FRANCE HYPER-CONVERGED INFRASTRUCTURE MARKET REVENUE, 2018-2026 ($MILLION)
FIGURE 41. REST OF EUROPE HYPER-CONVERGED INFRASTRUCTURE MARKET REVENUE, 2018-2026 ($MILLION)
FIGURE 42. JAPAN HYPER-CONVERGED INFRASTRUCTURE MARKET REVENUE, 2018-2026 ($MILLION)
FIGURE 43. CHINA HYPER-CONVERGED INFRASTRUCTURE MARKET REVENUE, 2018-2026 ($MILLION)
FIGURE 44. INDIA HYPER-CONVERGED INFRASTRUCTURE MARKET REVENUE, 2018-2026 ($MILLION)
FIGURE 45. REST OF ASIA-PACIFIC HYPER-CONVERGED INFRASTRUCTURE MARKET REVENUE, 2018-2026 ($MILLION)
FIGURE 46. LATIN AMERICA HYPER-CONVERGED INFRASTRUCTURE MARKET REVENUE, 2018-2026 ($MILLION)
FIGURE 47. MIDDLE EAST HYPER-CONVERGED INFRASTRUCTURE MARKET REVENUE, 2018-2026 ($MILLION)
FIGURE 48. AFRICA HYPER-CONVERGED INFRASTRUCTURE MARKET REVENUE, 2018-2026 ($MILLION)
FIGURE 49. KEY PLAYER POSITIONING ANLYSIS: GLOBAL HYPER-CONVERGED INFRASTRUCTURE MARKET
FIGURE 50. TOP WINNING STRATEGIES, BY YEAR, 2016-2019
FIGURE 51. TOP WINNING STRATEGIES, BY DEVELOPMENT, 2016-2019
FIGURE 52. TOP WINNING STRATEGIES, BY COMPANY, 2016-2019
FIGURE 53. COMPETITIVE DASHBOARD
FIGURE 54. COMPETITIVE DASHBOARD
FIGURE 55. COMPETITIVE HEATMAP OF KEY PLAYERS
FIGURE 56. PATENT ANALYSIS, BY REGION
FIGURE 57. PATENT ANALYSIS, BY APPLICANT
FIGURE 61. R&D EXPENDITURE, 2016–2018 ($MILLION)
FIGURE 62. DELL TECHNOLOGIES INC.: REVENUE, 2016–2018 ($MILLION)
FIGURE 63. DELL TECHNOLOGIES INC.: REVENUE SHARE BY SEGMENT, 2018 (%)
FIGURE 64. DELL TECHNOLOGIES INC.: REVENUE SHARE BY REGION, 2018 (%)
FIGURE 65. R&D EXPENDITURE, 2016–2018 ($MILLION)
FIGURE 66. HEWLETT PACKARD ENTERPRISE DEVELOPMENT LP: REVENUE, 2016–2018 ($MILLION)
FIGURE 67. HEWLETT PACKARD ENTERPRISE DEVELOPMENT LP: REVENUE SHARE BY SEGMENT, 2018 (%)
FIGURE 68. R&D EXPENDITURE, 2016–2018 ($MILLION)
FIGURE 69. HUAWEI TECHNOLOGIES CO., LTD.: REVENUE, 2016–2018 ($MILLION)
FIGURE 70. HUAWEI TECHNOLOGIES CO., LTD.: REVENUE SHARE BY SEGMENT, 2018 (%)
FIGURE 71. HUAWEI TECHNOLOGIES CO., LTD.: REVENUE SHARE BY REGION, 2018 (%)
FIGURE 72. R&D EXPENDITURE, 2016–2018 ($MILLION)
FIGURE 73. MICROSOFT CORPORATION: REVENUE, 2016–2018 ($MILLION)
FIGURE 74. MICROSOFT CORPORATION: REVENUE SHARE BY SEGMENT, 2018 (%)
FIGURE 75. MICROSOFT CORPORATION: REVENUE SHARE BY REGION, 2018 (%)
FIGURE 76. R&D EXPENDITURE, 2016–2018 ($MILLION)
FIGURE 77. NETAPP, INC.: REVENUE, 2016–2018 ($MILLION)
FIGURE 78. NETAPP, INC.: REVENUE SHARE BY SEGMENT, 2018 (%)
FIGURE 79. NETAPP, INC.: REVENUE SHARE BY REGION, 2018 (%)
FIGURE 80. R&D EXPENDITURE, 2016–2018 ($MILLION)
FIGURE 81. NUTANIX, INC.: REVENUE, 2016–2018 ($MILLION)
FIGURE 82. NUTANIX, INC.: REVENUE SHARE BY REGION, 2018 (%)
FIGURE 83. VMWARE, INC.: REVENUE, 2015–2018 ($MILLION)
FIGURE 84. VMWARE, INC.: REVENUE SHARE BY GEOGRAPHY, 2018 (%)
$5769
$8995
HAVE A QUERY?
OUR CUSTOMER
