
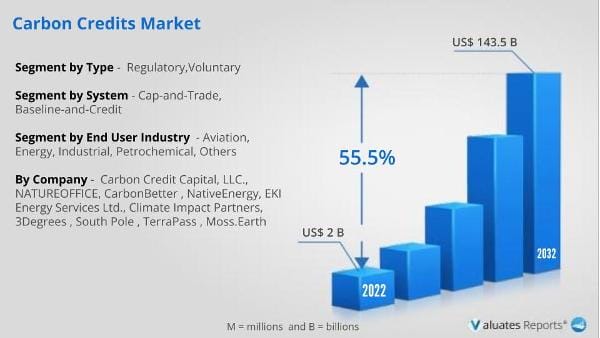
The global carbon credits market was valued at $2 billion in 2022, and is projected to reach $143.5 billion by 2032, growing at a CAGR of 55.5% from 2023 to 2032. Carbon credits are kind of permit in which one carbon credit represents one ton of carbon dioxide that is removed from the environment. These carbon credits are largely purchased by individuals or companies to compensate for their carbon emissions that is produced as a result of industrial activities. The carbon credits are largely governed by several registries namely American Carbon Registry (ACR), Climate Action Reserve (CAR), UN Clean Development Mechanism (UN CDM), and others. Also, the revenue generated from the sale of carbon credits provides financial support to emission reduction projects. This funding helps to incentivize and finance additional projects, thereby contributing to global efforts to mitigate climate change and transition to a low-carbon economy.
The COVID-19 pandemic has led to a negative impact on the carbon credits industry owing to reduced industrial & manufacturing, transportation, and other activities. The economic uncertainties led by the pandemic have led to reduced investments and led to the significant delays in carbon credit projects across the world.
The carbon market allows for the purchase and sale of carbon credits. To offset their own emissions and achieve their sustainability objectives, buyers, such as businesses, governments, or individuals, buy carbon credits. Through specialized platforms or exchanges, the carbon credits are transferred from the seller to the buyer. When carbon credits are bought, they are usually retired or canceled, making sure they cannot be used or traded again. Governments or regulatory bodies typically establish registries or tracking systems to record the issuance, ownership, and retirement of carbon credits. These systems provide a transparent and auditable record of the transactions and ensure the accurate accounting of emission reductions. Registries also help prevent double-counting or double-selling of carbon credits.
The market for carbon credits that are bought voluntarily (as compared with for compliance purposes) is growing significantly. Using voluntary carbon credits, private funding is directed to climate change projects that would not otherwise be able to start. Additional advantages of carbon credits include the preservation of biodiversity and reduction of pollution. Carbon credits also encourage spending on the innovation needed to bring down the price of new climate technologies that helps in achieving sustainability by reducing carbon footprints. These factors are anticipated to boost the carbon credits market growth during the forecast period.
The market is expected to experience difficulties owing to the rising price of carbon credits. One of the limitations of carbon credit is that with the help of carbon credits, companies do not invest in efforts to reduce carbon as they can buy unlimited carbon credits. These factors are anticipated to restrain the carbon credits market opportunities in the upcoming years.
Carbon credits can help to reduce the impact that carbon emissions have on the environment. Thus, with the help of carbon credits, companies can effectively invest in other initiatives that lower greenhouse gas emissions by buying carbon credits. The adoption and implementation of renewable energy projects such as solar energy, wind power, and others is increasing across the world. Such renewable energy projects helps in generating the carbon credits. For instance, India greatly contributes to the emission of harmful greenhouse gases. Hence, the country is actively engaging in sustainable development goals to reduce the carbon footprint which is anticipated to generate excellent opportunities in the global carbon credits market in the upcoming years.
The key players profiled in this report include South Pole, 3Degrees, EKI Energy Services Ltd, TerraPass, NATUREOFFICE, Moss.Earth, Climate Impact Partners, Carbon Credit Capital, LLC, CarbonBetter, and NativeEnergy. Investment and agreement are common strategies followed by major market players. For instance, on February 17, 2022, The GyapaTM Cookstoves project released an additional 1 million tons of independently verified Gold Standard carbon credits, according to a statement from ClimateCare and Relief International. With this, the project has now successfully reduced emissions by more than 5 million over the course of 12 years.
The carbon credits market is segmented on the basis of type, system, end-use industry, and region. By type, the market is sub-segmented into regulatory and voluntary. By system, the market is classified into cap-and-trade and baseline-and-credit. By end-use industry, the market is classified into aviation, energy, industrial, petrochemical, and others. By region, the market is analyzed across North America, Europe, Asia-Pacific, and LAMEA.
The carbon credits market is segmented into Type, System and End-use Industry.
By type, the regulatory sub-segment dominated the market in 2022. In the regulatory carbon credits market, companies are legally mandated to offset their carbon emissions. In this sub-segment, the carbon-emitting industries are regulated by emission standards that were established in the Framework of the United Nations Convention on Climate Change (UNFCCC). The benefit of regulatory carbon credits is that the emission reduction norms are validated by designated operational entities which ensures that measurable and real carbon emission reduction is achieved. With regulatory carbon credits, companies or individuals that buy carbon credits must be verified by Verified Emission Reduction (VER). These are predicted to be the major factors affecting the carbon credits market size during the forecast period.
By system, the cap-and-trade sub-segment dominated the global carbon credits market in 2022. Systems that use cap-and-trade frequently allow for the use of offsets. Offsets are credits produced from projects to reduce emissions that are not subject to the cap but still help to reduce overall emissions. The cap-and-trade program helps in lowering the greenhouse gas emissions. In this system, certain limits are mentioned for aggregate emissions from a group of emitters which is known as ‘cap.’ Cap-and-trade programs frequently offer adaptable mechanisms to account for fluctuating emission reduction costs and advance cost-efficiency. In this system, the government can generate revenue by auctioning the carbon credits or selling them directly to the entities. The cap-and-trade system requires regular monitoring, verification, reporting, and assessment of carbon credits to ensure transparency in the process.
By end-use industry, the industrial sub-segment dominated the global carbon credits market share in 2022. The industrial sector is one of the major carbon-emitting sector. This is because industrial sectors such as oil & gas, manufacturing, steel processing, and others have high energy demand and the combustion of fuels in these industrial sectors leads to the emission of greenhouse gases. The ongoing R&D in the industrial sector aims at reducing the carbon emission and improving energy efficiency. Thus, carbon credits can play a major role in reducing harmful carbon emissions. This is because carbon credits offers flexibility to the companies to meet their carbon reduction targets. The trading of carbon credits or allowances allows industrial entities to benefit economically from their emission reduction efforts. This encourages the adoption of cleaner technologies and practices, facilitates the transfer of emission reduction projects, and promotes sustainable industrial development.
By region, Asia-Pacific dominated the global market in 2022 and is projected to be the fastest-growing region during the forecast period. The popularity of carbon credits market across countries namely China, Japan, India, and others can be attributed to several sustainability initiatives taken by the companies in this region. For instance, in May 2022, Japan decided to launch a first exchange for carbon emissions trading. This trading platform is named as Japan Exchange Group (JPX) which is established together with the Ministry of Economy, Trade, and Industry (METI) that focuses on reduction of carbon dioxide. In line with this initiative, JPX already started the carbon credit trading trial in September 2022. Also, China is one of the leading carbon credits market, and the country has decided to relaunch its domestic voluntary carbon mechanism called the China Certified Emission Reduction program in May 2023. In first quarter of 2023, China which is the leading supplier of carbon credits, accounted for 20.8% of total voluntary carbon credit issuances. These factors are anticipated to boost the regional carbon credits market expansion in the upcoming years.
Impact of covid-19 on Carbon Credits Market
Key Benefits of Stakeholders
| Report Metric | Details |
| Report Name | Global Carbon Credits Market |
| Base Year | 2022 |
| Forecasted years | 2022-2032 |
| By Company |
Carbon Credit Capital, LLC., NATUREOFFICE, CarbonBetter , NativeEnergy, EKI Energy Services Ltd., Climate Impact Partners, 3Degrees , South Pole. |
| Segment by Type |
|
| Segment by System |
|
| Segment by End Use Industry |
|
| CAGR | 55.5% |
| Forecast units | USD billion in value |
| Report coverage | Revenue and volume forecast, company share, competitive landscape, growth factors and trends |
Ans. The global carbon credits market was valued at $2 billion in 2022, and is projected to reach $143.5 billion by 2032, growing at a CAGR of 55.5% from 2023 to 2032.
Ans. The global carbon credits market is expected to grow at a compound annual growth rate of 55.5% from 2023 to 2032.
Ans. Carbon Credit Capital, LLC., NATUREOFFICE, CarbonBetter , NativeEnergy, EKI Energy Services Ltd., Climate Impact Partners, 3Degrees , South Pole , Others.
LIST OF TABLES
TABLE 01. GLOBAL CARBON CREDITS MARKET, BY TYPE, 2022-2032 ($MILLION)
TABLE 02. CARBON CREDITS MARKET FOR REGULATORY, BY REGION, 2022-2032 ($MILLION)
TABLE 03. CARBON CREDITS MARKET FOR VOLUNTARY, BY REGION, 2022-2032 ($MILLION)
TABLE 04. GLOBAL CARBON CREDITS MARKET, BY SYSTEM, 2022-2032 ($MILLION)
TABLE 05. CARBON CREDITS MARKET FOR CAP-AND-TRADE, BY REGION, 2022-2032 ($MILLION)
TABLE 06. CARBON CREDITS MARKET FOR BASELINE-AND-CREDIT, BY REGION, 2022-2032 ($MILLION)
TABLE 07. GLOBAL CARBON CREDITS MARKET, BY END-USE INDUSTRY, 2022-2032 ($MILLION)
TABLE 08. CARBON CREDITS MARKET FOR AVIATION, BY REGION, 2022-2032 ($MILLION)
TABLE 09. CARBON CREDITS MARKET FOR ENERGY, BY REGION, 2022-2032 ($MILLION)
TABLE 10. CARBON CREDITS MARKET FOR INDUSTRIAL, BY REGION, 2022-2032 ($MILLION)
TABLE 11. CARBON CREDITS MARKET FOR PETROCHEMICAL, BY REGION, 2022-2032 ($MILLION)
TABLE 12. CARBON CREDITS MARKET FOR OTHERS, BY REGION, 2022-2032 ($MILLION)
TABLE 13. CARBON CREDITS MARKET, BY REGION, 2022-2032 ($MILLION)
TABLE 14. NORTH AMERICA CARBON CREDITS MARKET, BY TYPE, 2022-2032 ($MILLION)
TABLE 15. NORTH AMERICA CARBON CREDITS MARKET, BY SYSTEM, 2022-2032 ($MILLION)
TABLE 16. NORTH AMERICA CARBON CREDITS MARKET, BY END-USE INDUSTRY, 2022-2032 ($MILLION)
TABLE 17. NORTH AMERICA CARBON CREDITS MARKET, BY COUNTRY, 2022-2032 ($MILLION)
TABLE 18. U.S. CARBON CREDITS MARKET, BY TYPE, 2022-2032 ($MILLION)
TABLE 19. U.S. CARBON CREDITS MARKET, BY SYSTEM, 2022-2032 ($MILLION)
TABLE 20. U.S. CARBON CREDITS MARKET, BY END-USE INDUSTRY, 2022-2032 ($MILLION)
TABLE 21. CANADA CARBON CREDITS MARKET, BY TYPE, 2022-2032 ($MILLION)
TABLE 22. CANADA CARBON CREDITS MARKET, BY SYSTEM, 2022-2032 ($MILLION)
TABLE 23. CANADA CARBON CREDITS MARKET, BY END-USE INDUSTRY, 2022-2032 ($MILLION)
TABLE 24. MEXICO CARBON CREDITS MARKET, BY TYPE, 2022-2032 ($MILLION)
TABLE 25. MEXICO CARBON CREDITS MARKET, BY SYSTEM, 2022-2032 ($MILLION)
TABLE 26. MEXICO CARBON CREDITS MARKET, BY END-USE INDUSTRY, 2022-2032 ($MILLION)
TABLE 27. EUROPE CARBON CREDITS MARKET, BY TYPE, 2022-2032 ($MILLION)
TABLE 28. EUROPE CARBON CREDITS MARKET, BY SYSTEM, 2022-2032 ($MILLION)
TABLE 29. EUROPE CARBON CREDITS MARKET, BY END-USE INDUSTRY, 2022-2032 ($MILLION)
TABLE 30. EUROPE CARBON CREDITS MARKET, BY COUNTRY, 2022-2032 ($MILLION)
TABLE 31. GERMANY CARBON CREDITS MARKET, BY TYPE, 2022-2032 ($MILLION)
TABLE 32. GERMANY CARBON CREDITS MARKET, BY SYSTEM, 2022-2032 ($MILLION)
TABLE 33. GERMANY CARBON CREDITS MARKET, BY END-USE INDUSTRY, 2022-2032 ($MILLION)
TABLE 34. UK CARBON CREDITS MARKET, BY TYPE, 2022-2032 ($MILLION)
TABLE 35. UK CARBON CREDITS MARKET, BY SYSTEM, 2022-2032 ($MILLION)
TABLE 36. UK CARBON CREDITS MARKET, BY END-USE INDUSTRY, 2022-2032 ($MILLION)
TABLE 37. FRANCE CARBON CREDITS MARKET, BY TYPE, 2022-2032 ($MILLION)
TABLE 38. FRANCE CARBON CREDITS MARKET, BY SYSTEM, 2022-2032 ($MILLION)
TABLE 39. FRANCE CARBON CREDITS MARKET, BY END-USE INDUSTRY, 2022-2032 ($MILLION)
TABLE 40. TURKEY CARBON CREDITS MARKET, BY TYPE, 2022-2032 ($MILLION)
TABLE 41. TURKEY CARBON CREDITS MARKET, BY SYSTEM, 2022-2032 ($MILLION)
TABLE 42. TURKEY CARBON CREDITS MARKET, BY END-USE INDUSTRY, 2022-2032 ($MILLION)
TABLE 43. RUSSIA CARBON CREDITS MARKET, BY TYPE, 2022-2032 ($MILLION)
TABLE 44. RUSSIA CARBON CREDITS MARKET, BY SYSTEM, 2022-2032 ($MILLION)
TABLE 45. RUSSIA CARBON CREDITS MARKET, BY END-USE INDUSTRY, 2022-2032 ($MILLION)
TABLE 46. REST OF EUROPE CARBON CREDITS MARKET, BY TYPE, 2022-2032 ($MILLION)
TABLE 47. REST OF EUROPE CARBON CREDITS MARKET, BY SYSTEM, 2022-2032 ($MILLION)
TABLE 48. REST OF EUROPE CARBON CREDITS MARKET, BY END-USE INDUSTRY, 2022-2032 ($MILLION)
TABLE 49. ASIA-PACIFIC CARBON CREDITS MARKET, BY TYPE, 2022-2032 ($MILLION)
TABLE 50. ASIA-PACIFIC CARBON CREDITS MARKET, BY SYSTEM, 2022-2032 ($MILLION)
TABLE 51. ASIA-PACIFIC CARBON CREDITS MARKET, BY END-USE INDUSTRY, 2022-2032 ($MILLION)
TABLE 52. ASIA-PACIFIC CARBON CREDITS MARKET, BY COUNTRY, 2022-2032 ($MILLION)
TABLE 53. CHINA CARBON CREDITS MARKET, BY TYPE, 2022-2032 ($MILLION)
TABLE 54. CHINA CARBON CREDITS MARKET, BY SYSTEM, 2022-2032 ($MILLION)
TABLE 55. CHINA CARBON CREDITS MARKET, BY END-USE INDUSTRY, 2022-2032 ($MILLION)
TABLE 56. JAPAN CARBON CREDITS MARKET, BY TYPE, 2022-2032 ($MILLION)
TABLE 57. JAPAN CARBON CREDITS MARKET, BY SYSTEM, 2022-2032 ($MILLION)
TABLE 58. JAPAN CARBON CREDITS MARKET, BY END-USE INDUSTRY, 2022-2032 ($MILLION)
TABLE 59. INDIA CARBON CREDITS MARKET, BY TYPE, 2022-2032 ($MILLION)
TABLE 60. INDIA CARBON CREDITS MARKET, BY SYSTEM, 2022-2032 ($MILLION)
TABLE 61. INDIA CARBON CREDITS MARKET, BY END-USE INDUSTRY, 2022-2032 ($MILLION)
TABLE 62. SOUTH KOREA CARBON CREDITS MARKET, BY TYPE, 2022-2032 ($MILLION)
TABLE 63. SOUTH KOREA CARBON CREDITS MARKET, BY SYSTEM, 2022-2032 ($MILLION)
TABLE 64. SOUTH KOREA CARBON CREDITS MARKET, BY END-USE INDUSTRY, 2022-2032 ($MILLION)
TABLE 65. AUSTRALIA CARBON CREDITS MARKET, BY TYPE, 2022-2032 ($MILLION)
TABLE 66. AUSTRALIA CARBON CREDITS MARKET, BY SYSTEM, 2022-2032 ($MILLION)
TABLE 67. AUSTRALIA CARBON CREDITS MARKET, BY END-USE INDUSTRY, 2022-2032 ($MILLION)
TABLE 68. REST OF ASIA-PACIFIC CARBON CREDITS MARKET, BY TYPE, 2022-2032 ($MILLION)
TABLE 69. REST OF ASIA-PACIFIC CARBON CREDITS MARKET, BY SYSTEM, 2022-2032 ($MILLION)
TABLE 70. REST OF ASIA-PACIFIC CARBON CREDITS MARKET, BY END-USE INDUSTRY, 2022-2032 ($MILLION)
TABLE 71. LAMEA CARBON CREDITS MARKET, BY TYPE, 2022-2032 ($MILLION)
TABLE 72. LAMEA CARBON CREDITS MARKET, BY SYSTEM, 2022-2032 ($MILLION)
TABLE 73. LAMEA CARBON CREDITS MARKET, BY END-USE INDUSTRY, 2022-2032 ($MILLION)
TABLE 74. LAMEA CARBON CREDITS MARKET, BY COUNTRY, 2022-2032 ($MILLION)
TABLE 75. BRAZIL CARBON CREDITS MARKET, BY TYPE, 2022-2032 ($MILLION)
TABLE 76. BRAZIL CARBON CREDITS MARKET, BY SYSTEM, 2022-2032 ($MILLION)
TABLE 77. BRAZIL CARBON CREDITS MARKET, BY END-USE INDUSTRY, 2022-2032 ($MILLION)
TABLE 78. UAE CARBON CREDITS MARKET, BY TYPE, 2022-2032 ($MILLION)
TABLE 79. UAE CARBON CREDITS MARKET, BY SYSTEM, 2022-2032 ($MILLION)
TABLE 80. UAE CARBON CREDITS MARKET, BY END-USE INDUSTRY, 2022-2032 ($MILLION)
TABLE 81. SAUDI ARABIA CARBON CREDITS MARKET, BY TYPE, 2022-2032 ($MILLION)
TABLE 82. SAUDI ARABIA CARBON CREDITS MARKET, BY SYSTEM, 2022-2032 ($MILLION)
TABLE 83. SAUDI ARABIA CARBON CREDITS MARKET, BY END-USE INDUSTRY, 2022-2032 ($MILLION)
TABLE 84. SOUTH AFRICA CARBON CREDITS MARKET, BY TYPE, 2022-2032 ($MILLION)
TABLE 85. SOUTH AFRICA CARBON CREDITS MARKET, BY SYSTEM, 2022-2032 ($MILLION)
TABLE 86. SOUTH AFRICA CARBON CREDITS MARKET, BY END-USE INDUSTRY, 2022-2032 ($MILLION)
TABLE 87. REST OF LAMEA CARBON CREDITS MARKET, BY TYPE, 2022-2032 ($MILLION)
TABLE 88. REST OF LAMEA CARBON CREDITS MARKET, BY SYSTEM, 2022-2032 ($MILLION)
TABLE 89. REST OF LAMEA CARBON CREDITS MARKET, BY END-USE INDUSTRY, 2022-2032 ($MILLION)
TABLE 90. SOUTH POLE : KEY EXECUTIVES
TABLE 91. SOUTH POLE : COMPANY SNAPSHOT
TABLE 92. 3DEGREES : KEY EXECUTIVES
TABLE 93. 3DEGREES : COMPANY SNAPSHOT
TABLE 94. EKI ENERGY SERVICES LTD.: KEY EXECUTIVES
TABLE 95. EKI ENERGY SERVICES LTD.: COMPANY SNAPSHOT
TABLE 96. TERRAPASS : KEY EXECUTIVES
TABLE 97. TERRAPASS : COMPANY SNAPSHOT
TABLE 98. NATUREOFFICE: KEY EXECUTIVES
TABLE 99. NATUREOFFICE: COMPANY SNAPSHOT
TABLE 100. MOSS.EARTH: KEY EXECUTIVES
TABLE 101. MOSS.EARTH: COMPANY SNAPSHOT
TABLE 102. CLIMATE IMPACT PARTNERS: KEY EXECUTIVES
TABLE 103. CLIMATE IMPACT PARTNERS: COMPANY SNAPSHOT
TABLE 104. CARBON CREDIT CAPITAL, LLC.: KEY EXECUTIVES
TABLE 105. CARBON CREDIT CAPITAL, LLC.: COMPANY SNAPSHOT
TABLE 106. CARBONBETTER : KEY EXECUTIVES
TABLE 107. CARBONBETTER : COMPANY SNAPSHOT
TABLE 108. NATIVEENERGY: KEY EXECUTIVES
TABLE 109. NATIVEENERGY: COMPANY SNAPSHOT
LIST OF FIGURES
FIGURE 01. CARBON CREDITS MARKET, 2022-2032
FIGURE 02. SEGMENTATION OF CARBON CREDITS MARKET, 2022-2032
FIGURE 03. TOP INVESTMENT POCKETS IN CARBON CREDITS MARKET (2023-2032)
FIGURE 04. PORTER FIVE-1
FIGURE 05. PORTER FIVE-2
FIGURE 06. PORTER FIVE-3
FIGURE 07. PORTER FIVE-4
FIGURE 08. PORTER FIVE-5
FIGURE 09. DRIVERS, RESTRAINTS AND OPPORTUNITIES: GLOBALCARBON CREDITS MARKET
FIGURE 10. IMPACT OF KEY REGULATION: CARBON CREDITS MARKET
FIGURE 11. MARKET SHARE ANALYSIS: CARBON CREDITS MARKET
FIGURE 12. PATENT ANALYSIS BY COMPANY
FIGURE 13. PATENT ANALYSIS BY COUNTRY
FIGURE 14. REGULATORY GUIDELINES: CARBON CREDITS MARKET
FIGURE 15. VALUE CHAIN ANALYSIS: CARBON CREDITS MARKET
FIGURE 16. CARBON CREDITS MARKET, BY TYPE, 2022(%)
FIGURE 17. COMPARATIVE SHARE ANALYSIS OF CARBON CREDITS MARKET FOR REGULATORY, BY COUNTRY 2022 AND 2032(%)
FIGURE 18. COMPARATIVE SHARE ANALYSIS OF CARBON CREDITS MARKET FOR VOLUNTARY, BY COUNTRY 2022 AND 2032(%)
FIGURE 19. CARBON CREDITS MARKET, BY SYSTEM, 2022(%)
FIGURE 20. COMPARATIVE SHARE ANALYSIS OF CARBON CREDITS MARKET FOR CAP-AND-TRADE, BY COUNTRY 2022 AND 2032(%)
FIGURE 21. COMPARATIVE SHARE ANALYSIS OF CARBON CREDITS MARKET FOR BASELINE-AND-CREDIT, BY COUNTRY 2022 AND 2032(%)
FIGURE 22. CARBON CREDITS MARKET, BY END-USE INDUSTRY, 2022(%)
FIGURE 23. COMPARATIVE SHARE ANALYSIS OF CARBON CREDITS MARKET FOR AVIATION, BY COUNTRY 2022 AND 2032(%)
FIGURE 24. COMPARATIVE SHARE ANALYSIS OF CARBON CREDITS MARKET FOR ENERGY, BY COUNTRY 2022 AND 2032(%)
FIGURE 25. COMPARATIVE SHARE ANALYSIS OF CARBON CREDITS MARKET FOR INDUSTRIAL, BY COUNTRY 2022 AND 2032(%)
FIGURE 26. COMPARATIVE SHARE ANALYSIS OF CARBON CREDITS MARKET FOR PETROCHEMICAL, BY COUNTRY 2022 AND 2032(%)
FIGURE 27. COMPARATIVE SHARE ANALYSIS OF CARBON CREDITS MARKET FOR OTHERS, BY COUNTRY 2022 AND 2032(%)
FIGURE 28. CARBON CREDITS MARKET BY REGION, 2022
FIGURE 29. U.S. CARBON CREDITS MARKET, 2022-2032 ($MILLION)
FIGURE 30. CANADA CARBON CREDITS MARKET, 2022-2032 ($MILLION)
FIGURE 31. MEXICO CARBON CREDITS MARKET, 2022-2032 ($MILLION)
FIGURE 32. GERMANY CARBON CREDITS MARKET, 2022-2032 ($MILLION)
FIGURE 33. UK CARBON CREDITS MARKET, 2022-2032 ($MILLION)
FIGURE 34. FRANCE CARBON CREDITS MARKET, 2022-2032 ($MILLION)
FIGURE 35. TURKEY CARBON CREDITS MARKET, 2022-2032 ($MILLION)
FIGURE 36. RUSSIA CARBON CREDITS MARKET, 2022-2032 ($MILLION)
FIGURE 37. REST OF EUROPE CARBON CREDITS MARKET, 2022-2032 ($MILLION)
FIGURE 38. CHINA CARBON CREDITS MARKET, 2022-2032 ($MILLION)
FIGURE 39. JAPAN CARBON CREDITS MARKET, 2022-2032 ($MILLION)
FIGURE 40. INDIA CARBON CREDITS MARKET, 2022-2032 ($MILLION)
FIGURE 41. SOUTH KOREA CARBON CREDITS MARKET, 2022-2032 ($MILLION)
FIGURE 42. AUSTRALIA CARBON CREDITS MARKET, 2022-2032 ($MILLION)
FIGURE 43. REST OF ASIA-PACIFIC CARBON CREDITS MARKET, 2022-2032 ($MILLION)
FIGURE 44. BRAZIL CARBON CREDITS MARKET, 2022-2032 ($MILLION)
FIGURE 45. UAE CARBON CREDITS MARKET, 2022-2032 ($MILLION)
FIGURE 46. SAUDI ARABIA CARBON CREDITS MARKET, 2022-2032 ($MILLION)
FIGURE 47. SOUTH AFRICA CARBON CREDITS MARKET, 2022-2032 ($MILLION)
FIGURE 48. REST OF LAMEA CARBON CREDITS MARKET, 2022-2032 ($MILLION)
FIGURE 49. TOP WINNING STRATEGIES, BY YEAR
FIGURE 50. TOP WINNING STRATEGIES, BY DEVELOPMENT
FIGURE 51. TOP WINNING STRATEGIES, BY COMPANY
FIGURE 52. PRODUCT MAPPING OF TOP 10 PLAYERS
FIGURE 53. COMPETITIVE DASHBOARD
FIGURE 54. COMPETITIVE HEATMAP: CARBON CREDITS MARKET
FIGURE 55. TOP PLAYER POSITIONING, 2022
$5730
$6450
$9600
HAVE A QUERY?
OUR CUSTOMER