
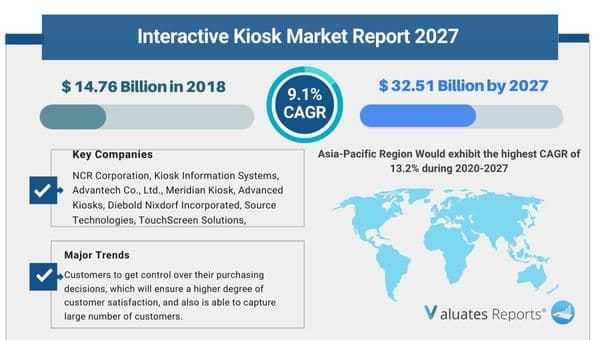
The global interactive kiosk market size was valued at USD 14.76 Billion in 2018 and is projected to reach USD 32.51 Billion by 2027, growing at a CAGR of 9.1% from 2020 to 2027.
An interactive kiosk is a self-service device or a computer terminal deployed in the public sector and helps users to interact with digital content and information through a user-friendly interface. Interactive kiosks are used for retail sales, bill payments, wayfinding, information sharing, and tourism. These kiosks are used in multiple application areas from the healthcare and travel industries, as they help obtain personal information easily from the users.
The emergence of advanced technologies offers enhanced visualizations in several industry verticals including education, corporate, retail, sports & entertainment, transportation, and others. In addition, the interactive kiosk allows customers to get control over their purchasing decisions, which will ensure higher degree of customer satisfaction, and also is able to capture large number of customers. Self-service devices are technological interfaces that enable customers to utilize a service independently without intervention of service provider. The prominent factors impacting on the self-service kiosk industry include rise in demand for self-service machines & automated devices, wireless communication, technology advancements, and remote management.
Increase in demand for automated systems fuels the growth of the interactive kiosk market, as the seamless performance of the self-service machines enhances the overall customer satisfaction and reduces the operational time as compared to manual services. In addition, interactive kiosk technology has become emerging area of the retail industry. Such systems provide moving brand experience inside or outside the brick and mortar location. Thus, adoption of interactive systems in retail applications is also expected to fuel the growth of the interactive kiosk market.
Furthermore, consumers shift toward adoption of self-service systems is also contributing to the growth of the interactive kiosk market, as these systems facilitate users with quick and fast services without intervention of representative and eliminate the waiting time. Moreover, the rapid developments in touch enabled technologies drive the interactive display market growth. However, stringent government regulations and high initial investment associated with self-service kiosk hampers the growth of the interactive kiosk market. Nonetheless, advancement in interactive kiosk such as tele-kiosks with global positioning system (GPS) technology is expected to provide lucrative growth opportunities to the interactive kiosk market.
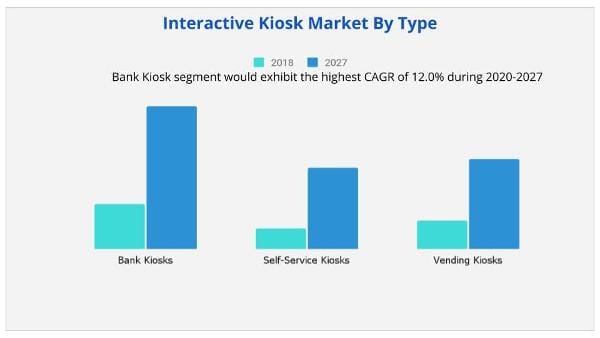
The interactive kiosk market is segmented on the basis of type, display size, industry vertical, and region. Based on type, the market is divided into bank kiosks, self-service kiosks, and vending kiosks. The self-service kiosk segment is further sub-segmented into information kiosk, self-checkout kiosk, ticketing kiosk, photo kiosks, patient information kiosks, check-in kiosks, employment kiosk, and others. The vending kiosk segment includes food & beverage kiosk and others. In 2018, the self-service kiosk segment secured leading position in terms of value and volume, and is expected to follow same trend during the forecast period.
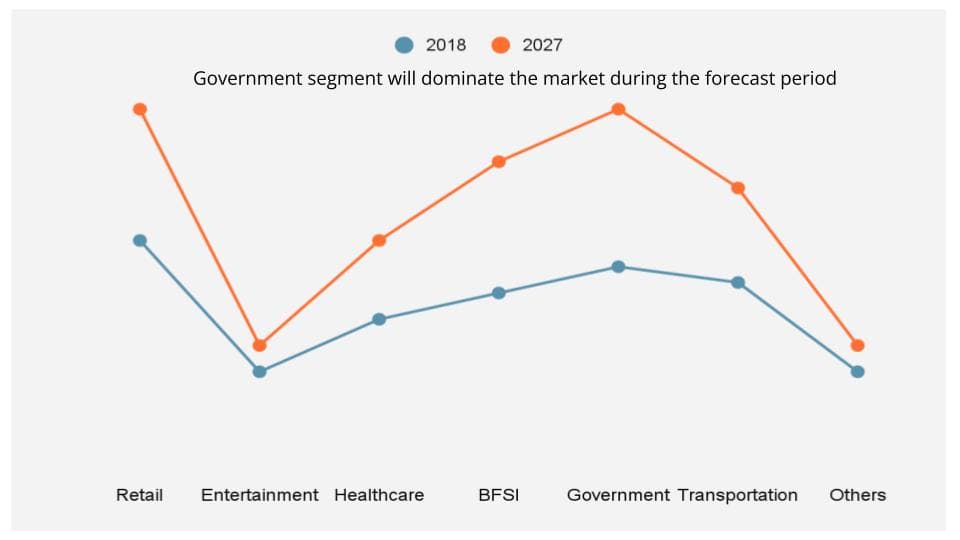
By display size, the market is segmented by less than 17 inch, 17 inch to 19 inch, 20 inch to 22 inch, 23 inch to 25 inch, 26 inch to 30 inch, 31 inch to 34 inch, 35 inch to 40 inch, 41 inch to 44 inch, 45 inch to 49 inch, 50 inch to 55 inch, and more than 55 inch. By industry vertical, the market is divided into retail, entertainment, healthcare, BFSI, government, transportation, and others.
By region, the interactive kiosk market trends are analyzed across North America, Europe, Asia-Pacific, and LAMEA. North America is studied across the U.S., Mexico, and Canada. Europe is analyzed across the UK, Germany, France, and the rest of Europe. The countries covered under Asia-Pacific are China, Taiwan, Japan, South Korea, and rest of Asia-Pacific, while LAMEA includes Latin America, the Middle East, and Africa. In addition, the report covers country-wise cross-sectional analysis of the products and industry vertical segments.
The significant factors impacting in the interactive kiosk market include increase in demand for interactive system in the retail sector, rise in interest of customers in self-service system, surge in adoption of automated systems, and rapid developments in touch enabled technology which drives the growth of market. However, stringent government regulations and high cost associated with self-service kiosk are expected to hinder the interactive kiosk market growth. Conversely, increase in adoption of tele-kiosks with global positioning system (GPS) technology are projected to offer remunerative interactive kiosk market opportunities. Each of these factors is anticipated to have a definite impact on the market during the forecast period.
The key players profiled in the report include NCR Corporation, Kiosk Information Systems, Advantech Co., Ltd., Meridian Kiosk, Advanced Kiosks, Diebold Nixdorf Incorporated, Source Technologies, TouchScreen Solutions, Embross, and REDYREF. These key players have adopted strategies, such as product portfolio expansion, mergers & acquisitions, agreements, geographical expansion, and collaborations to enhance their position in the interactive kiosk industry.
|
Report Metric |
Details |
|
Report Name |
Interactive Kiosk Market |
|
Market size value in 2018 |
USD 14.76 Billion |
|
Revenue forecast in 2028 |
USD 32.51 Billion |
|
Growth Rate |
9.1% |
|
Base year considered |
2018 |
|
Forecast Period |
2020-2027 |
|
By Type |
Bank Kiosks, Self-Service Kiosks, Vending Kiosks |
|
By Industry Vertical |
Retail, Entertainment, Healthcare, BFSI, Government, Transportation |
|
Report Coverage |
Revenue & volume forecast, company share, competitive landscape, growth factors, and trends |
|
Segments Covered |
By Type, Industry Vertical, and Region |
|
Geographic Regions Covered |
North America, Europe, Asia Pacific, Latin America, Middle East & Africa |
Ans. Due to the COVID-19 pandemic, The global interactive kiosk market size was valued at USD 14.76 Billion in 2018 and is projected to reach USD 32.51 Billion by 2027, growing at a CAGR of 9.1% from 2020 to 2027.
Ans. Some of the Major companies are NCR Corporation, Kiosk Information Systems, Advantech Co., Ltd., Meridian Kiosk, Advanced Kiosks, Diebold Nixdorf, Incorporated, Source Technologies, TouchScreen Solutions, Embross, and REDYREF.
3. Does the report provides covid-19 impact analysis?
Ans. Yes, the report includes a COVID-19 impact analysis. Also, it is further extended into every individual segment of the report.
Chapter 1:Introduction
1.1.Report description
1.2.Key benefits for stakeholders
1.3.Key market segments
1.4.Key market players
1.5.Research methodology
1.5.1.Primary research
1.5.2.Secondary research
1.5.3.Analyst tools and models
Chapter 2:Executive summary
2.2.CXO perspective
Chapter 3:MARKET OVERVIEW
3.1.Market definition and scope
3.2.Key findings
3.2.1.Top impacting factors
3.2.2.Top investment pockets
3.3.Key forces shaping interactive kiosk market
3.3.1.Bargaining power of suppliers
3.3.2.Threat of new entrants
3.3.3.Threat of substitutes
3.3.4.Competitive rivalry
3.3.5.Bargaining power of buyers
3.4.Market player positioning, 2019
3.5.Market dynamics
3.5.1.Drivers
3.5.1.1.Upsurge in the demand of automated systems
3.5.1.2.Rise in adoption of interactive system in retail application
3.5.1.3.Increase in interest of customers in self-service system
3.5.1.4.Rise in trend touch-based technology
3.5.2.Restraints
3.5.2.1.Regulations in government policies
3.5.2.2.High cost of self-service system
3.5.3.Opportunity
3.5.3.1.High adoption of tele-kiosks with global positioning system (GPS) technology
3.6.Pricing analysis
3.7.Patent analysis
3.7.1.By region (2011-2019)
3.7.2.By applicant (2011-2019)
Chapter 4:Global Interactive kiosk Market, BY Type
4.1.Overview
4.2.Bank Kiosks
4.2.1.Key market trends, growth factors, and opportunities
4.2.2.Value chain analysis for bank kiosks
4.2.3.Market size and forecast, by region
4.2.4.Market volume and forecast, by region
4.2.5.Market analysis, by country
4.3.Self-service kiosks
4.3.1.Key market trends, growth factors, and opportunities
4.3.2.Value chain analysis for self-service kiosks
4.3.3.Market size and forecast, by region
4.3.4.Market volume and forecast, by region
4.3.5.Market size and forecast, by sub-type
4.3.5.1.Information Kiosk
4.3.5.2.Self-checkout Kiosk
4.3.5.3.Ticketing Kiosk
4.3.5.4.Photo Kiosks
4.3.5.5.Patient Information Kiosks
4.3.5.6.Check-In Kiosks
4.3.5.7.Employment kiosk
4.3.5.8.Others
4.3.6.Market analysis, by country
4.4.Vending kiosks
4.4.1.Key market trends, growth factors, and opportunities
4.4.2.Value chain analysis for vending kiosks
4.4.3.Market size and forecast, by region
4.4.4.Market volume and forecast, by region
4.4.5.Market size and forecast, by type
4.4.5.1.Food & Beverage Vending Kiosks
4.4.5.2.Others
4.4.6.Market analysis by country
Chapter 5:global interactive kiosk market, by display size
5.1.Overview
5.2.Less than 17 inch
5.2.1.Key market trends, growth factors, and opportunities
5.2.2.Market size and forecast, by region
5.2.3.Market volume and forecast, by region
5.2.4.Market analysis, by country
5.3.17 inch to 19 inch
5.3.1.Key market trends, growth factors, and opportunities
5.3.2.Market size and forecast, by region
5.3.3.Market volume and forecast, by region
5.3.4.Market analysis, by country
5.4.20 inch to 22 inch
5.4.1.Key market trends, growth factors, and opportunities
5.4.2.Market size and forecast, by region
5.4.3.Market volume and forecast, by region
5.4.4.Market analysis, by country
5.5.23 inch to 25 inch
5.5.1.Key market trends, growth factors, and opportunities
5.5.2.Market size and forecast, by region
5.5.3.Market volume and forecast, by region
5.5.4.Market analysis, by country
5.6.26 inch to 30 inch
5.6.1.Key market trends, growth factors, and opportunities
5.6.2.Market size and forecast, by region
5.6.3.Market volume and forecast, by region
5.6.4.Market analysis, by country
5.7.31 inch to 34 inch
5.7.1.Key market trends, growth factors, and opportunities
5.7.2.Market size and forecast, by region
5.7.3.Market volume and forecast, by region
5.7.4.Market analysis, by country
5.8.35 inch to 40 inch
5.8.1.Key market trends, growth factors, and opportunities
5.8.2.Market size and forecast, by region
5.8.3.Market volume and forecast, by region
5.8.4.Market analysis, by country
5.9.41 inch to 44 inch
5.9.1.Key market trends, growth factors, and opportunities
5.9.2.Market size and forecast, by region
5.9.3.Market volume and forecast, by region
5.9.4.Market analysis, by country
5.10.45 inch to 49 inch
5.10.1.Key market trends, growth factors, and opportunities
5.10.2.Market size and forecast, by region
5.10.3.Market volume and forecast, by region
5.10.4.Market analysis, by country
5.11.50 inch to 55 inch
5.11.1.Key market trends, growth factors, and opportunities
5.11.2.Market size and forecast, by region
5.11.3.Market volume and forecast, by region
5.11.4.Market analysis, by country
5.12.More than 55 inch
5.12.1.Key market trends, growth factors, and opportunities
5.12.2.Market size and forecast, by region
5.12.3.Market volume and forecast, by region
5.12.4.Market analysis, by country
5.13.Display percentage share in total ASP of kiosk system
Chapter 6:globAL interactive kiosk Market, BY industry vertical
6.1.Overview
6.2.Retail
6.2.1.Key market trends, growth factors, and opportunities
6.2.2.Market size and forecast, by region
6.2.3.Market volume and forecast, by region
6.2.4.Market share analysis, by display size
6.2.4.1.Less than 17 inch
6.2.4.2.17 inch to 19 inch
6.2.4.3.20 inch to 22 inch
6.2.4.4.23 inch to 25 inch
6.2.4.5.26 inch to 30 inch
6.2.4.6.31 inch to 34 inch
6.2.4.7.35 inch to 40 inch
6.2.4.8.41 inch to 44 inch
6.2.4.9.45 inch to 49 inch
6.2.4.10.50 inch to 55 inch
6.2.4.11.More than 55 inch
6.2.5.Market analysis, by country
6.3.Entertainment
6.3.1.Key market trends, growth factors, and opportunities
6.3.2.Market size and forecast, by region
6.3.3.Market volume and forecast, by region
6.3.4.Market share analysis, by display size
6.3.4.1.Less than 17 inch
6.3.4.2.17 inch to 19 inch
6.3.4.3.20 inch to 22 inch
6.3.4.4.23 inch to 25 inch
6.3.4.5.26 inch to 30 inch
6.3.4.6.31 inch to 34 inch
6.3.4.7.35 inch to 40 inch
6.3.4.8.41 inch to 44 inch
6.3.4.9.45 inch to 49 inch
6.3.4.10.50 inch to 55 inch
6.3.4.11.More than 55 inch
6.3.5.Market analysis, by country
6.4.Healthcare
6.4.1.Key market trends, growth factors, and opportunities
6.4.2.Market size and forecast, by region
6.4.3.Market volume and forecast, by region
6.4.4.Market share analysis, by display size
6.4.4.1.Less than 17 inch
6.4.4.2.17 inch to 19 inch
6.4.4.3.20 inch to 22 inch
6.4.4.4.23 inch to 25 inch
6.4.4.5.26 inch to 30 inch
6.4.4.6.31 inch to 34 inch
6.4.4.7.35 inch to 40 inch
6.4.4.8.41 inch to 44 inch
6.4.4.9.45 inch to 49 inch
6.4.4.10.50 inch to 55 inch
6.4.4.11.More than 55 inch
6.4.5.Market analysis, by country
6.5.BFSI
6.5.1.Key market trends, growth factors, and opportunities
6.5.2.Market size and forecast, by region
6.5.3.Market volume and forecast, by region
6.5.4.Market share analysis, by display size
6.5.4.1.Less than 17 inch
6.5.4.2.17 inch to 19 inch
6.5.4.3.20 inch to 22 inch
6.5.4.4.23 inch to 25 inch
6.5.4.5.26 inch to 30 inch
6.5.4.6.31 inch to 34 inch
6.5.4.7.35 inch to 40 inch
6.5.4.8.41 inch to 44 inch
6.5.4.9.45 inch to 49 inch
6.5.4.10.50 inch to 55 inch
6.5.4.11.More than 55 inch
6.5.5.Market analysis, by country
6.6.Government
6.6.1.Key market trends, growth factors and opportunities
6.6.2.Market size and forecast, by region
6.6.3.Market volume and forecast, by region
6.6.4.Market share analysis, by display size
6.6.4.1.Less than 17 inch
6.6.4.2.17 inch to 19 inch
6.6.4.3.20 inch to 22 inch
6.6.4.4.23 inch to 25 inch
6.6.4.5.26 inch to 30 inch
6.6.4.6.31 inch to 34 inch
6.6.4.7.35 inch to 40 inch
6.6.4.8.41 inch to 44 inch
6.6.4.9.45 inch to 49 inch
6.6.4.10.50 inch to 55 inch
6.6.4.11.More than 55 inch
6.6.5.Market analysis by country
6.7.Transportation
6.7.1.Key market trends, growth factors and opportunities
6.7.2.Market size and forecast, by region
6.7.3.Market volume and forecast, by region
6.7.4.Market share analysis, by display size
6.7.4.1.Less than 17 inch
6.7.4.2.17 inch to 19 inch
6.7.4.3.20 inch to 22 inch
6.7.4.4.23 inch to 25 inch
6.7.4.5.26 inch to 30 inch
6.7.4.6.31 inch to 34 inch
6.7.4.7.35 inch to 40 inch
6.7.4.8.41 inch to 44 inch
6.7.4.9.45 inch to 49 inch
6.7.4.10.50 inch to 55 inch
6.7.4.11.More than 55 inch
6.7.5.Market analysis by country
6.8.Others
6.8.1.Key market trends, growth factors and opportunities
6.8.2.Market size and forecast, by region
6.8.3.Market volume and forecast, by region
6.8.4.Market share analysis, by display size
6.8.4.1.Less than 17 inch
6.8.4.2.17 inch to 19 inch
6.8.4.3.20 inch to 22 inch
6.8.4.4.23 inch to 25 inch
6.8.4.5.26 inch to 30 inch
6.8.4.6.31 inch to 34 inch
6.8.4.7.35 inch to 40 inch
6.8.4.8.41 inch to 44 inch
6.8.4.9.45 inch to 49 inch
6.8.4.10.50 inch to 55 inch
6.8.4.11.More than 55 inch
6.8.5.Market analysis by country
Chapter 7:INTERACTIVE Kiosk Market, BY Region
7.1.Overview
7.2.North America
7.2.1.Key market trends, growth factors, and opportunities
7.2.2.Market size and forecast, by type
7.2.3.Market volume and forecast, by type
7.2.4.Market size and forecast, by display size
7.2.5.Market volume and forecast, by display size
7.2.6.Market size and forecast, by industry vertical
7.2.7.Market volume and forecast, by industry vertical
7.2.8.Market analysis by country
7.2.8.1.U.S.
7.2.8.1.1.Market size and forecast, by type
7.2.8.1.2.Market volume and forecast, by type
7.2.8.1.3.Market size and forecast, by display size
7.2.8.1.4.Market volume and forecast, by display size
7.2.8.1.5.Market size and forecast, by industry vertical
7.2.8.1.6.Market volume and forecast, by industry vertical
7.2.8.2.Canada
7.2.8.2.1.Market size and forecast, by type
7.2.8.2.2.Market volume and forecast, by type
7.2.8.2.3.Market size and forecast, by display size
7.2.8.2.4.Market volume and forecast, by display size
7.2.8.2.5.Market size and forecast, by industry vertical
7.2.8.2.6.Market volume and forecast, by industry vertical
7.2.8.3.Mexico
7.2.8.3.1.Market size and forecast, by type
7.2.8.3.2.Market volume and forecast, by type
7.2.8.3.3.Market size and forecast, by display size
7.2.8.3.4.Market volume and forecast, by display size
7.2.8.3.5.Market size and forecast, by industry vertical
7.2.8.3.6.Market volume and forecast, by industry vertical
7.3.Europe
7.3.1.Key market trends, growth factors, and opportunities
7.3.2.Market size and forecast, by type
7.3.3.Market volume and forecast, by type
7.3.4.Market size and forecast, by display size
7.3.5.Market volume and forecast, by display size
7.3.6.Market size and forecast, by industry vertical
7.3.7.Market volume and forecast, by industry vertical
7.3.8.Market analysis by country
7.3.8.1.Germany
7.3.8.1.1.Market size and forecast, by type
7.3.8.1.2.Market volume and forecast, by type
7.3.8.1.3.Market size and forecast, by display size
7.3.8.1.4.Market volume and forecast, by display size
7.3.8.1.5.Market size and forecast, by industry vertical
7.3.8.1.6.Market volume and forecast, by industry vertical
7.3.8.2.France
7.3.8.2.1.Market size and forecast, by type
7.3.8.2.2.Market volume and forecast, by type
7.3.8.2.3.Market size and forecast, by display size
7.3.8.2.4.Market volume and forecast, by display size
7.3.8.2.5.Market size and forecast, by industry vertical
7.3.8.2.6.Market volume and forecast, by industry vertical
7.3.8.3.UK
7.3.8.3.1.Market size and forecast, by type
7.3.8.3.2.Market volume and forecast, by type
7.3.8.3.3.Market size and forecast, by display size
7.3.8.3.4.Market volume and forecast, by display size
7.3.8.3.5.Market size and forecast, by industry vertical
7.3.8.3.6.Market volume and forecast, by industry vertical
7.3.8.4.Rest of Europe
7.3.8.4.1.Market size and forecast, by type
7.3.8.4.2.Market volume and forecast, by type
7.3.8.4.3.Market size and forecast, by display size
7.3.8.4.4.Market volume and forecast, by display size
7.3.8.4.5.Market size and forecast, by industry vertical
7.3.8.4.6.Market volume and forecast, by industry vertical
7.4.Asia-Pacific
7.4.1.Key market trends, growth factors, and opportunities
7.4.2.Market size and forecast, by type
7.4.3.Market volume and forecast, by type
7.4.4.Market size and forecast, by display size
7.4.5.Market volume and forecast, by display size
7.4.6.Market size and forecast, by industry vertical
7.4.7.Market volume and forecast, by industry vertical
7.4.8.Market analysis by country
7.4.8.1.Japan
7.4.8.1.1.Market size and forecast, by type
7.4.8.1.2.Market volume and forecast, by type
7.4.8.1.3.Market size and forecast, by display size
7.4.8.1.4.Market volume and forecast, by display size
7.4.8.1.5.Market size and forecast, by industry vertical
7.4.8.1.6.Market volume and forecast, by industry vertical
7.4.8.2.China
7.4.8.2.1.Market size and forecast, by type
7.4.8.2.2.Market volume and forecast, by type
7.4.8.2.3.Market size and forecast, by display size
7.4.8.2.4.Market volume and forecast, by display size
7.4.8.2.5.Market size and forecast, by industry vertical
7.4.8.2.6.Market volume and forecast, by industry vertical
7.4.8.3.India
7.4.8.3.1.Market size and forecast, by type
7.4.8.3.2.Market volume and forecast, by type
7.4.8.3.3.Market size and forecast, by display size
7.4.8.3.4.Market volume and forecast, by display size
7.4.8.3.5.Market size and forecast, by industry vertical
7.4.8.3.6.Market volume and forecast, by industry vertical
7.4.8.4.South Korea
7.4.8.4.1.Market size and forecast, by type
7.4.8.4.2.Market volume and forecast, by type
7.4.8.4.3.Market size and forecast, by display size
7.4.8.4.4.Market volume and forecast, by display size
7.4.8.4.5.Market size and forecast, by industry vertical
7.4.8.4.6.Market volume and forecast, by industry vertical
7.4.8.5.Rest of Asia-Pacific
7.4.8.5.1.Market size and forecast, by type
7.4.8.5.2.Market volume and forecast, by type
7.4.8.5.3.Market size and forecast, by display size
7.4.8.5.4.Market volume and forecast, by display size
7.4.8.5.5.Market size and forecast, by industry vertical
7.4.8.5.6.Market volume and forecast, by industry vertical
7.5.LAMEA
7.5.1.Key market trends, growth factors, and opportunities
7.5.2.Market size and forecast, by type
7.5.3.Market volume and forecast, by type
7.5.4.Market size and forecast, by display size
7.5.5.Market volume and forecast, by display size
7.5.6.Market size and forecast, by industry vertical
7.5.7.Market volume and forecast, by industry vertical
7.5.8.Market analysis by country
7.5.8.1.Latin America
7.5.8.1.1.Market size and forecast, by type
7.5.8.1.2.Market volume and forecast, by type
7.5.8.1.3.Market size and forecast, by display size
7.5.8.1.4.Market volume and forecast, by display size
7.5.8.1.5.Market size and forecast, by industry vertical
7.5.8.1.6.Market volume and forecast, by industry vertical
7.5.8.2.Middle East
7.5.8.2.1.Market size and forecast, by type
7.5.8.2.2.Market volume and forecast, by type
7.5.8.2.3.Market size and forecast, by display size
7.5.8.2.4.Market volume and forecast, by display size
7.5.8.2.5.Market size and forecast, by industry vertical
7.5.8.2.6.Market volume and forecast, by industry vertical
7.5.8.3.Africa
7.5.8.3.1.Market size and forecast, by type
7.5.8.3.2.Market volume and forecast, by type
7.5.8.3.3.Market size and forecast, by display size
7.5.8.3.4.Market volume and forecast, by display size
7.5.8.3.5.Market size and forecast, by industry vertical
7.5.8.3.6.Market volume and forecast, by industry vertical
Chapter 8:COMPETITIVE LANDSCAPE
8.1.Introduction
8.1.1.Market player positioning, 2019
8.1.2.Market share analysis, 2019
8.1.3.Top winning strategies
8.2.Product mapping of top 10 player
8.3.Competitive dashboard
8.4.Competitive heatmap
8.5.Key developments
8.5.1.New product launches
8.5.2.Other developments
Chapter 9:Company ProfileS
9.1.ADVANCED KIOSKS
9.1.1.Company overview
9.1.2.Key Executives
9.1.3.Company snapshot
9.1.4.Product portfolio
9.2.ADVANTECH CO., LTD.
9.2.1.Company overview
9.2.2.Key Executives
9.2.3.Company snapshot
9.2.4.Product portfolio
9.2.5.R&D Expenditure
9.2.6.Business performance
9.2.7.Key strategic moves and developments
9.3.DIEBOLD NIXDORF, INCORPORATED
9.3.1.Company overview
9.3.2.Key Executives
9.3.3.Company snapshot
9.3.4.Product portfolio
9.3.5.R&D Expenditure
9.3.6.Business performance
9.3.7.Key strategic moves and developments
9.4.EMBROSS
9.4.1.Company overview
9.4.2.Key Executives
9.4.3.Company snapshot
9.4.4.Product portfolio
9.4.5.Key strategic moves and developments
9.5.KIOSK INFORMATION SYSTEMS
9.5.1.Company overview
9.5.2.Key Executives
9.5.3.Company snapshot
9.5.4.Product portfolio
9.5.5.Key strategic moves and developments
9.6.MERIDIAN KIOSKS
9.6.1.Company overview
9.6.2.Key Executives
9.6.3.Company snapshot
9.6.4.Product portfolio
9.7.NCR CORPORATION
9.7.1.Company overview
9.7.2.Key Executives
9.7.3.Company snapshot
9.7.4.Operating business segments
9.7.5.Product portfolio
9.7.6.R&D Expenditure
9.7.7.Business performance
9.7.8.Key strategic moves and developments
9.8.REDYREF
9.8.1.Company overview
9.8.2.Key Executives
9.8.3.Company snapshot
9.8.4.Product portfolio
9.8.5.Key strategic moves and developments
9.9.SOURCE TECHNOLOGIES
9.9.1.Company overview
9.9.2.Key Executives
9.9.3.Company snapshot
9.9.4.Product portfolio
9.9.5.Key strategic moves and developments
9.10.TOUCHSCREEN SOLUTIONS
9.10.1.Company overview
9.10.2.Key Executives
9.10.3.Company snapshot
9.10.4.Product portfolio
TABLE 01.GLOBAL INTERACTIVE KIOSK MARKET REVENUE, BY TYPE, 2018-2027 ($MILLION)
TABLE 02.GLOBAL INTERACTIVE KIOSK MARKET VOLUME, BY TYPE, 2018-2027 (THOUSAND UNITS)
TABLE 03.BANK INTERACTIVE KIOSK MARKET REVENUE, BY REGION, 2018-2027 ($MILLION)
TABLE 04.BANK INTERACTIVE KIOSK MARKET VOLUME, BY REGION, 2018-2027 (THOUSAND UNITS)
TABLE 05.SELF-SERVICE INTERACTIVE KIOSK MARKET REVENUE, BY REGION, 2018-2027 ($MILLION)
TABLE 06.SELF-SERVICE INTERACTIVE KIOSK MARKET VOLUME, BY REGION, 2018-2027 (THOUSAND UNITS)
TABLE 07.SELF-SERVICE INTERACTIVE KIOSK MARKET REVENUE, BY SUB-TYPE, 2018-2027 ($MILLION)
TABLE 08.SELF-SERVICE KIOSK INTERACTIVE KIOSK MARKET VOLUME, BY SUB-TYPE, 2018-2027 (MILLION UNITS)
TABLE 09.VENDING INTERACTIVE KIOSK MARKET REVENUE, BY REGION 2018-2027 ($BILLION)
TABLE 10.VENDING INTERACTIVE KIOSK MARKET VOLUME, BY REGION 2018-2027 ($BILLION)
TABLE 11.VENDING INTERACTIVE KIOSK MARKET REVENUE, BY SUB-TYPE, 2018-2027 ($MILLION)
TABLE 12.VENDING INTERACTIVE KIOSK MARKET VOLUME, BY SUB-TYPE, 2018-2027 (MILLION UNITS)
TABLE 13.GLOBAL INTERACTIVE KIOSK MARKET REVENUE, BY DISPLAY SIZE, 2018-2027 ($MILLION)
TABLE 14.GLOBAL INTERACTIVE KIOSK MARKET VOLUME, BY DISPLAY SIZE, 2018-2027 (THOUSAND UNITS)
TABLE 15.LESS THAN 17 INCH INTERACTIVE KIOSK MARKET REVENUE, BY REGION, 2018-2027 ($MILLION)
TABLE 16.LESS THAN 17 INCH INTERACTIVE KIOSK MARKET VOLUME, BY REGION, 2018-2027 (THOUSAND UNITS)
TABLE 17.17 INCH TO 19 INCH INTERACTIVE KIOSK MARKET REVENUE, BY REGION, 2018-2027 ($MILLION)
TABLE 18.17 INCH TO 19 INCH INTERACTIVE KIOSK MARKET VOLUME, BY REGION, 2018-2027 (THOUSAND UNITS)
TABLE 19.20 INCH TO 22 INCH INTERACTIVE KIOSK MARKET REVENUE, BY REGION, 2018-2027 ($MILLION)
TABLE 20.20 INCH TO 22 INCH INTERACTIVE KIOSK MARKET VOLUME, BY REGION, 2018-2027 (THOUSAND UNITS)
TABLE 21.23 INCH TO 25 INCH INTERACTIVE KIOSK MARKET REVENUE, BY REGION, 2018-2027 ($MILLION)
TABLE 22.23 INCH TO 25 INCH INTERACTIVE KIOSK MARKET VOLUME, BY REGION, 2018-2027 (THOUSAND UNITS)
TABLE 23.26 INCH TO 30 INCH INTERACTIVE KIOSK MARKET REVENUE, BY REGION, 2018-2027 ($MILLION)
TABLE 24.26 INCH TO 30 INCH INTERACTIVE KIOSK MARKET VOLUME, BY REGION, 2018-2027 (THOUSAND UNITS)
TABLE 25.31 INCH TO 34 INCH INTERACTIVE KIOSK MARKET REVENUE, BY REGION, 2018-2027 ($MILLION)
TABLE 26.31 INCH TO 34 INCH INTERACTIVE KIOSK MARKET VOLUME, BY REGION, 2018-2027 (THOUSAND UNITS)
TABLE 27.35 INCH TO 40 INCH INTERACTIVE KIOSK MARKET REVENUE, BY REGION, 2018-2027 ($MILLION)
TABLE 28.35 INCH TO 40 INCH INTERACTIVE KIOSK MARKET VOLUME, BY REGION, 2018-2027 (THOUSAND UNITS)
TABLE 29.41 INCH TO 44 INCH INTERACTIVE KIOSK MARKET REVENUE, BY REGION, 2018-2027 ($MILLION)
TABLE 30.41 INCH TO 44 INCH INTERACTIVE KIOSK MARKET VOLUME, BY REGION, 2018-2027 (THOUSAND UNITS)
TABLE 31.45 INCH TO 49 INCH INTERACTIVE KIOSK MARKET REVENUE, BY REGION, 2018-2027 ($MILLION)
TABLE 32.45 INCH TO 49 INCH INTERACTIVE KIOSK MARKET VOLUME, BY REGION, 2018-2027 (THOUSAND UNITS)
TABLE 33.50 INCH TO 55 INCH INTERACTIVE KIOSK MARKET REVENUE, BY REGION, 2018-2027 ($MILLION)
TABLE 34.50 INCH TO 55 INCH INTERACTIVE KIOSK MARKET VOLUME, BY REGION, 2018-2027 (THOUSAND UNITS)
TABLE 35.MORE THAN 55 INCH INTERACTIVE KIOSK MARKET REVENUE, BY REGION, 2018-2027 ($MILLION)
TABLE 36.MORE THAN 55 INCH INTERACTIVE KIOSK MARKET VOLUME, BY REGION, 2018-2027 (THOUSAND UNITS)
TABLE 37.DISPLAY PERCENTAGE SHARE IN TOTAL ASP OF KIOSK SYSTEM
TABLE 38.GLOBAL INTERACTIVE KIOSK MARKET REVENUE, BY INDUSTRY VERTICAL, 2018-2027 ($MILLION)
TABLE 39.GLOBAL INTERACTIVE KIOSK MARKET VOLUME, BY INDUSTRY VERTICAL, 2018-2027 (THOUSAND UNITS)
TABLE 40.INTERACTIVE KIOSK MARKET REVENUE FOR RETAIL, BY REGION, 2018-2027 ($MILLION)
TABLE 41.INTERACTIVE KIOSK MARKET VOLUME FOR RETAIL, BY REGION, 2018-2027 (THOUSAND UNITS)
TABLE 42.LESS THAN 17 INCH INTERACTIVE KIOSK MARKET REVENUE FOR RETAIL, BY REGION, 2018-2027 ($MILLION)
TABLE 43.LESS THAN 17 INCH INTERACTIVE KIOSK MARKET VOLUME FOR RETAIL, BY REGION, 2018-2027 (THOUSAND UNITS)
TABLE 44.17 INCH TO 19 INCH INTERACTIVE KIOSK MARKET REVENUE FOR RETAIL, BY REGION, 2018-2027 ($MILLION)
TABLE 45.17 INCH TO 19 INCH INTERACTIVE KIOSK MARKET VOLUME FOR RETAIL, BY REGION, 2018-2027 (THOUSAND UNITS)
TABLE 46.20 INCH TO 22 INCH INTERACTIVE KIOSK MARKET REVENUE FOR RETAIL, BY REGION, 2018-2027 ($MILLION)
TABLE 47.20 INCH TO 22 INCH INTERACTIVE KIOSK MARKET VOLUME FOR RETAIL, BY REGION, 2018-2027 (THOUSAND UNITS)
TABLE 48.23 INCH TO 25 INCH INTERACTIVE KIOSK MARKET REVENUE FOR RETAIL, BY REGION, 2018-2027 ($MILLION)
TABLE 49.23 INCH TO 25 INCH INTERACTIVE KIOSK MARKET VOLUME FOR RETAIL, BY REGION, 2018-2027 (THOUSAND UNITS)
TABLE 50.26 INCH TO 30 INCH INTERACTIVE KIOSK MARKET REVENUE FOR RETAIL, BY REGION, 2018-2027 ($MILLION)
TABLE 51.26 INCH TO 30 INCH INTERACTIVE KIOSK MARKET VOLUME FOR RETAIL, BY REGION, 2018-2027 (THOUSAND UNITS)
TABLE 52.31 INCH TO 34 INCH INTERACTIVE KIOSK MARKET REVENUE FOR RETAIL, BY REGION, 2018-2027 ($MILLION)
TABLE 53.31 INCH TO 34 INCH INTERACTIVE KIOSK MARKET VOLUME FOR RETAIL, BY REGION, 2018-2027 (THOUSAND UNITS)
TABLE 54.35 INCH TO 40 INCH INTERACTIVE KIOSK MARKET REVENUE FOR RETAIL, BY REGION, 2018-2027 ($MILLION)
TABLE 55.35 INCH TO 40 INCH INTERACTIVE KIOSK MARKET VOLUME FOR RETAIL, BY REGION, 2018-2027 (THOUSAND UNITS)
TABLE 56.41 INCH TO 44 INCH INTERACTIVE KIOSK MARKET REVENUE FOR RETAIL, BY REGION, 2018-2027 ($MILLION)
TABLE 57.41 INCH TO 44 INCH INTERACTIVE KIOSK MARKET VOLUME FOR RETAIL, BY REGION, 2018-2027 (THOUSAND UNITS)
TABLE 58.45 INCH TO 49 INCH INTERACTIVE KIOSK MARKET REVENUE FOR RETAIL, BY REGION, 2018-2027 ($MILLION)
TABLE 59.45 INCH TO 49 INCH INTERACTIVE KIOSK MARKET VOLUME FOR RETAIL, BY REGION, 2018-2027 (THOUSAND UNITS)
TABLE 60.50 INCH TO 55 INCH INTERACTIVE KIOSK MARKET REVENUE FOR RETAIL, BY REGION, 2018-2027 ($MILLION)
TABLE 61.50 INCH TO 55 INCH INTERACTIVE KIOSK MARKET VOLUME FOR RETAIL, BY REGION, 2018-2027 (THOUSAND UNITS)
TABLE 62.MORE THAN 55 INCH INTERACTIVE KIOSK MARKET REVENUE FOR RETAIL, BY REGION, 2018-2027 ($MILLION)
TABLE 63.MORE THAN 55 INCH INTERACTIVE KIOSK MARKET VOLUME FOR RETAIL, BY REGION, 2018-2027 (THOUSAND UNITS)
TABLE 64.INTERACTIVE KIOSK MARKET REVENUE FOR ENTERTAINMENT, BY REGION, 2018-2027 ($MILLION)
TABLE 65.INTERACTIVE KIOSK MARKET VOLUME FOR ENTERTAINMENT, BY REGION, 2018-2027 (THOUSAND UNITS)
TABLE 66.LESS THAN 17 INCH INTERACTIVE KIOSK MARKET REVENUE FOR ENTERTAINMENT, BY REGION, 2018-2027 ($MILLION)
TABLE 67.LESS THAN 17 INCH INTERACTIVE KIOSK MARKET VOLUME FOR ENTERTAINMENT, BY REGION, 2018-2027 (THOUSAND UNITS)
TABLE 68.17 INCH TO 19 INCH INTERACTIVE KIOSK MARKET REVENUE FOR ENTERTAINMENT, BY REGION, 2018-2027 ($MILLION)
TABLE 69.17 INCH TO 19 INCH INTERACTIVE KIOSK MARKET VOLUME FOR ENTERTAINMENT, BY REGION, 2018-2027 (THOUSAND UNITS)
TABLE 70.20 INCH TO 22 INCH INTERACTIVE KIOSK MARKET REVENUE FOR ENTERTAINMENT, BY REGION, 2018-2027 ($MILLION)
TABLE 71.20 INCH TO 22 INCH INTERACTIVE KIOSK MARKET VOLUME FOR ENTERTAINMENT, BY REGION, 2018-2027 (THOUSAND UNITS)
TABLE 72.23 INCH TO 25 INCH INTERACTIVE KIOSK MARKET REVENUE FOR ENTERTAINMENT, BY REGION, 2018-2027 ($MILLION)
TABLE 73.23 INCH TO 25 INCH INTERACTIVE KIOSK MARKET VOLUME FOR ENTERTAINMENT, BY REGION, 2018-2027 (THOUSAND UNITS)
TABLE 74.26 INCH TO 30 INCH INTERACTIVE KIOSK MARKET REVENUE FOR ENTERTAINMENT, BY REGION, 2018-2027 ($MILLION)
TABLE 75.26 INCH TO 30 INCH INTERACTIVE KIOSK MARKET VOLUME FOR ENTERTAINMENT, BY REGION, 2018-2027 (THOUSAND UNITS)
TABLE 76.31 INCH TO 34 INCH INTERACTIVE KIOSK MARKET REVENUE FOR ENTERTAINMENT, BY REGION, 2018-2027 ($MILLION)
TABLE 77.31 INCH TO 34 INCH INTERACTIVE KIOSK MARKET VOLUME FOR ENTERTAINMENT, BY REGION, 2018-2027 (THOUSAND UNITS)
TABLE 78.35 INCH TO 40 INCH INTERACTIVE KIOSK MARKET REVENUE FOR ENTERTAINMENT, BY REGION, 2018-2027 ($MILLION)
TABLE 79.35 INCH TO 40 INCH INTERACTIVE KIOSK MARKET VOLUME FOR ENTERTAINMENT, BY REGION, 2018-2027 (THOUSAND UNITS)
TABLE 80.41 INCH TO 44 INCH INTERACTIVE KIOSK MARKET REVENUE FOR ENTERTAINMENT, BY REGION, 2018-2027 ($MILLION)
TABLE 81.41 INCH TO 44 INCH INTERACTIVE KIOSK MARKET VOLUME FOR ENTERTAINMENT, BY REGION, 2018-2027 (THOUSAND UNITS)
TABLE 82.45 INCH TO 49 INCH INTERACTIVE KIOSK MARKET REVENUE FOR ENTERTAINMENT, BY REGION, 2018-2027 ($MILLION)
TABLE 83.45 INCH TO 49 INCH INTERACTIVE KIOSK MARKET VOLUME FOR ENTERTAINMENT, BY REGION, 2018-2027 (THOUSAND UNITS)
TABLE 84.50 INCH TO 55 INCH INTERACTIVE KIOSK MARKET REVENUE FOR ENTERTAINMENT, BY REGION, 2018-2027 ($MILLION)
TABLE 85.50 INCH TO 55 INCH INTERACTIVE KIOSK MARKET VOLUME FOR ENTERTAINMENT, BY REGION, 2018-2027 (THOUSAND UNITS)
TABLE 86.MORE THAN 55 INCH INTERACTIVE KIOSK MARKET REVENUE FOR ENTERTAINMENT, BY REGION, 2018-2027 ($MILLION)
TABLE 87.MORE THAN 55 INCH INTERACTIVE KIOSK MARKET VOLUME FOR ENTERTAINMENT, BY REGION, 2018-2027 (THOUSAND UNITS)
TABLE 88.INTERACTIVE KIOSK MARKET REVENUE FOR HEALTHCARE, BY REGION, 2018-2027 ($MILLION)
TABLE 89.INTERACTIVE KIOSK MARKET VOLUME FOR HEALTHCARE, BY REGION, 2018-2027 (THOUSAND UNITS)
TABLE 90.LESS THAN 17 INCH INTERACTIVE KIOSK MARKET REVENUE FOR HEALTHCARE, BY REGION, 2018-2027 ($MILLION)
TABLE 91.LESS THAN 17 INCH INTERACTIVE KIOSK MARKET VOLUME FOR HEALTHCARE, BY REGION, 2018-2027 (THOUSAND UNITS)
TABLE 92.17 INCH TO 19 INCH INTERACTIVE KIOSK MARKET REVENUE FOR HEALTHCARE, BY REGION, 2018-2027 ($MILLION)
TABLE 93.17 INCH TO 19 INCH INTERACTIVE KIOSK MARKET VOLUME FOR HEALTHCARE, BY REGION, 2018-2027 (THOUSAND UNITS)
TABLE 94.20 INCH TO 22 INCH INTERACTIVE KIOSK MARKET REVENUE FOR HEALTHCARE, BY REGION, 2018-2027 ($MILLION)
TABLE 95.20 INCH TO 22 INCH INTERACTIVE KIOSK MARKET VOLUME FOR HEALTHCARE, BY REGION, 2018-2027 (THOUSAND UNITS)
TABLE 96.23 INCH TO 25 INCH INTERACTIVE KIOSK MARKET REVENUE FOR HEALTHCARE, BY REGION, 2018-2027 ($MILLION)
TABLE 97.23 INCH TO 25 INCH INTERACTIVE KIOSK MARKET VOLUME FOR HEALTHCARE, BY REGION, 2018-2027 (THOUSAND UNITS)
TABLE 98.26 INCH TO 30 INCH INTERACTIVE KIOSK MARKET REVENUE FOR HEALTHCARE, BY REGION, 2018-2027 ($MILLION)
TABLE 99.26 INCH TO 30 INCH INTERACTIVE KIOSK MARKET VOLUME FOR HEALTHCARE, BY REGION, 2018-2027 (THOUSAND UNITS)
TABLE 100.31 INCH TO 34 INCH INTERACTIVE KIOSK MARKET REVENUE FOR HEALTHCARE, BY REGION, 2018-2027 ($MILLION)
TABLE 101.31 INCH TO 34 INCH INTERACTIVE KIOSK MARKET VOLUME FOR HEALTHCARE, BY REGION, 2018-2027 (THOUSAND UNITS)
TABLE 102.35 INCH TO 40 INCH INTERACTIVE KIOSK MARKET REVENUE FOR HEALTHCARE, BY REGION, 2018-2027 ($MILLION)
TABLE 103.35 INCH TO 40 INCH INTERACTIVE KIOSK MARKET VOLUME FOR HEALTHCARE, BY REGION, 2018-2027 (THOUSAND UNITS)
TABLE 104.41 INCH TO 44 INCH INTERACTIVE KIOSK MARKET REVENUE FOR HEALTHCARE, BY REGION, 2018-2027 ($MILLION)
TABLE 105.41 INCH TO 44 INCH INTERACTIVE KIOSK MARKET VOLUME FOR HEALTHCARE, BY REGION, 2018-2027 (THOUSAND UNITS)
TABLE 106.45 INCH TO 49 INCH INTERACTIVE KIOSK MARKET REVENUE FOR HEALTHCARE, BY REGION, 2018-2027 ($MILLION)
TABLE 107.45 INCH TO 49 INCH INTERACTIVE KIOSK MARKET VOLUME FOR HEALTHCARE, BY REGION, 2018-2027 (THOUSAND UNITS)
TABLE 108.50 INCH TO 55 INCH INTERACTIVE KIOSK MARKET REVENUE FOR HEALTHCARE, BY REGION, 2018-2027 ($MILLION)
TABLE 109.50 INCH TO 55 INCH INTERACTIVE KIOSK MARKET VOLUME FOR HEALTHCARE, BY REGION, 2018-2027 (THOUSAND UNITS)
TABLE 110.MORE THAN 55 INCH INTERACTIVE KIOSK MARKET REVENUE FOR HEALTHCARE, BY REGION, 2018-2027 ($MILLION)
TABLE 111.MORE THAN 55 INCH INTERACTIVE KIOSK MARKET VOLUME FOR HEALTHCARE, BY REGION, 2018-2027 (THOUSAND UNITS)
TABLE 112.INTERACTIVE KIOSK MARKET REVENUE FOR BFSI, BY REGION, 2018-2027 ($MILLION)
TABLE 113.INTERACTIVE KIOSK MARKET VOLUME FOR BFSI, BY REGION, 2018-2027 (THOUSAND UNITS)
TABLE 114.LESS THAN 17 INCH INTERACTIVE KIOSK MARKET REVENUE FOR BFSI, BY REGION, 2018-2027 ($MILLION)
TABLE 115.LESS THAN 17 INCH INTERACTIVE KIOSK MARKET VOLUME FOR BFSI, BY REGION, 2018-2027 (THOUSAND UNITS)
TABLE 116.17 INCH TO 19 INCH INTERACTIVE KIOSK MARKET REVENUE FOR BFSI, BY REGION, 2018-2027 ($MILLION)
TABLE 117.17 INCH TO 19 INCH INTERACTIVE KIOSK MARKET VOLUME FOR BFSI, BY REGION, 2018-2027 (THOUSAND UNITS)
TABLE 118.20 INCH TO 22 INCH INTERACTIVE KIOSK MARKET REVENUE FOR BFSI, BY REGION, 2018-2027 ($MILLION)
TABLE 119.20 INCH TO 22 INCH INTERACTIVE KIOSK MARKET VOLUME FOR BFSI, BY REGION, 2018-2027 (THOUSAND UNITS)
TABLE 120.23 INCH TO 25 INCH INTERACTIVE KIOSK MARKET REVENUE FOR BFSI, BY REGION, 2018-2027 ($MILLION)
TABLE 121.23 INCH TO 25 INCH INTERACTIVE KIOSK MARKET VOLUME FOR BFSI, BY REGION, 2018-2027 (THOUSAND UNITS)
TABLE 122.26 INCH TO 30 INCH INTERACTIVE KIOSK MARKET REVENUE FOR BFSI, BY REGION, 2018-2027 ($MILLION)
TABLE 123.26 INCH TO 30 INCH INTERACTIVE KIOSK MARKET VOLUME FOR BFSI, BY REGION, 2018-2027 (THOUSAND UNITS)
TABLE 124.31 INCH TO 34 INCH INTERACTIVE KIOSK MARKET REVENUE FOR BFSI, BY REGION, 2018-2027 ($MILLION)
TABLE 125.31 INCH TO 34 INCH INTERACTIVE KIOSK MARKET VOLUME FOR BFSI, BY REGION, 2018-2027 (THOUSAND UNITS)
TABLE 126.35 INCH TO 40 INCH INTERACTIVE KIOSK MARKET REVENUE FOR BFSI, BY REGION, 2018-2027 ($MILLION)
TABLE 127.35 INCH TO 40 INCH INTERACTIVE KIOSK MARKET VOLUME FOR BFSI, BY REGION, 2018-2027 (THOUSAND UNITS)
TABLE 128.41 INCH TO 44 INCH INTERACTIVE KIOSK MARKET REVENUE FOR BFSI, BY REGION, 2018-2027 ($MILLION)
TABLE 129.41 INCH TO 44 INCH INTERACTIVE KIOSK MARKET VOLUME FOR BFSI, BY REGION, 2018-2027 (THOUSAND UNITS)
TABLE 130.45 INCH TO 49 INCH INTERACTIVE KIOSK MARKET REVENUE FOR BFSI, BY REGION, 2018-2027 ($MILLION)
TABLE 131.45 INCH TO 49 INCH INTERACTIVE KIOSK MARKET VOLUME FOR BFSI, BY REGION, 2018-2027 (THOUSAND UNITS)
TABLE 132.50 INCH TO 55 INCH INTERACTIVE KIOSK MARKET REVENUE FOR BFSI, BY REGION, 2018-2027 ($MILLION)
TABLE 133.50 INCH TO 55 INCH INTERACTIVE KIOSK MARKET VOLUME FOR BFSI, BY REGION, 2018-2027 (THOUSAND UNITS)
TABLE 134.MORE THAN 55 INCH INTERACTIVE KIOSK MARKET REVENUE FOR BFSI, BY REGION, 2018-2027 ($MILLION)
TABLE 135.MORE THAN 55 INCH INTERACTIVE KIOSK MARKET VOLUME FOR BFSI, BY REGION, 2018-2027 (THOUSAND UNITS)
TABLE 136.INTERACTIVE KIOSK MARKET REVENUE FOR GOVERNMENT, BY REGION 2018–2026 ($MILLION)
TABLE 137.INTERACTIVE KIOSK MARKET VOLUME FOR GOVERNMENT, BY REGION 2018–2026 (THOUSAND UNITS)
TABLE 138.LESS THAN 17 INCH INTERACTIVE KIOSK MARKET REVENUE FOR GOVERNMENT, BY REGION, 2018-2027 ($MILLION)
TABLE 139.LESS THAN 17 INCH INTERACTIVE KIOSK MARKET VOLUME FOR GOVERNMENT, BY REGION, 2018-2027 (THOUSAND UNITS)
TABLE 140.17 INCH TO 19 INCH INTERACTIVE KIOSK MARKET REVENUE FOR GOVERNMENT, BY REGION, 2018-2027 ($MILLION)
TABLE 141.17 INCH TO 19 INCH INTERACTIVE KIOSK MARKET VOLUME FOR GOVERNMENT, BY REGION, 2018-2027 (THOUSAND UNITS)
TABLE 142.20 INCH TO 22 INCH INTERACTIVE KIOSK MARKET REVENUE FOR GOVERNMENT, BY REGION, 2018-2027 ($MILLION)
TABLE 143.20 INCH TO 22 INCH INTERACTIVE KIOSK MARKET VOLUME FOR GOVERNMENT, BY REGION, 2018-2027 (THOUSAND UNITS)
TABLE 144.23 INCH TO 25 INCH INTERACTIVE KIOSK MARKET REVENUE FOR GOVERNMENT, BY REGION, 2018-2027 ($MILLION)
TABLE 145.23 INCH TO 25 INCH INTERACTIVE KIOSK MARKET VOLUME FOR GOVERNMENT, BY REGION, 2018-2027 (THOUSAND UNITS)
TABLE 146.26 INCH TO 30 INCH INTERACTIVE KIOSK MARKET REVENUE FOR GOVERNMENT, BY REGION, 2018-2027 ($MILLION)
TABLE 147.26 INCH TO 30 INCH INTERACTIVE KIOSK MARKET VOLUME FOR GOVERNMENT, BY REGION, 2018-2027 (THOUSAND UNITS)
TABLE 148.31 INCH TO 34 INCH INTERACTIVE KIOSK MARKET REVENUE FOR GOVERNMENT, BY REGION, 2018-2027 ($MILLION)
TABLE 149.31 INCH TO 34 INCH INTERACTIVE KIOSK MARKET VOLUME FOR GOVERNMENT, BY REGION, 2018-2027 (THOUSAND UNITS)
TABLE 150.35 INCH TO 40 INCH INTERACTIVE KIOSK MARKET REVENUE FOR GOVERNMENT, BY REGION, 2018-2027 ($MILLION)
TABLE 151.35 INCH TO 40 INCH INTERACTIVE KIOSK MARKET VOLUME FOR GOVERNMENT, BY REGION, 2018-2027 (THOUSAND UNITS)
TABLE 152.41 INCH TO 44 INCH INTERACTIVE KIOSK MARKET REVENUE FOR GOVERNMENT, BY REGION, 2018-2027 ($MILLION)
TABLE 153.41 INCH TO 44 INCH INTERACTIVE KIOSK MARKET VOLUME FOR GOVERNMENT, BY REGION, 2018-2027 (THOUSAND UNITS)
TABLE 154.45 INCH TO 49 INCH INTERACTIVE KIOSK MARKET REVENUE FOR GOVERNMENT, BY REGION, 2018-2027 ($MILLION)
TABLE 155.45 INCH TO 49 INCH INTERACTIVE KIOSK MARKET VOLUME FOR GOVERNMENT, BY REGION, 2018-2027 (THOUSAND UNITS)
TABLE 156.50 INCH TO 55 INCH INTERACTIVE KIOSK MARKET REVENUE FOR GOVERNMENT, BY REGION, 2018-2027 ($MILLION)
TABLE 157.50 INCH TO 55 INCH INTERACTIVE KIOSK MARKET VOLUME FOR GOVERNMENT, BY REGION, 2018-2027 (THOUSAND UNITS)
TABLE 158.MORE THAN 55 INCH INTERACTIVE KIOSK MARKET REVENUE FOR GOVERNMENT, BY REGION, 2018-2027 ($MILLION)
TABLE 159.MORE THAN 55 INCH INTERACTIVE KIOSK MARKET VOLUME FOR GOVERNMENT, BY REGION, 2018-2027 (THOUSAND UNITS)
TABLE 160.INTERACTIVE KIOSK MARKET REVENUE FOR TRANSPORTATION, BY REGION 2018–2026 ($MILLION)
TABLE 161.INTERACTIVE KIOSK MARKET VOLUME FOR TRANSPORTATION, BY REGION 2018–2026 (THOUSAND UNITS)
TABLE 162.LESS THAN 17 INCH INTERACTIVE KIOSK MARKET REVENUE FOR TRANSPORTATION, BY REGION, 2018-2027 ($MILLION)
TABLE 163.LESS THAN 17 INCH INTERACTIVE KIOSK MARKET VOLUME FOR TRANSPORTATION, BY REGION, 2018-2027 (THOUSAND UNITS)
TABLE 164.17 INCH TO 19 INCH INTERACTIVE KIOSK MARKET REVENUE FOR TRANSPORTATION, BY REGION, 2018-2027 ($MILLION)
TABLE 165.17 INCH TO 19 INCH INTERACTIVE KIOSK MARKET VOLUME FOR TRANSPORTATION, BY REGION, 2018-2027 (THOUSAND UNITS)
TABLE 166.20 INCH TO 22 INCH INTERACTIVE KIOSK MARKET REVENUE FOR TRANSPORTATION, BY REGION, 2018-2027 ($MILLION)
TABLE 167.20 INCH TO 22 INCH INTERACTIVE KIOSK MARKET VOLUME FOR TRANSPORTATION, BY REGION, 2018-2027 (THOUSAND UNITS)
TABLE 168.23 INCH TO 25 INCH INTERACTIVE KIOSK MARKET REVENUE FOR TRANSPORTATION, BY REGION, 2018-2027 ($MILLION)
TABLE 169.23 INCH TO 25 INCH INTERACTIVE KIOSK MARKET VOLUME FOR TRANSPORTATION, BY REGION, 2018-2027 (THOUSAND UNITS)
TABLE 170.26 INCH TO 30 INCH INTERACTIVE KIOSK MARKET REVENUE FOR TRANSPORTATION, BY REGION, 2018-2027 ($MILLION)
TABLE 171.26 INCH TO 30 INCH INTERACTIVE KIOSK MARKET VOLUME FOR TRANSPORTATION, BY REGION, 2018-2027 (THOUSAND UNITS)
TABLE 172.31 INCH TO 34 INCH INTERACTIVE KIOSK MARKET REVENUE FOR TRANSPORTATION, BY REGION, 2018-2027 ($MILLION)
TABLE 173.31 INCH TO 34 INCH INTERACTIVE KIOSK MARKET VOLUME FOR TRANSPORTATION, BY REGION, 2018-2027 (THOUSAND UNITS)
TABLE 174.35 INCH TO 40 INCH INTERACTIVE KIOSK MARKET REVENUE FOR TRANSPORTATION, BY REGION, 2018-2027 ($MILLION)
TABLE 175.35 INCH TO 40 INCH INTERACTIVE KIOSK MARKET VOLUME FOR TRANSPORTATION, BY REGION, 2018-2027 (THOUSAND UNITS)
TABLE 176.41 INCH TO 44 INCH INTERACTIVE KIOSK MARKET REVENUE FOR TRANSPORTATION, BY REGION, 2018-2027 ($MILLION)
TABLE 177.41 INCH TO 44 INCH INTERACTIVE KIOSK MARKET VOLUME FOR TRANSPORTATION, BY REGION, 2018-2027 (THOUSAND UNITS)
TABLE 178.45 INCH TO 49 INCH INTERACTIVE KIOSK MARKET REVENUE FOR TRANSPORTATION, BY REGION, 2018-2027 ($MILLION)
TABLE 179.45 INCH TO 49 INCH INTERACTIVE KIOSK MARKET VOLUME FOR TRANSPORTATION, BY REGION, 2018-2027 (THOUSAND UNITS)
TABLE 180.50 INCH TO 55 INCH INTERACTIVE KIOSK MARKET REVENUE FOR TRANSPORTATION, BY REGION, 2018-2027 ($MILLION)
TABLE 181.50 INCH TO 55 INCH INTERACTIVE KIOSK MARKET VOLUME FOR TRANSPORTATION, BY REGION, 2018-2027 (THOUSAND UNITS)
TABLE 182.MORE THAN 55 INCH INTERACTIVE KIOSK MARKET REVENUE FOR TRANSPORTATION, BY REGION, 2018-2027 ($MILLION)
TABLE 183.MORE THAN 55 INCH INTERACTIVE KIOSK MARKET VOLUME FOR TRANSPORTATION, BY REGION, 2018-2027 (THOUSAND UNITS)
TABLE 184.INTERACTVIE KIOSK MARKET REVENUE FOR OTHERS, BY REGION, 2018–2026 ($MILLION)
TABLE 185.INTERACTVIE KIOSK MARKET VOLUME FOR OTHERS, BY REGION, 2018–2026 (THOUSAND UNITS)
TABLE 186.LESS THAN 17 INCH INTERACTIVE KIOSK MARKET REVENUE FOR OTHERS, BY REGION, 2018-2027 ($MILLION)
TABLE 187.LESS THAN 17 INCH INTERACTIVE KIOSK MARKET VOLUME FOR OTHERS, BY REGION, 2018-2027 (THOUSAND UNITS)
TABLE 188.17 INCH TO 19 INCH INTERACTIVE KIOSK MARKET REVENUE FOR OTHERS, BY REGION, 2018-2027 ($MILLION)
TABLE 189.17 INCH TO 19 INCH INTERACTIVE KIOSK MARKET VOLUME FOR OTHERS, BY REGION, 2018-2027 (THOUSAND UNITS)
TABLE 190.20 INCH TO 22 INCH INTERACTIVE KIOSK MARKET REVENUE FOR OTHERS, BY REGION, 2018-2027 ($MILLION)
TABLE 191.20 INCH TO 22 INCH INTERACTIVE KIOSK MARKET VOLUME FOR OTHERS, BY REGION, 2018-2027 (THOUSAND UNITS)
TABLE 192.23 INCH TO 25 INCH INTERACTIVE KIOSK MARKET REVENUE FOR OTHERS, BY REGION, 2018-2027 ($MILLION)
TABLE 193.23 INCH TO 25 INCH INTERACTIVE KIOSK MARKET VOLUME FOR OTHERS, BY REGION, 2018-2027 (THOUSAND UNITS)
TABLE 194.26 INCH TO 30 INCH INTERACTIVE KIOSK MARKET REVENUE FOR OTHERS, BY REGION, 2018-2027 ($MILLION)
TABLE 195.26 INCH TO 30 INCH INTERACTIVE KIOSK MARKET VOLUME FOR OTHERS, BY REGION, 2018-2027 (THOUSAND UNITS)
TABLE 196.31 INCH TO 34 INCH INTERACTIVE KIOSK MARKET REVENUE FOR OTHERS, BY REGION, 2018-2027 ($MILLION)
TABLE 197.31 INCH TO 34 INCH INTERACTIVE KIOSK MARKET VOLUME FOR OTHERS, BY REGION, 2018-2027 (THOUSAND UNITS)
TABLE 198.35 INCH TO 40 INCH INTERACTIVE KIOSK MARKET REVENUE FOR OTHERS, BY REGION, 2018-2027 ($MILLION)
TABLE 199.35 INCH TO 40 INCH INTERACTIVE KIOSK MARKET VOLUME FOR OTHERS, BY REGION, 2018-2027 (THOUSAND UNITS)
TABLE 200.41 INCH TO 44 INCH INTERACTIVE KIOSK MARKET REVENUE FOR OTHERS, BY REGION, 2018-2027 ($MILLION)
TABLE 201.41 INCH TO 44 INCH INTERACTIVE KIOSK MARKET VOLUME FOR OTHERS, BY REGION, 2018-2027 (THOUSAND UNITS)
TABLE 202.45 INCH TO 49 INCH INTERACTIVE KIOSK MARKET REVENUE FOR OTHERS, BY REGION, 2018-2027 ($MILLION)
TABLE 203.45 INCH TO 49 INCH INTERACTIVE KIOSK MARKET VOLUME FOR OTHERS, BY REGION, 2018-2027 (THOUSAND UNITS)
TABLE 204.50 INCH TO 55 INCH INTERACTIVE KIOSK MARKET REVENUE FOR OTHERS, BY REGION, 2018-2027 ($MILLION)
TABLE 205.50 INCH TO 55 INCH INTERACTIVE KIOSK MARKET VOLUME FOR OTHERS, BY REGION, 2018-2027 (THOUSAND UNITS)
TABLE 206.MORE THAN 55 INCH INTERACTIVE KIOSK MARKET REVENUE FOR OTHERS, BY REGION, 2018-2027 ($MILLION)
TABLE 207.MORE THAN 55 INCH INTERACTIVE KIOSK MARKET VOLUME FOR OTHERS, BY REGION, 2018-2027 (THOUSAND UNITS)
TABLE 208.INTERACTIVE KIOSK MARKET REVENUE, BY REGION, 2018-2027 ($MILLION)
TABLE 209.INTERACTIVE KIOSK MARKET VOLUME, BY REGION, 2018-2027 (THOUSAND UNITS)
TABLE 210.NORTH AMERICA INTERACTIVE KIOSK MARKET REVENUE, BY TYPE, 2018-2027 ($MILLION)
TABLE 211.NORTH AMERICA INTERACTIVE KIOSK MARKET VOLUME, BY TYPE, 2018-2027 (THOUSAND UNITS)
TABLE 212.NORTH AMERICA INTERACTIVE KIOSK MARKET REVENUE, BY DISPLAY SIZE, 2018-2027 ($MILLION)
TABLE 213.NORTH AMERICA INTERACTIVE KIOSK MARKET VOLUME, BY DISPLAY SIZE, 2018-2027 (THOUSAND UNITS)
TABLE 214.NORTH AMERICA INTERACTIVE KIOSK MARKET REVENUE, BY INDUSTRY VERTICAL, 2018-2027 ($MILLION)
TABLE 215.NORTH AMERICA INTERACTIVE KIOSK MARKET VOLUME, BY INDUSTRY VERTICAL, 2018-2027 (THOUSAND UNITS)
TABLE 216.U.S. INTERACTIVE KIOSK MARKET REVENUE, BY TYPE, 2018-2027 ($MILLION)
TABLE 217.U.S. INTERACTIVE KIOSK MARKET VALUME, BY TYPE, 2018-2027 (THOUSAND UNITS)
TABLE 218.U.S. INTERACTIVE KIOSK MARKET REVENUE, BY DISPLAY SIZE, 2018-2027 ($MILLION)
TABLE 219.U.S. INTERACTIVE KIOSK MARKET VOLUME, BY DISPLAY SIZE, 2018-2027 (THOUSAND UNITS)
TABLE 220.U.S. INTERACTIVE KIOSK MARKET REVENUE, BY INDUSTRY VERTICAL, 2018-2027 ($MILLION)
TABLE 221.U.S. INTERACTIVE KIOSK MARKET VOLUME, BY INDUSTRY VERTICAL, 2018-2027 (THOUSAND UNITS)
TABLE 222.CANADA INTERACTIVE KIOSK MARKET REVENUE, BY TYPE, 2018-2027 ($MILLION)
TABLE 223.CANADA INTERACTIVE KIOSK MARKET VOLUME, BY TYPE, 2018-2027 (THOUSAND UNITS)
TABLE 224.CANADA INTERACTIVE KIOSK MARKET REVENUE, BY DISPLAY SIZE, 2018-2027 ($MILLION)
TABLE 225.CANADA INTERACTIVE KIOSK MARKET VOLUME, BY DISPLAY SIZE, 2018-2027 (THOUSAND UNITS)
TABLE 226.CANADA INTERACTIVE KIOSK MARKET REVENUE BY INDUSTRY VERTICAL, 2018-2027 ($MILLION)
TABLE 227.CANADA INTERACTIVE KIOSK MARKET VOLUME, BY INDUSTRY VERTICAL, 2018-2027 (THOUSAND UNITS)
TABLE 228.MEXICO INTERACTIVE KIOSK MARKET REVENUE, BY TYPE, 2018-2027 ($MILLION)
TABLE 229.MEXICO INTERACTIVE KIOSK MARKET VOLUME, BY TYPE, 2018-2027 (THOUSAND UNITS)
TABLE 230.MEXICO INTERACTIVE KIOSK MARKET REVENUE, BY DISPLAY SIZE, 2018-2027 ($MILLION)
TABLE 231.MEXICO INTERACTIVE KIOSK MARKET VOLUME, BY DISPLAY SIZE, 2018-2027 (THOUSAND UNITS)
TABLE 232.MEXICO INTERACTIVE KIOSK MARKET REVENUE, BY INDUSTRY VERTICAL, 2018-2027 ($MILLION)
TABLE 233.MEXICO INTERACTIVE KIOSK MARKET VOLUME, BY INDUSTRY VERTICAL, 2018-2027 (THOUSAND UNITS)
TABLE 234.EUROPE INTERACTIVE KIOSK MARKET REVENUE, BY TYPE, 2018-2027 ($MILLION)
TABLE 235.EUROPE INTERACTIVE KIOSK MARKET VOLUME, BY TYPE, 2018-2027 (THOUSAND UNITS)
TABLE 236.EUROPE INTERACTIVE KIOSK MARKET REVENUE, BY DISPLAY SIZE, 2018-2027 ($MILLION)
TABLE 237.EUROPE INTERACTIVE KIOSK MARKET VOLUME, BY DISPLAY SIZE, 2019-2027 (THOUSAND UNITS)
TABLE 238.EUROPE INTERACTIVE KIOSK MARKET REVENUE, BY INDUSTRY VERTICAL, 2018-2027 ($MILLION)
TABLE 239.EUROPE INTERACTIVE KIOSK MARKET VOLUME, BY INDUSTRY VERTICAL, 2018-2027 (THOUSAND UNITS)
TABLE 240.GERMANY INTERACTIVE KIOSK MARKET REVENUE, BY TYPE, 2018-2027 ($MILLION)
TABLE 241.GERMANY INTERACTIVE KIOSK MARKET VOLUME, BY TYPE, 2018-2027 (THOUSAND UNITS)
TABLE 242.GERMANY INTERACTIVE KIOSK MARKET REVENUE, BY DISPLAY SIZE, 2018-2027 ($MILLION)
TABLE 243.GERMANY INTERACTIVE KIOSK MARKET VOLUME, BY DISPLAY SIZE, 2018-2027 (THOUSAND UNITS)
TABLE 244.GERMANY INTERACTIVE KIOSK MARKET REVENUE, BY INDUSTRY VERTICAL, 2018-2027 ($MILLION)
TABLE 245.GERMANY INTERACTIVE KIOSK MARKET VOLUME, BY INDUSTRY VERTICAL, 2018-2027 (THOUSAND UNITS)
TABLE 246.FRANCE INTERACTIVE KIOSK MARKET REVENUE, BY TYPE, 2018-2027 ($MILLION)
TABLE 247.FRANCE INTERACTIVE KIOSK MARKET VOLUME, BY TYPE, 2018-2027 (THOUSAND UNITS)
TABLE 248.FRANCE INTERACTIVE KIOSK MARKET REVENUE, BY DISPLAY SIZE, 2018-2027 ($MILLION)
TABLE 249.FRANCE INTERACTIVE KIOSK MARKET VOLUME, BY DISPLAY SIZE, 2018-2027 (THOUSAND UNITS)
TABLE 250.FRANCE INTERACTIVE KIOSK MARKET REVENUE, BY INDUSTRY VERTICAL, 2018-2027 ($MILLION)
TABLE 251.FRANCE INTERACTIVE KIOSK MARKET VOLUME, BY INDUSTRY VERTICAL, 2018-2027 (THOUSAND UNITS)
TABLE 252.UK INTERACTIVE KIOSK MARKET REVENUE, BY TYPE, 2018-2027 ($MILLION)
TABLE 253.UK INTERACTIVE KIOSK MARKET VOLUME, BY TYPE, 2018-2027 (THOUSAND UNITS)
TABLE 254.UK INTERACTIVE KIOSK MARKET REVENUE, BY DISPLAY SIZE, 2018-2027 ($MILLION)
TABLE 255.UK INTERACTIVE KIOSK MARKET VOLUME, BY DISPLAY SIZE, 2018-2027 (THOUSAND UNITS)
TABLE 256.UK INTERACTIVE KIOSK MARKET REVENUE, BY INDUSTRY VERTICAL, 2018-2027 ($MILLION)
TABLE 257.UK INTERACTIVE KIOSK MARKET VOLUME, BY INDUSTRY VERTICAL, 2018-2027 (THOUSAND UNITS)
TABLE 258.REST OF EUROPE INTERACTIVE KIOSK MARKET REVENUE, BY TYPE, 2018-2027 ($MILLION)
TABLE 259.REST OF EUROPE INTERACTIVE KIOSK MARKET VOLUME, BY TYPE, 2018-2027 (THOUSAND UNITS)
TABLE 260.REST OF EUROPE INTERACTIVE KIOSK MARKET REVENUE, BY DISPLAY SIZE, 2018-2027 ($MILLION)
TABLE 261.REST OF EUROPE INTERACTIVE KIOSK MARKET VOLUME, BY DISPLAY SIZE, 2018-2027 (THOUSAND UNITS)
TABLE 262.REST OF EUROPE INTERACTIVE KIOSK MARKET REVENUE, BY INDUSTRY VERTICAL, 2018-2027 ($MILLION)
TABLE 263.REST OF EUROPE INTERACTIVE KIOSK MARKET VOLUME, BY INDUSTRY VERTICAL, 2018-2027 (THOUSAND UNITS)
TABLE 264.ASIA-PACIFIC INTERACTIVE KIOSK MARKET REVENUE, BY TYPE, 2018-2027 ($MILLION)
TABLE 265.ASIA-PACIFIC INTERACTIVE KIOSK MARKET VOLUME, BY TYPE, 2018-2027 (THOUSAND UNITS)
TABLE 266.ASIA-PACIFIC INTERACTIVE KIOSK MARKET REVENUE, BY DISPLAY SIZE, 2018-2027 ($MILLION)
TABLE 267.ASIA-PACIFIC INTERACTIVE KIOSK MARKET VOLUME, BY DISPLAY SIZE, 2018-2027 (THOUSAND UNITS)
TABLE 268.ASIA-PACIFIC INTERACTIVE KIOSK MARKET REVENUE, BY INDUSTRY VERTICAL, 2018-2027 ($MILLION)
TABLE 269.ASIA-PACIFIC INTERACTIVE KIOSK MARKET VOLUME, BY INDUSTRY VERTICAL, 2018-2027 (THOUSAND UNITS)
TABLE 270.JAPAN INTERACTIVE KIOSK MARKET REVENUE, BY TYPE, 2018-2027 ($MILLION)
TABLE 271.JAPAN INTERACTIVE KIOSK MARKET VOLUME, BY TYPE, 2018-2027 (THOUSAND UNITS)
TABLE 272.JAPAN INTERACTIVE KIOSK MARKET REVENUE, BY DISPLAY SIZE, 2018-2027 ($MILLION)
TABLE 273.JAPAN INTERACTIVE KIOSK MARKET VOLUME, BY DISPLAY SIZE, 2018-2027 (THOUSAND UNITS)
TABLE 274.JAPAN INTERACTIVE KIOSK MARKET REVENUE, BY INDUSTRY VERTICAL, 2018-2027 ($MILLION)
TABLE 275.JAPAN INTERACTIVE KIOSK MARKET VOLUME, BY INDUSTRY VERTICAL, 2018-2027 (THOUSAND UNITS)
TABLE 276.CHINA INTERACTIVE KIOSK MARKET REVENUE, BY TYPE, 2018-2027 ($MILLION)
TABLE 277.CHINA INTERACTIVE KIOSK MARKET VOLUME, BY TYPE, 2018-2027 (THOUSAND UNITS)
TABLE 278.CHINA INTERACTIVE KIOSK MARKET REVENUE, BY DISPLAY SIZE, 2018-2027 ($MILLION)
TABLE 279.CHINA INTERACTIVE KIOSK MARKET VOLUME, BY DISPLAY SIZE, 2018-2027 (THOUSAND UNITS)
TABLE 280.CHINA INTERACTIVE KIOSK MARKET REVENUE, BY INDUSTRY VERTICAL, 2018-2027 ($MILLION)
TABLE 281.CHINA INTERACTIVE KIOSK MARKET VOLUME, BY INDUSTRY VERTICAL, 2018-2027 (THOUSAND UNITS)
TABLE 282.INDIA INTERACTIVE KIOSK MARKET REVENUE, BY TYPE, 2018-2027 ($MILLION)
TABLE 283.INDIA INTERACTIVE KIOSK MARKET VOLUME, BY TYPE, 2018-2027 (THOUSAND UNITS)
TABLE 284.INDIA INTERACTIVE KIOSK MARKET REVENUE, BY DISPLAY SIZE, 2018-2027 ($MILLION)
TABLE 285.INDIA INTERACTIVE KIOSK MARKET VOLUME, BY DISPLAY SIZE, 2018-2027 (THOUSAND UNITS)
TABLE 286.INDIA INTERACTIVE KIOSK MARKET REVENUE, BY INDUSTRY VERTICAL, 2018-2027 ($MILLION)
TABLE 287.INDIA INTERACTIVE KIOSK MARKET VOLUME, BY INDUSTRY VERTICAL, 2018-2027 (THOUSAND UNITS)
TABLE 288.SOUTH KOREA INTERACTIVE KIOSK MARKET REVENUE, BY TYPE, 2018-2027 ($MILLION)
TABLE 289.SOUTH KOREA INTERACTIVE KIOSK MARKET VOLUME, BY TYPE, 2018-2027 (THOUSAND UNITS)
TABLE 290.SOUTH KOREA INTERACTIVE KIOSK MARKET REVENUE, BY DISPLAY SIZE, 2018-2027 ($MILLION)
TABLE 291.SOUTH KOREA INTERACTIVE KIOSK MARKET VOLUME, BY DISPLAY SIZE, 2018-2027 (THOUSAND UNITS)
TABLE 292.SOUTH KOREA INTERACTIVE KIOSK MARKET REVENUE, BY INDUSTRY VERTICAL, 2018-2027 ($MILLION)
TABLE 293.SOUTH KOREA INTERACTIVE KIOSK MARKET VOLUME, BY INDUSTRY VERTICAL, 2018-2027 (THOUSAND UNITS)
TABLE 294.REST OF ASIA-PACIFIC INTERACTIVE KIOSK MARKET REVENUE, BY TYPE, 2018-2027 ($MILLION)
TABLE 295.REST OF ASIA-PACIFIC INTERACTIVE KIOSK MARKET VOLUME, BY TYPE, 2018-2027 (THOUSAND UNITS)
TABLE 296.REST OF ASIA-PACIFIC INTERACTIVE KIOSK MARKET REVENUE, BY DISPLAY SIZE, 2018-2027 ($MILLION)
TABLE 297.REST OF ASIA-PACIFIC INTERACTIVE KIOSK MARKET VOLUME, BY DISPLAY SIZE, 2018-2027 (THOUSAND UNITS)
TABLE 298.REST OF ASIA-PACIFIC INTERACTIVE KIOSK MARKET REVENUE, BY INDUSTRY VERTICAL, 2018-2027 ($MILLION)
TABLE 299.REST OF ASIA-PACIFIC INTERACTIVE KIOSK MARKET VOLUME, BY INDUSTRY VERTICAL, 2018-2027 (THOUSAND UNITS)
TABLE 300.LAMEA INTERACTIVE KIOSK MARKET REVENUE, BY TYPE, 2018-2027 ($MILLION)
TABLE 301.LAMEA INTERACTIVE KIOSK MARKET VOLUME, BY TYPE, 2018-2027 (THOUSAND UNITS)
TABLE 302.LAMEA INTERACTIVE KIOSK MARKET REVENUE, BY DISPLAY SIZE, 2018-2027 ($MILLION)
TABLE 303.LAMEA INTERACTIVE KIOSK MARKET VOLUME, BY DISPLAY SIZE, 2018-2027 (THOUSAND UNITS)
TABLE 304.LAMEA INTERACTIVE KIOSK MARKET REVENUE, BY INDUSTRY VERTICAL, 2018-2027 ($MILLION)
TABLE 305.LAMEA INTERACTIVE KIOSK MARKET VOLUME, BY INDUSTRY VERTICAL, 2018-2027 (THOUSAND UNITS)
TABLE 306.LATIN AMERICA INTERACTIVE KIOSK MARKET REVENUE, BY TYPE, 2018-2027 ($MILLION)
TABLE 307.LATIN AMERICA INTERACTIVE KIOSK MARKET VOLUME, BY TYPE, 2018-2027 (THOUSAND UNITS)
TABLE 308.LATIN AMERICA INTERACTIVE KIOSK MARKET REVENUE, BY DISPLAY SIZE, 2018-2027 ($MILLION)
TABLE 309.LATIN AMERICA INTERACTIVE KIOSK MARKET VOLUME, BY DISPLAY SIZE, 2018-2027 (THOUSAND UNITS)
TABLE 310.LATIN AMERICA INTERACTIVE KIOSK MARKET REVENUE, BY INDUSTRY VERTICAL, 2018-2027 ($MILLION)
TABLE 311.LATIN AMERICA INTERACTIVE KIOSK MARKET VOLUME, BY INDUSTRY VERTICAL, 2018-2027 (THOUSAND UNITS)
TABLE 312.MIDDLE EAST INTERACTIVE KIOSK MARKET REVENUE, BY TYPE, 2018-2027 ($MILLION)
TABLE 313.MIDDLE EAST INTERACTIVE KIOSK MARKET VOLUME, BY TYPE, 2018-2027 (THOUSAND UNITS)
TABLE 314.MIDDLE EAST INTERACTIVE KIOSK MARKET REVENUE, BY DISPLAY SIZE, 2018-2027 ($MILLION)
TABLE 315.MIDDLE EAST INTERACTIVE KIOSK MARKET VOLUME, BY DISPLAY SIZE, 2018-2027 (THOUSAND UNITS)
TABLE 316.MIDDLE EAST INTERACTIVE KIOSK MARKET REVENUE, BY INDUSTRY VERTICAL, 2018-2027 ($MILLION)
TABLE 317.MIDDLE EAST INTERACTIVE KIOSK MARKET VOLUME, BY INDUSTRY VERTICAL, 2018-2027 (THOUSAND UNITS)
TABLE 318.AFRICA INTERACTIVE KIOSK MARKET REVENUE, BY TYPE, 2018-2027 ($MILLION)
TABLE 319.AFRICA INTERACTIVE KIOSK MARKET VOLUME, BY TYPE, 2018-2027 (THOUSAND UNITS)
TABLE 320.AFRICA INTERACTIVE KIOSK MARKET REVENUE, BY DISPLAY SIZE, 2018-2027 ($MILLION)
TABLE 321.AFRICA INTERACTIVE KIOSK MARKET VOLUME, BY DISPLAY SIZE, 2018-2027 (THOUSAND UNITS)
TABLE 322.AFRICA INTERACTIVE KIOSK MARKET REVENUE, BY INDUSTRY VERTICAL, 2018-2027 ($MILLION)
TABLE 323.AFRICA INTERACTIVE KIOSK MARKET VOLUME, BY INDUSTRY VERTICAL, 2018-2027 (THOUSAND UNITS)
TABLE 324.KEY NEW PRODUCT LAUNCHES (2016-2020)
TABLE 325.OTHER KEY DEVELOPMENTS (2016-2019)
TABLE 326.ADVANCED KIOSKS: KEY EXECUTIVES
TABLE 327.ADVANCED KIOSKS: COMPANY SNAPSHOT
TABLE 328.ADVANCED KIOSKS: PRODUCT PORTFOLIO
TABLE 329.ADVANTECH CO., LTD: KEY EXECUTIVES
TABLE 330.ADVANTECH CO., LTD: COMPANY SNAPSHOT
TABLE 331.ADVANTECH CO., LTD: PRODUCT PORTFOLIO
TABLE 332.NCR CORPORATION: R&D EXPENDITURE, 2017–2019 ($MILLION)
TABLE 333.ADVANTECH CO., LTD: NET SALES, 2017–2019 ($MILLION)
TABLE 334.DIEBOLD NIXDORF, INCORPORATED: KEY EXECUTIVES
TABLE 335.DIEBOLD NIXDORF, INCORPORATED: COMPANY SNAPSHOT
TABLE 336.DIEBOLD NIXDORF, INCORPORATED: PRODUCT PORTFOLIO
TABLE 337.DIEBOLD NIXDORF, INCORPORATED: R&D EXPENDITURE, 2017–2019 ($MILLION)
TABLE 338.DIEBOLD NIXDORF, INCORPORATED: NET SALES, 2017–2019 ($MILLION)
TABLE 339.DIEBOLD NIXDORF, INCORPORATED: KEY STRATEGIC MOVES AND DEVELOPMENTS
TABLE 340.EMBROSS: KEY EXECUTIVES
TABLE 341.EMBROSS: COMPANY SNAPSHOT
TABLE 342.EMBROSS: PRODUCT PORTFOLIO
TABLE 343.EMBROSS: KEY STRATEGIC MOVES AND DEVELOPMENTS
TABLE 344.KIOSK INFORMATION SYSTEMS: KEY EXECUTIVES
TABLE 345.KIOSK INFORMATION SYSTEMS: COMPANY SNAPSHOT
TABLE 346.KIOSK INFORMATION SYSTEMS: PRODUCT PORTFOLIO
TABLE 347.MERIDIAN KIOSKS: KEY EXECUTIVES
TABLE 348.MERIDIAN KIOSKS: COMPANY SNAPSHOT
TABLE 349.MERIDIAN KIOSKS: PRODUCT PORTFOLIO
TABLE 350.NCR CORPORATION: KEY EXECUTIVES
TABLE 351.NCR CORPORATION.: COMPANY SNAPSHOT
TABLE 352.LG ELECTRONICS.: OPERATING SEGMENTS
TABLE 353.NCR CORPORATION: PRODUCT PORTFOLIO
TABLE 354.NCR CORPORATION: R&D EXPENDITURE, 2017–2019 ($MILLION)
TABLE 355.NCR CORPORATION: NET SALES, 2016–2018 ($MILLION)
TABLE 356.REDYREF: KEY EXECUTIVES
TABLE 357.REDYREF: COMPANY SNAPSHOT
TABLE 358.REDYREF: PRODUCT PORTFOLIO
TABLE 359.REDYREF: KEY STRATEGIC MOVES AND DEVELOPMENTS
TABLE 360.SOURCE TECHNOLOGIES: KEY EXECUTIVES
TABLE 361.SOURCE TECHNOLOGIES: COMPANY SNAPSHOT
TABLE 362.SOURCE TECHNOLOGIES: PRODUCT PORTFOLIO
TABLE 363.SOURCE TECHNOLOGIES: KEY STRATEGIC MOVES AND DEVELOPMENTS
TABLE 364.TOUCHSCREEN SOLUTIONS: KEY EXECUTIVES
TABLE 365.TOUCHSCREEN SOLUTIONS: COMPANY SNAPSHOT
TABLE 366.TOUCHSCREEN SOLUTIONS: PRODUCT PORTFOLIO
LIST OF FIGURES
FIGURE 01.KEY MARKET SEGMENTS
FIGURE 02.GLOBAL INTERACTIVE KIOSK MARKET: EXECUTIVE SUMMARY
FIGURE 03.TOP IMPACTING FACTORS
FIGURE 04.TOP INVESTMENT POCKETS
FIGURE 05.HIGH BARGAINING POWER OF SUPPLIERS
FIGURE 07.MODERATE-TO-HIGH THREAT OF NEW ENTRANTS
FIGURE 09.MODERATE THREAT OF SUBSTITUTES
FIGURE 11.HIGH INTENSITY OF RIVALRY
FIGURE 13.HIGH BARGAINING POWER OF BUYERS
FIGURE 14.MARKET PLAYER POSITIONING, 2019
FIGURE 15.PRICING ANALYSIS
FIGURE 16.PATENT ANALYSIS, BY COUNTRY
FIGURE 17.PATENT ANALYSIS, BY APPLICANT
FIGURE 18.GLOBAL INTERACTIVE KIOSK MARKET, BY TYPE, 2019-2027
FIGURE 19.VALUE CHAIN ANALYSIS FOR BANK KIOSKS
FIGURE 20.COMPARATIVE SHARE ANALYSIS OF INTERACTIVE KIOSKS MARKET FOR BANK, BY COUNTRY, 2019 & 2027(%)
FIGURE 21.VALUE CHAIN ANALYSIS FOR SELF-SERVICE KIOSKS
FIGURE 22.COMPARATIVE SHARE ANALYSIS OF SELF-SERVICE INTERACTIVE KIOSK MARKET, BY COUNTRY, 2019 & 2027(%)
FIGURE 23.VALUE CHAIN ANALYSIS FOR VENDING KIOSKS
FIGURE 24.COMPARATIVE SHARE ANALYSIS OF VENDING INTERACTIVE KIOSK MARKET, BY COUNTRY, 2018 - 2026 (%)
FIGURE 25.GLOBAL INTERACTIVE KIOSK MARKET, BY DISPLAY SIZE, 2019-2027
FIGURE 26.LESS THAN 17 INCH COMPARATIVE SHARE ANALYSIS OF GLOBAL INTERACTIVE KIOSK MARKET, BY COUNTRY, 2019 & 2027(%)
FIGURE 27.COMPARATIVE SHARE ANALYSIS OF 17 INCH TO 19 INCH INTERACTIVE KIOSK MARKET FOR, BY COUNTRY, 2019 & 2027(%)
FIGURE 28.COMPARATIVE SHARE ANALYSIS OF 20 INCH TO 22 INCH INTERACTIVE KIOSK MARKET FOR, BY COUNTRY, 2019 & 2027(%)
FIGURE 29.COMPARATIVE SHARE ANALYSIS OF 23 INCH TO 25 INCH INTERACTIVE KIOSK MARKET FOR, BY COUNTRY, 2019 & 2027(%)
FIGURE 30.COMPARATIVE SHARE ANALYSIS OF 26 INCH TO 30 INCH INTERACTIVE KIOSK MARKET FOR, BY COUNTRY, 2019 & 2027(%)
FIGURE 31.COMPARATIVE SHARE ANALYSIS OF 31 INCH TO 34 INCH INTERACTIVE KIOSK MARKET FOR, BY COUNTRY, 2019 & 2027(%)
FIGURE 32.COMPARATIVE SHARE ANALYSIS OF 35 INCH TO 40 INCH INTERACTIVE KIOSK MARKET FOR, BY COUNTRY, 2019 & 2027(%)
FIGURE 33.COMPARATIVE SHARE ANALYSIS OF 41 INCH TO 44 INCH INTERACTIVE KIOSK MARKET FOR, BY COUNTRY, 2019 & 2027(%)
FIGURE 34.COMPARATIVE SHARE ANALYSIS OF 45 INCH TO 49 INCH INTERACTIVE KIOSK MARKET, BY COUNTRY, 2019 & 2027(%)
FIGURE 35.COMPARATIVE SHARE ANALYSIS OF 50 INCH TO 55 INCH INTERACTIVE KIOSK MARKET, BY COUNTRY, 2019 & 2027(%)
FIGURE 36.COMPARATIVE SHARE ANALYSIS OF MORE THAN 55 INCH INTERACTIVE KIOSK MARKET, BY COUNTRY, 2019 & 2027(%)
FIGURE 37.GLOBAL INTERACTIVE KIOSK MARKET, BY INDUSTRY VERTICAL, 2019-2027
FIGURE 38.COMPARATIVE SHARE ANALYSIS OF RETAIL INTERACTIVE KIOSK MARKET, BY COUNTRY, 2019 & 2027(%)
FIGURE 39.COMPARATIVE SHARE ANALYSIS OF ENTERTAINMENT INTERACTIVE KIOSK MARKET, BY COUNTRY, 2019 & 2027(%)
FIGURE 40.COMPARATIVE SHARE ANALYSIS OF HEALTHCARE INTERACTIVE KIOSK MARKET, BY COUNTRY, 2019 & 2027
FIGURE 41.COMPARATIVE SHARE ANALYSIS OF BFSI INTERACTIVE KIOSK MARKET, BY COUNTRY, 2019 & 2027(%)
FIGURE 42.COMPARATIVE SHARE ANALYSIS OF INTERACTIVE KIOSK MARKET FOR GOVERNMENT, BY COUNTRY, 2019 & 2027 (%)
FIGURE 43.COMPARATIVE SHARE ANALYSIS OF INTERACTIVE KIOSK MARKET FOR TRANSPORTATION, BY COUNTRY, 2019 & 2027(%)
FIGURE 44.COMPARATIVE SHARE ANALYSIS OF INTERACTIVE KIOSK MARKET FOR OTHERS, BY COUNTRY, 2019 & 2027 (%)
FIGURE 45.INTERACTIVE KIOSK MARKET, BY REGION, 2019-2027
FIGURE 46.COMPARATIVE SHARE ANALYSIS OF NORTH AMERICA INTERACTIVE KIOSK MARKET, BY COUNTRY, 2019-2027 (%)
FIGURE 47.U. S. INTERACTIVE KIOSK MARKET, 2019-2027 ($MILLION)
FIGURE 48.CANADA INTERACTIVE KIOSK MARKET, 2019-2027 ($MILLION)
FIGURE 49.MEXICO INTERACTIVE KIOSK MARKET, 2019-2027 ($MILLION)
FIGURE 50.COMPARATIVE SHARE ANALYSIS OF EUROPE INTERACTIVE KIOSK MARKET, BY COUNTRY, 2019-2027 (%)
FIGURE 51.GERMANY INTERACTIVE KIOSK MARKET, 2019-2027 ($MILLION)
FIGURE 52.FRANCE INTERACTIVE KIOSK MARKET, 2019-2027 ($MILLION)
FIGURE 53.UK INTERACTIVE KIOSK MARKET, 2019-2027 ($MILLION)
FIGURE 54.REST OF EUROPE INTERACTIVE KIOSK MARKET, 2019-2027 ($MILLION)
FIGURE 55.COMPARATIVE SHARE ANALYSIS OF ASIA-PACIFIC INTERACTIVE KIOSK MARKET, BY COUNTRY, 2019-2027 (%)
FIGURE 56.JAPAN INTERACTIVE KIOSK MARKET, 2019-2027 ($MILLION)
FIGURE 57.CHINA INTERACTIVE KIOSK MARKET, 2019-2027 ($MILLION)
FIGURE 58.INDIA INTERACTIVE KIOSK MARKET, 2019-2027 ($MILLION)
FIGURE 59.SOUTH KOREA INTERACTIVE KIOSK MARKET, 2019-2027 ($MILLION)
FIGURE 60.REST OF ASIA-PACIFIC INTERACTIVE KIOSK MARKET, 2019-2027 ($MILLION)
FIGURE 61.COMPARATIVE SHARE ANALYSIS OF LAMEA INTERACTIVE KIOSK MARKET, BY COUNTRY, 2019-2027 (%)
FIGURE 62.LATIN AMERICA INTERACTIVE KIOSK MARKET, 2019-2027 ($MILLION)
FIGURE 63.MIDDLE EAST INTERACTIVE KIOSK MARKET, 2019-2027 ($MILLION)
FIGURE 64.AFRICA INTERACTIVE KIOSK MARKET, 2019-2027 ($MILLION)
FIGURE 65.MARKET PLAYER POSITIONING, 2019
FIGURE 66.MARKET SHARE ANALYSIS, 2019
FIGURE 67.TOP WINNING STRATEGIES, BY YEAR, 2016-2020*
FIGURE 68.TOP WINNING STRATEGIES, BY DEVELOPMENT, 2016-2020*
FIGURE 69.TOP WINNING STRATEGIES, BY COMPANY, 2016-2020*
FIGURE 70.PRODUCT MAPPING OF TOP 10 PLAYERS
FIGURE 71.COMPETITIVE DASHBOARD OF KEY PLAYER
FIGURE 72.COMPETITIVE HEATMAP OF KEY PLAYERS
FIGURE 73.ADVANTECH CO., LTD: R&D EXPENDITURE, 2017–2019 ($MILLION)
FIGURE 74.ADVANTECH CO., LTD: NET SALES, 2017–2019 ($MILLION)
FIGURE 75.ADVANTECH CO., LTD: REVENUE SHARE BY SEGMENT, 2019 (%)
FIGURE 76.ADVANTECH CO., LTD: REVENUE SHARE BY REGION, 2019 (%)
FIGURE 77.DIEBOLD NIXDORF, INCORPORATED: R&D EXPENDITURE, 2017–2019 ($MILLION)
FIGURE 78.DIEBOLD NIXDORF, INCORPORATED: NET SALES, 2017–2019 ($MILLION)
FIGURE 79.DIEBOLD NIXDORF, INCORPORATED: REVENUE SHARE BY SEGMENT, FY2019 (%)
FIGURE 80.DIEBOLD NIXDORF, INCORPORATED: REVENUE SHARE BY REGION, FY2019 (%)
FIGURE 81.NCR CORPORATION: R&D EXPENDITURE, 2017–2019 ($MILLION)
FIGURE 82.NCR CORPORATION: NET SALES, 2017–2019 ($MILLION)
FIGURE 83.NCR CORPORATION: REVENUE SHARE BY SEGMENT, 2019 (%)
FIGURE 84.NCR CORPORATION: REVENUE SHARE BY REGION, 2019 (%)
$6069
$10500
HAVE A QUERY?
OUR CUSTOMER
