
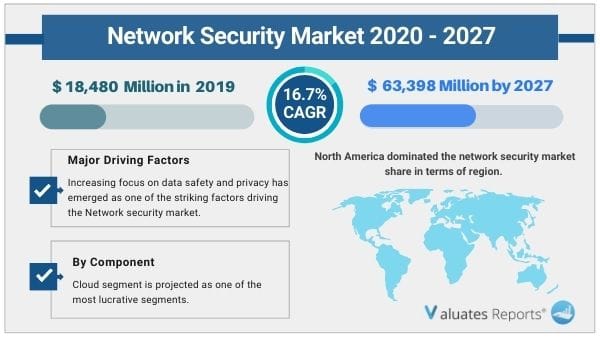
The global network security market size was valued at USD 18,480 million in 2019, and is projected to reach USD 63,398 million by 2027, registering a CAGR of 16.7% from 2020 to 2027. Network security is a broad term that covers a multitude of technologies, devices and processes. In the simplest term, it is a set of rules and configurations designed to protect the integrity, confidentiality and accessibility of computer networks and data using both software and hardware technologies. Every organization, regardless of size, industry or infrastructure, requires a degree of network security solutions in place to protect it from the ever-growing landscape of cyber threats in the wild today. Cybercriminals are seeing the pandemic as an excuse to increase their immoral behavior by leveraging the weakness of remote workers and trying to capitalize on public interest in coronavirus. These factors are encouraging organizations to further increase their security spending and improve their network security infrastructure to adapt to remote working environments. This promises a stable growth opportunity for the global network security market.
In 2019, the global network security market share was dominated by the solution segment, and is expected to maintain its dominance in the upcoming years as solutions all solution types primarily focus on various system parts right from network security, device management, network packet analysis, and on embedded security, thereby creating a highly profitable scenario for the market growth. Increase in the number of cyber-attacks on enterprises has resulted in huge loss, in terms of both social and economic scenarios. This has mandated organizations to increase their spending in security conditions, which has created a lucrative growth foundation for the overall market. Furthermore, there has been a heavy reliance on cloud and online systems, owing to work from home policy, which has increased the risk of cyber threats. However, the services segment is expected to witness the highest growth, as these services reduce time and costs associated with optimization of systems in the initial phase of deployment. As services help to deploy and integrate distinct IT solutions in an enterprise ecosystem, they work as an important part of an organization. There has been an increase in adoption of services among end users over time, as it ensures effective functioning of software and platforms throughout the process. Increase in adoption of these software and platforms is expected to boost demand for these services.
By solution type, the IDS/IPS segment achieved the fastest growth within the market in 2019, and is expected to maintain a similar trend in the upcoming years. Malware and web application-based attacks have become extremely prone in the past decade within the digital world. With the rise in threat of these attacks, demand for intrusion detection systems has increased colossally. Intrusion detection system (IDS) is a software application that scans a network or a system for harmful activities or policy breaching. There is a growing demand for IDS solutions, owing to a colossal increase in the number of malicious attacks such as malware, web-based attacks, and phishing. Various advancements in the solution has increased demand for IDS solution, which is expected to create a strong foundation for the market growth during the forecast period.
North America dominates the network security market, owing to various factors such as rapid adoption of favorable government initiatives in the technology domain by the government of Canada is estimated to create a wide range of opportunities for the network security market. For instance, Venture Capital Catalyst Initiative, unveiled in December 2017, allocated $400 million within technology domain to achieve high growth business scenario. The funds allocated are adopted for research in the field of advanced artificial intelligence and quantum computing. Thus, with such a heavy reliance on digital technology, the demand for effective security measures is expected to rise, which would create ample opportunities for the market growth. User/data interaction software technologies include natural language processing, question and answer (Q&A) processing, facial recognition, natural language generation, video and image analytics, and speech recognition.
The report focuses on the growth prospects, restraints, and network security market analysis. The study provides Porter’s five forces analysis of the network security industry to understand impact of various factors such as bargaining power of suppliers, competitive intensity of competitors, threat of new entrants, threat of substitutes, and bargaining power of buyers on the network security market trends.
The network security market is mainly segmented on the basis of component, solution, services, deployment, and organization size and industry verticals. Based on component, the market is segmented into solution and services. Based on solution the market is segmented into firewall, antivirus/antimalware, network access control (NAC), data loss prevention, IDS/IPS, secure web gateways, DDoS Mitigation, unified threat management and others, while on the basis of services the market is segmented into professional and managed services. Based on deployment, the market is bifurcated into on-premise and cloud, while on the basis of organization size the market is classified into small and medium enterprise and large enterprise. Based on industry vertical, the market is segmented into aerospace and defense, government, banking, financial services, and insurance (BFSI), information technology (IT) and telecommunication, healthcare, retail, manufacturing, energy and utilities and others.
Post COVID-19, size of the network security market is estimated to grow from $21,530 million in 2020 and is projected to reach $63,398 million by 2027, at a CAGR of 16.7%. The current estimation of 2027 is projected to be higher than pre-COVID-19 estimates. COVID-19 pandemic has bought a moderate impact on the Network Security market, achieving a growth rate of 3-5% in the year 2020. However, with this colossal growth, the risk of cyber threats also increases, thereby venture capitalists are investing more in cybersecurity and more specifically, into network security. More than 70% security executives also believe that their budgets for fiscal year 2021 will shrink. As a result, supporting new Overall, the pandemic has massively affected how cybersecurity protection is delivered to organizations and users, fast-tracking remote workforce support and accelerating cloud adoption. With most of the companies adopting work from home policy, there has been a colossal demand for cloud-based systems, creating a strong foundation for network security market .Tactics to safeguard organizations is expected to limit outlays for such things as compliance, governance, and risk tools, which in turn is set to open wider opportunities for network security solutions.
Factors such as immense focus on data safety and privacy, have emerged as one of the striking factor that is driving the market growth. Furthermore, growing incidences of cybercrimes coupled with huge loss also has mandated the need for effective network security solutions. However, the huge setup cost and high level of expertise required within the operations is mainly creating a staggering effect on the market. Growth of digitalization in a global manner and rapid increase in the number of cyber-attacks within the pandemic period has boosted the market growth.
Ongoing technological advancement across the transportation and logistics sector
Over the past few decades, the need for security solutions has grown exponentially around the world. Security equipment started becoming mainstream for commercial and government since the past few decades, around these times enterprise level firewalls, intruder detection systems, identity management systems, and event management solutions and others started to surface. Cyber and network security has gained a colossal traction and has gained significant demand owing to the factors such as increased governmental policies for safety and privacy of user data, an increasing number of cyber and network attacks, crucial corporate data, and others, have made security solutions an absolute necessity in today’s world.
By Component - Cloud segment is projected as one of the most lucrative segments.
Increasing level of cybercrimes coupled with its higher economic losses
Digital technologies has gained a colossal space within every aspect of day to day routine starting from simple mobile devices used for communication to complex software and electronics adopted in high security based applications. For instance, one of the recent technologies termed as “Edge computing” is gaining a huge traction within the commercial sectors as it reduces the overall latency in acquiring data from a respective server. Furthermore, edge computing is also estimated to increase the demand for various parallel technologies such as Internet of Things (IoT) and cloud computing. By 2022, the global edge computing market is expected to reach USD 16.5 billion.
According to a 2018 survey published by Cisco systems, the Chief Information Security Officer (CISO) in many organizations has pushed for strong network monitoring and security solutions. 93% of the organizations that participated in the survey, expressed that they are planning to further increase their network monitoring infrastructure. CISOs do have a number of network security and monitoring plans in place, including incorporating new and improved network security monitoring with existing networking and security technologies, increasing cybersecurity training, and investing in new network security monitoring tools. This ongoing scenario has raised the demand for network monitoring and security tools, thereby elevating the market growth during the forecast period.
By Region - Asia-Pacific is projected as one of the most significant regions.
|
Report Metric |
Details |
|
Report Name |
Network Security Market |
|
The market size in 2019 |
USD 18,480 Million |
|
The revenue forecast in 2027 |
USD 63,398 Million |
|
Growth Rate |
Compound Annual Growth Rate (CAGR) of 16.7% from 2020 to 2027 |
|
Market size available for years |
2020 - 2027 |
|
Forecast units |
Value (USD) |
|
Segments covered |
By Component, By Solution, Application, Region & others. |
|
Report coverage |
Revenue & volume forecast, company share, competitive landscape, growth factors, and trends |
|
Geographic regions covered |
North America, Europe, Asia Pacific, Latin America, Middle East & Africa |
Ans. The global network security market size was valued at USD 18,480 million in 2019, and is projected to reach USD 63,398 million by 2027.
Ans. The global network security market is expected to grow at a compound annual growth rate of 16.7% from 2020 to 2027.
Ans. Some of the major companies are Cisco Systems, Solarwinds, IBM, Trend Micro, FireMon, Symantec, FireEye, GFI Software, Avast Software, Juniper Networks.
CHAPTER 1:INTRODUCTION
1.1.Report description
1.2.Key benefits for stakeholders
1.3.Key market segments
1.3.1.Key market players
1.4.Research methodology
1.4.1.Secondary research
1.4.2.Primary research
1.4.3.Analyst tools & models
CHAPTER 2:EXECUTIVE SUMMARY
2.1.Key findings
2.1.1.Top impacting factors
2.1.2.Top investment pockets
2.2.CXO perspective
CHAPTER 3:MARKET OVERVIEW
3.1.Market definition and scope
3.2.Key forces shaping the Network Security market
3.3.Market dynamics
3.3.1.Drivers
3.3.1.1.Growing data safety and privacy concerns
3.3.1.2.Increasing level of cybercrimes coupled with its higher economic losses
3.3.2.Restraints
3.3.2.1.High setup costs
3.3.3.Opportunities
3.3.3.1.Growth in digitalization trends globally
3.3.3.2. Increased cyber-attacks during the COVID-19 pandemic
3.6.COVID-19 impact analysis on the Network Security market
3.6.1.Impact on market size
3.6.2.Consumer trends, preferences, and budget impact
3.6.3.Economic impact
3.6.4.Key player strategies to tackle negative impact
3.6.5.Opportunity window
CHAPTER 4:NETWORK SECURITY MARKET, BY COMPONENT
4.1.Overview
4.2.Solution
4.2.1.Key market trends, growth factors, and opportunities
4.2.2.Market size and forecast, by region
4.2.3.Market analysis, by country
4.3.Services
4.3.1.Key market trends, growth factors, and opportunities
4.3.2.Market size and forecast, by region
4.3.3.Market analysis, by country
CHAPTER 5:NETWORK SECURITY MARKET, BY SOLUTION
5.1.Overview
5.2.Firewall
5.2.1.Key market trends, growth factors, and opportunities
5.2.2.Market size and forecast, by region
5.2.3.Market analysis, by country
5.3.Antivirus/Antimalware
5.3.1.Key market trends, growth factors, and opportunities
5.3.2.Market size and forecast, by region
5.3.3.Market analysis, by country
5.4.Network Access Control
5.4.1.Key market trends, growth factors, and opportunities
5.4.2.Market size and forecast, by region
5.4.3.Market analysis, by country
5.5. Data Loss Prevention
5.5.1.Key market trends, growth factors, and opportunities
5.5.2.Market size and forecast, by region
5.5.3.Market analysis, by country
5.6. IDS/IPS
5.6.1.Key market trends, growth factors, and opportunities
5.6.2.Market size and forecast, by region
5.6.3.Market analysis, by country
5.7. Secure Web Gateways
5.7.1.Key market trends, growth factors, and opportunities
5.7.2.Market size and forecast, by region
5.7.3.Market analysis, by country
5.8. DDoS Mitigation
5.8.1.Key market trends, growth factors, and opportunities
5.8.2.Market size and forecast, by region
5.8.3.Market analysis, by country
5.9. Unified Threat Management
5.9.1.Key market trends, growth factors, and opportunities
5.9.2.Market size and forecast, by region
5.9.3.Market analysis, by country
5.10. Others
5.10.1.Key market trends, growth factors, and opportunities
5.10.2.Market size and forecast, by region
5.10.3.Market analysis, by country
CHAPTER 6:NETWORK SECURITY MARKET, BY SERVICE
6.1.Overview
6.2.Professional Services
6.2.1.Key market trends, growth factors, and opportunities
6.2.2.Market size and forecast, by region
6.2.3.Market analysis, by country
6.3.Managed Services
6.3.1.Key market trends, growth factors, and opportunities
6.3.2.Market size and forecast, by region
6.3.3.Market analysis, by country
CHAPTER 7:NETWORK SECURITY MARKET, BY DEPLOYMENT
7.1.Overview
7.2.On-premise
7.2.1.Key market trends, growth factors, and opportunities
7.2.2.Market size and forecast, by region
7.2.3.Market analysis, by country
7.3.Cloud
7.3.1.Key market trends, growth factors, and opportunities
7.3.2.Market size and forecast, by region
7.3.3.Market analysis, by country
CHAPTER 8:NETWORK SECURITY MARKET, BY ORGANIZATION SIZE
8.1.Overview
8.2.Large Enterprise
8.2.1.Key market trends, growth factors, and opportunities
8.2.2.Market size and forecast, by region
8.2.3.Market analysis, by country
8.3.Small and Medium Enterprise
8.3.1.Key market trends, growth factors, and opportunities
8.3.2.Market size and forecast, by region
8.3.3.Market analysis, by country
CHAPTER 9:NETWORK SECURITY STORAGE MARKET, BY INDUSTRY VERTICAL
9.1.Overview
9.2.Aerospace and Defensel
9.2.1.Key market trends, growth factors, and opportunities
9.2.2.Market size and forecast, by region
9.2.3.Market analysis, by country
9.3.Government
9.3.1.Key market trends, growth factors, and opportunities
9.3.2.Market size and forecast, by region
9.3.3.Market analysis, by country
9.4.BFSI
9.4.1.Key market trends, growth factors, and opportunities
9.4.2.Market size and forecast, by region
9.4.3.Market analysis, by country
9.5.IT and Telecom
9.5.1.Key market trends, growth factors, and opportunities
9.5.2.Market size and forecast, by region
9.5.3.Market analysis, by country
9.6.Healthcare
9.6.1.Key market trends, growth factors, and opportunities
9.6.2.Market size and forecast, by region
9.6.3.Market analysis, by country
9.7.Retail
9.7.1.Key market trends, growth factors, and opportunities
9.7.2.Market size and forecast, by region
9.7.3.Market analysis, by country
9.8.Manufacturing
9.8.1.Key market trends, growth factors, and opportunities
9.8.2.Market size and forecast, by region
9.8.3.Market analysis, by country
9.9.Energy and Utilities
9.9.1.Key market trends, growth factors, and opportunities
9.9.2.Market size and forecast, by region
9.9.3.Market analysis, by country
9.10.Others
9.10.1.Key market trends, growth factors, and opportunities
9.10.2.Market size and forecast, by region
9.10.3.Market analysis, by country
CHAPTER 10:NETWORK SECURITY MARKET, BY REGION
10.1.Overview
10.2.North America
10.2.1.Key market trends, growth factors and opportunities
10.2.2.Market size and forecast, by component
10.2.3.Market size and forecast, by solution
10.2.4.Market size and forecast, by service
10.2.5.Market size and forecast, by deployment
10.2.6.Market size and forecast, by organization size
10.2.7.Market size and forecast, by industry verticals
10.2.8.Market analysis, by country
10.2.8.1.U.S.
10.2.8.1.1.Market size and forecast, by component
10.2.8.1.2.Market size and forecast, by solution
10.2.8.1.3.Market size and forecast, by service
10.2.8.1.4.Market size and forecast, by deployment
10.2.8.1.5.Market size and forecast, by organization size
10.2.8.1.6.Market size and forecast, by industry verticals
10.2.8.2.Canada
10.2.8.2.1.Market size and forecast, by component
10.2.8.2.2.Market size and forecast, by solution
10.2.8.2.3.Market size and forecast, by service
10.2.8.2.4.Market size and forecast, by deployment
10.2.8.2.5.Market size and forecast, by Organization Size
10.2.8.2.6.Market size and forecast, by industry verticals
10.3.Europe
10.3.1.Key market trends, growth factors and opportunities
10.3.2.Market size and forecast, by component
10.3.3.Market size and forecast, by solution
10.3.4.Market size and forecast, by service
10.3.5.Market size and forecast, by deployment
10.3.6.Market size and forecast, by Organization Size
10.3.7.Market size and forecast, by industry verticals
10.3.8.Market analysis, by country
10.3.8.1.UK
10.3.8.1.1.Market size and forecast, by component
10.3.8.1.2.Market size and forecast, by solution
10.3.8.1.3.Market size and forecast, by service
10.3.8.1.4.Market size and forecast, by deployment
10.3.8.1.5.Market size and forecast, by Organization Size
10.3.8.1.6.Market size and forecast, by industry verticals
10.3.8.2.Germany
10.3.8.2.1.Market size and forecast, by component
10.3.8.2.2.Market size and forecast, by solution
10.3.8.2.3.Market size and forecast, by service
10.3.8.2.4.Market size and forecast, by deployment
10.3.8.2.5.Market size and forecast, by Organization Size
10.3.8.2.6.Market size and forecast, by industry verticals
10.3.8.3.France
10.3.8.3.1.Market size and forecast, by component
10.3.8.3.2.Market size and forecast, by solution
10.3.8.3.3.Market size and forecast, by service
10.3.8.3.4.Market size and forecast, by deployment
10.3.8.3.5.Market size and forecast, by Organization Size
10.3.8.3.6.Market size and forecast, by industry verticals
10.3.8.4.Spain
10.3.8.4.1.Market size and forecast, by component
10.3.8.4.2.Market size and forecast, by solution
10.3.8.4.3.Market size and forecast, by service
10.3.8.4.4.Market size and forecast, by deployment
10.3.8.4.5.Market size and forecast, by Organization Size
10.3.8.4.6.Market size and forecast, by industry verticals
10.3.8.5.Italy
10.3.8.5.1.Market size and forecast, by component
10.3.8.5.2.Market size and forecast, by solution type
10.3.8.5.3.Market size and forecast, by service
10.3.8.5.4.Market size and forecast, by deployment
10.3.8.5.5.Market size and forecast, by Organization Size
10.3.8.5.6.Market size and forecast, by industry verticals
10.3.8.6.Rest of Europe
10.3.8.6.1.Market size and forecast, by component
10.3.8.6.2.Market size and forecast, by solution type
10.3.8.6.2.Market size and forecast, by service
10.3.8.6.3.Market size and forecast, by deployment
10.3.8.6.4.Market size and forecast, by Organization Size
10.3.8.6.5.Market size and forecast, by industry verticals
10.4.Asia-Pacific
10.4.1.Key market trends, growth factors and opportunities
10.4.2.Market size and forecast, by component
10.4.3.Market size and forecast, by solution type
10.4.4.Market size and forecast, by service
10.4.5.Market size and forecast, by deployment
10.4.6.Market size and forecast, by Organization Size
10.4.7.Market size and forecast, by industry verticals
10.4.8.Market analysis, by country
10.4.8.1.China
10.4.8.1.1.Market size and forecast, by component
10.4.8.1.2.Market size and forecast, by solution type
10.4.8.1.3.Market size and forecast, by service
10.4.8.1.4.Market size and forecast, by deployment
10.4.8.1.5.Market size and forecast, by Organization Size
10.4.8.1.6.Market size and forecast, by industry verticals
10.4.8.2.India
10.4.8.2.1.Market size and forecast, by component
10.4.8.2.2.Market size and forecast, by solution type
10.4.8.2.3.Market size and forecast, by service
10.4.8.2.4.Market size and forecast, by deployment
10.4.8.2.5.Market size and forecast, by Organization Size
10.4.8.2.6.Market size and forecast, by industry verticals
10.4.8.3.Japan
10.4.8.3.1.Market size and forecast, by component
10.4.8.3.2.Market size and forecast, by solution type
10.4.8.3.3.Market size and forecast, by service
10.4.8.3.4.Market size and forecast, by deployment
10.4.8.3.5.Market size and forecast, by Organization Size
10.4.8.3.6.Market size and forecast, by industry verticals
10.4.8.4.South Korea
10.4.8.4.1.Market size and forecast, by component
10.4.8.4.2.Market size and forecast, by solution type
10.4.8.4.3.Market size and forecast, by service
10.4.8.4.4.Market size and forecast, by deployment
10.4.8.4.5.Market size and forecast, by Organization Size
10.4.8.4.6.Market size and forecast, by industry verticals
10.4.8.5.Australia
10.4.8.5.1.Market size and forecast, by component
10.4.8.5.2.Market size and forecast, by solution type
10.4.8.5.3.Market size and forecast, by service
10.4.8.5.4.Market size and forecast, by deployment
10.4.8.5.5.Market size and forecast, by Organization Size
10.4.8.5.6.Market size and forecast, by industry verticals
10.4.8.6.Rest of Asia-Pacific
10.4.8.6.1.Market size and forecast, by component
10.4.8.6.2.Market size and forecast, by solution type
10.4.8.6.3.Market size and forecast, by service
10.4.8.6.4.Market size and forecast, by deployment
10.4.8.6.5.Market size and forecast, by Organization Size
10.4.8.6.6.Market size and forecast, by industry verticals
10.5.LAMEA
10.5.1.Key market trends, growth factors and opportunities
10.5.2.Market size and forecast, by component
10.5.3.Market size and forecast, by solution type
10.5.4.Market size and forecast, by service
10.5.5.Market size and forecast, by deployment
10.5.6.Market size and forecast, by Organization Size
10.5.7.Market size and forecast, by industry verticals
10.5.8.Market analysis, by country
10.5.8.1.Latin America
10.5.8.1.1.Market size and forecast, by component
10.5.8.1.2.Market size and forecast, by solution type
10.5.8.1.3.Market size and forecast, by service
10.5.8.1.4.Market size and forecast, by deployment
10.5.8.1.5.Market size and forecast, by Organization Size
10.5.8.1.6.Market size and forecast, by industry verticals
10.5.8.2.Middle East
10.5.8.2.1.Market size and forecast, by component
10.5.8.2.2.Market size and forecast, by solution type
10.5.8.2.3.Market size and forecast, by service
10.5.8.2.4.Market size and forecast, by deployment
10.5.8.2.5.Market size and forecast, by Organization Size
10.5.8.2.6.Market size and forecast, by industry verticals
10.5.8.3.Africa
10.5.8.3.1.Market size and forecast, by component
10.5.8.3.2.Market size and forecast, by solution type
10.5.8.3.3.Market size and forecast, by service
10.5.8.3.4.Market size and forecast, by deployment
10.5.8.3.5.Market size and forecast, by Organization Size
10.5.8.3.6.Market size and forecast, by industry verticals
Chapter 10:Company Profile
10.1.CISCO SYSTEM
10.1.1.Company overview
10.1.2.Key executives
10.1.3.Company snapshot
10.1.4.Operating business segments
10.1.5.Product portfolio
10.1.6.Business performance
10.1.7.Key strategic moves and developments
10.2.SOLAR WINDS
10.2.1.Company overview
10.2.2.Key executives
10.2.3.Company snapshot
10.2.4.Operating business segments
10.2.5.Product portfolio
10.2.6.R&D expenditure
10.2.7.Business performance
10.2.8.Key strategic moves and developments
10.3.IBM CORPORATION
10.3.1.Company overview
10.3.2.Company snapshot
10.3.3.Operating business segments
10.3.4.Product portfolio
10.3.5.Business performance
10.3.6.Key strategic moves and developments
10.4.TRENDMICRO
10.4.1.Company overview
10.4.2.Key executives
10.4.3.Company snapshot
10.4.4.Product portfolio
10.4.5.Business performance
10.4.6.Key strategic moves and developments
10.5.FIREMON
10.5.1.Company overview
10.5.2.Key executives
10.5.3.Company snapshot
10.5.4.Product portfolio
10.5.5.Business performance
10.5.6.Key strategic moves and developments
10.6.AVAST SOFTWARE .
10.6.1.Company overview
10.6.2.Key executives
10.6.3.Company snapshot
10.6.4.Product portfolio
10.6.5.Key strategic moves and developments
10.7.SYMANTEC
10.7.1.Company overview
10.7.2.Key executives
10.7.3.Company snapshot
10.7.4.Product portfolio
10.7.5.Key strategic moves and developments
10.8.FIREEYE
10.8.1.Company overview
10.8.2.Key executives
10.8.3.Company snapshot
10.8.4.Product portfolio
10.8.5.Key strategic moves and developments
10.9.GFI SOFTWARE
10.9.1.Company overview
10.9.2.Key executives
10.9.3.Company snapshot
10.9.4.Product portfolio
10.9.5.Key strategic moves and developments
10.10 JUNIPER NETWORKS
10.10.1.Company overview
10.10.2.Key executives
10.10.3.Company snapshot
10.10.4.Product portfolio
10.10.5.Key strategic moves and developments
LIST OF TABLES
TABLE 01 NETWORK SECURITY MARKET, BY COMPONENT, 2019–2027 ($MILLION)
TABLE 02 NETWORK SECURITY MARKET FOR SOLUTION, BY REGION, 2019–2027 ($MILLION)
TABLE 03 NETWORK SECURITY MARKET FOR SERVICE, BY REGION, 2019–2027 ($MILLION)
TABLE 04 NETWORK SECURITY MARKET, BY SOLUTION 2019–2027 ($MILLION)
TABLE 05 NETWORK SECURITY MARKET FOR FIREWALL, 2019–2027 ($MILLION)
TABLE 06 NETWORK SECURITY MARKET FOR ANTIVIRUS, BY REGION, 2019–2027 ($MILLION)
TABLE 07 NETWORK SECURITY MARKET FOR NETWORK ACCESS CONTROL, BY REGION, 2019–2027 ($MILLION)
TABLE 08 NETWORK SECURITY MARKET FOR DATA LOSS PREVENTION, BY REGION, 2019–2027 ($MILLION)
TABLE 09 NETWORK SECURITY MARKET FOR IDS/IPS, BY REGION, 2019–2027 ($MILLION)
TABLE 10 NETWORK SECURITY MARKET FOR SECURE WEB GATEWAYS, BY REGION, 2019–2027 ($MILLION)
TABLE 11 NETWORK SECURITY MARKET FOR DDOS MITIGATION, BY REGION, 2019–2027 ($MILLION)
TABLE 12 NETWORK SECURITY MARKET FOR UNIFIED THREAT MANAGEMENT, BY REGION, 2019–2027 ($MILLION)
TABLE 13 NETWORK SECURITY MARKET FOR OTHERS, BY REGION, 2019–2027 ($MILLION)
TABLE 14 NETWORK SECURITY MARKET FOR SERVICE, BY REGION, 2019–2027 ($MILLION)
TABLE 15 NETWORK SECURITY MARKET FOR PROFESSIONAL SERVICES, BY REGION, 2019–2027 ($MILLION)
TABLE 16 NETWORK SECURITY MARKET FOR MANAGED SERVICES, BY REGION, 2019–2027 ($MILLION)
TABLE 17 NETWORK SECURITY MARKET, BY DEPLOYMENT MODEL, 2019–2027 ($MILLION)
TABLE 18 NETWORK SECURITY MARKET FOR ON-PREMISE SEGMENT, BY REGION, 2019–2027 ($MILLION)
TABLE 19 NETWORK SECURITY MARKET FOR CLOUD SEGMENT, BY REGION, 2019–2027 ($MILLION)
TABLE 20 NETWORK SECURITY MARKET, BY ORGANIZATION SIZE, 2019–2027 ($MILLION)
TABLE 21 NETWORK SECURITY MARKET FOR LARGE ENTERPRISE, BY REGION, 2019–2027 ($MILLION)
TABLE 22 NETWORK SECURITY MARKET FOR SMALL AND MEDIUM ENTERPRISE, BY REGION, 2019–2027 ($MILLION)
TABLE 23 NETWORK SECURITY MARKET, BY INDUSTRY VERTICAL, 2019–2027 ($MILLION)
TABLE 24 NETWORK SECURITY MARKET FOR AEROSPACE AND DEFENSE BY REGION, 2019–2027 ($MILLION)
TABLE 25 NETWORK SECURITY MARKET FOR GOVERNMENT, BY REGION, 2019–2027 ($MILLION)
TABLE 26 NETWORK SECURITY MARKET FOR BFSI BY REGION, 2019–2027 ($MILLION)
TABLE 27 NETWORK SECURITY MARKET FOR IT AND TELECOM, BY REGION, 2019–2027 ($MILLION)
TABLE 28 NETWORK SECURITY MARKET FOR MANUFACTURING, BY REGION, 2019–2027 ($MILLION)
TABLE 29 NETWORK SECURITY MARKET FOR HEALTHCARE, BY REGION, 2019–2027 ($MILLION)
TABLE 30 NETWORK SECURITY MARKET FOR RETAIL, BY REGION, 2019–2027 ($MILLION)
TABLE 31 NETWORK SECURITY MARKET FOR ENERGY AND UTILITIES, BY REGION, 2019–2027 ($MILLION)
TABLE 32 NETWORK SECURITY MARKET FOR OTHERS, BY REGION, 2019–2027 ($MILLION)
TABLE 33 NETWORK SECURITY MARKET, BY REGION, 2019–2027 ($MILLION)
TABLE 34 NORTH AMERICA NETWORK SECURITY MARKET, BY COMPONENT, 2019–2027 ($MILLION)
TABLE 35 NORTH AMERICA NETWORK SECURITY MARKET, BY SOLUTION, 2019–2027 ($MILLION)
TABLE 36 NORTH AMERICA NETWORK SECURITY MARKET, BY SERVICES, 2019–2027 ($MILLION)
TABLE 37 NORTH AMERICA NETWORK SECURITY MARKET, BY DEPLOYMENT MODEL, 2019–2027 ($MILLION)
TABLE 38 NORTH AMERICA NETWORK SECURITY MARKET, BY ORGANIZATION SIZE, 2019–2027 ($MILLION)
TABLE 39 NORTH AMERICA NETWORK SECURITY MARKET, BY INDUSTRY VERTICAL, 2019–2027 ($MILLION)
TABLE 40 NORTH AMERICA NETWORK SECURITY MARKET, BY COUNTRY, 2019–2027 ($MILLION)
TABLE 41 U.S. NETWORK SECURITY MARKET, BY COMPONENT, 2019–2027 ($MILLION)
TABLE 42 U.S. NETWORK SECURITY MARKET, BY SOLUTION 2019–2027 ($MILLION)
TABLE 43 U.S. NETWORK SECURITY MARKET, BY SERVICES 2019–2027 ($MILLION)
TABLE 44 U.S. NETWORK SECURITY MARKET, BY DEPLOYMENT MODEL, 2019–2027 ($MILLION)
TABLE 45 U.S. NETWORK SECURITY MARKET, BY ORGANIZATION SIZE, 2019–2027 ($MILLION)
TABLE 46 U.S. NETWORK SECURITY MARKET, BY INDUSTRY VERTICAL, 2019–2027 ($MILLION)
TABLE 47 CANADA NETWORK SECURITY MARKET, BY COMPONENT, 2019–2027 ($MILLION)
TABLE 48 CANADA NETWORK SECURITY MARKET, BY SOLUTION, 2019–2027 ($MILLION)
TABLE 49 CANADA NETWORK SECURITY MARKET, BY SERVICES, 2019–2027 ($MILLION)
TABLE 50 CANADA NETWORK SECURITY MARKET, BY DEPLOYMENT MODEL, 2019–2027 ($MILLION)
TABLE 51 CANADA NETWORK SECURITY MARKET, BY ORGANIZATION SIZE, 2019–2027 ($MILLION)
TABLE 52 CANADA NETWORK SECURITY MARKET, BY INDUSTRY VERTICAL, 2019–2027 ($MILLION)
TABLE 53 EUROPE NETWORK SECURITY MARKET, BY COMPONENT, 2019–2027 ($MILLION)
TABLE 54 EUROPE NETWORK SECURITY MARKET, BY SOLUTION, 2019–2027 ($MILLION)
TABLE 55 EUROPE NETWORK SECURITY MARKET, BY SERVICES, 2019–2027 ($MILLION)
TABLE 56 EUROPE NETWORK SECURITY MARKET, BY DEPLOYMENT MODEL, 2019–2027 ($MILLION)
TABLE 57 EUROPE NETWORK SECURITY MARKET, BY ORGANIZATION SIZE, 2019–2027 ($MILLION)
TABLE 58 EUROPE NETWORK SECURITY MARKET, BY INDUSTRY VERTICAL, 2019–2027 ($MILLION)
TABLE 59 EUROPE NETWORK SECURITY MARKET, BY COUNTRY, 2019–2027 ($MILLION)
TABLE 60 GERMANY NETWORK SECURITY MARKET, BY COMPONENT, 2019–2027 ($MILLION)
TABLE 61 GERMANY NETWORK SECURITY MARKET, BY SOLUTION, 2019–2027 ($MILLION)
TABLE 62 GERMANY NETWORK SECURITY MARKET, BY SERVICES, 2019–2027 ($MILLION)
TABLE 63 GERMANY NETWORK SECURITY MARKET, BY DEPLOYMENT MODEL, 2019–2027 ($MILLION)
TABLE 64 GERMANY NETWORK SECURITY MARKET, BY ORGANIZATION SIZE, 2019–2027 ($MILLION)
TABLE 65 GERMANY NETWORK SECURITY MARKET, BY INDUSTRY VERTICAL, 2019–2027 ($MILLION)
TABLE 66 FRANCE NETWORK SECURITY MARKET, BY COMPONENT, 2019–2027 ($MILLION)
TABLE 67 FRANCE NETWORK SECURITY MARKET, BY SOLUTION, 2019–2027 ($MILLION)
TABLE 68 FRANCE NETWORK SECURITY MARKET, BY SERVICES, 2019–2027 ($MILLION)
TABLE 69 FRANCE NETWORK SECURITY MARKET, BY DEPLOYMENT MODEL, 2019–2027 ($MILLION)
TABLE 70 FRANCE NETWORK SECURITY MARKET, BY ORGANIZATION SIZE, 2019–2027 ($MILLION)
TABLE 71 FRANCE NETWORK SECURITY MARKET, BY INDUSTRY VERTICAL, 2019–2027 ($MILLION)
TABLE 72 UK NETWORK SECURITY MARKET, BY COMPONENT, 2019–2027 ($MILLION)
TABLE 73 UK NETWORK SECURITY MARKET, BY SOLUTION TYPE, 2019–2027 ($MILLION)
TABLE 74 UK NETWORK SECURITY MARKET, BY SERVICES, 2019–2027 ($MILLION)
TABLE 75 UK NETWORK SECURITY MARKET, BY DEPLOYMENT MODEL, 2019–2027 ($MILLION)
TABLE 76 UK NETWORK SECURITY MARKET, BY ORGANIZATION SIZE, 2019–2027 ($MILLION)
TABLE 77 UK NETWORK SECURITY MARKET, BY INDUSTRY VERTICAL, 2019–2027 ($MILLION)
TABLE 78 SPAIN NETWORK SECURITY MARKET, BY COMPONENT, 2019–2027 ($MILLION)
TABLE 79 SPAIN NETWORK SECURITY MARKET, BY SOLUTION, 2019–2027 ($MILLION)
TABLE 80 SPAIN NETWORK SECURITY MARKET, BY SERVICES, 2019–2027 ($MILLION)
TABLE 81 SPAIN NETWORK SECURITY MARKET, BY DEPLOYMENT MODEL, 2019–2027 ($MILLION)
TABLE 82 SPAIN NETWORK SECURITY MARKET, BY ORGANIZATION SIZE, 2019–2027 ($MILLION)
TABLE 83 SPAIN NETWORK SECURITY MARKET, BY INDUSTRY VERTICAL, 2019–2027 ($MILLION)
TABLE 84 ITALY NETWORK SECURITY MARKET, BY COMPONENT, 2019–2027 ($MILLION)
TABLE 85 ITALY NETWORK SECURITY MARKET, BY SOLUTION TYPE, 2019–2027 ($MILLION)
TABLE 86 ITALY NETWORK SECURITY MARKET, BY SERVICE, 2019–2027 ($MILLION)
TABLE 87 ITALY NETWORK SECURITY MARKET, BY DEPLOYMENT MODEL, 2019–2027 ($MILLION)
TABLE 88 ITALY NETWORK SECURITY MARKET, BY ORGANIZATION SIZE, 2019–2027 ($MILLION)
TABLE 89 ITALY NETWORK SECURITY MARKET, BY INDUSTRY VERTICAL, 2019–2027 ($MILLION)
TABLE 90 REST OF EUROPE NETWORK SECURITY MARKET, BY COMPONENT, 2019–2027 ($MILLION)
TABLE 91 REST OF EUROPE NETWORK SECURITY MARKET, BY SOLUTION TYPE, 2019–2027 ($MILLION)
TABLE 92 REST OF EUROPE NETWORK SECURITY MARKET, BY SERVICES, 2019–2027 ($MILLION)
TABLE 93 REST OF EUROPE NETWORK SECURITY MARKET, BY DEPLOYMENT MODEL, 2019–2027 ($MILLION)
TABLE 94 REST OF EUROPE NETWORK SECURITY MARKET, BY ORGANIZATION SIZE, 2019–2027 ($MILLION)
TABLE 95 REST OF EUROPE NETWORK SECURITY MARKET, BY INDUSTRY VERTICAL, 2019–2027 ($MILLION)
TABLE 96 ASIA-PACIFIC NETWORK SECURITY MARKET, BY COMPONENT, 2019–2027 ($MILLION)
TABLE 97 ASIA-PACIFIC NETWORK SECURITY MARKET, BY SOLUTION TYPE, 2019–2027 ($MILLION)
TABLE 98 ASIA-PACIFIC NETWORK SECURITY MARKET, BY SERVICES, 2019–2027 ($MILLION)
TABLE 99 ASIA-PACIFIC NETWORK SECURITY MARKET, BY DEPLOYMENT MODEL, 2019–2027 ($MILLION)
TABLE 100 ASIA-PACIFIC NETWORK SECURITY MARKET, BY ORGANIZATION SIZE, 2019–2027 ($MILLION)
TABLE 101 ASIA-PACIFIC NETWORK SECURITY MARKET, BY INDUSTRY VERTICAL, 2019–2027 ($MILLION)
TABLE 102 ASIA-PACIFIC NETWORK SECURITY MARKET, BY COUNTRY, 2019–2027 ($MILLION)
TABLE 103 JAPAN NETWORK SECURITY MARKET, BY COMPONENT, 2019–2027 ($MILLION)
TABLE 104 JAPAN NETWORK SECURITY MARKET, BY SOLUTION TYPE, 2019–2027 ($MILLION)
TABLE 105 JAPAN NETWORK SECURITY MARKET, BY SERVICES, 2019–2027 ($MILLION)
TABLE 106 JAPAN NETWORK SECURITY MARKET, BY DEPLOYMENT MODEL, 2019–2027 ($MILLION)
TABLE 107 JAPAN NETWORK SECURITY MARKET, BY ORGANIZATION SIZE, 2019–2027 ($MILLION)
TABLE 108 JAPAN NETWORK SECURITY MARKET, BY INDUSTRY VERTICAL, 2019–2027 ($MILLION)
TABLE 109 CHINA NETWORK SECURITY MARKET, BY COMPONENT, 2019–2027 ($MILLION)
TABLE 110 CHINA NETWORK SECURITY MARKET, BY SOLUTION TYPE, 2019–2027 ($MILLION)
TABLE 111 CHINA NETWORK SECURITY MARKET, BY SERVICES, 2019–2027 ($MILLION)
TABLE 112 CHINA NETWORK SECURITY MARKET, BY DEPLOYMENT MODEL, 2019–2027 ($MILLION)
TABLE 113 CHINA NETWORK SECURITY MARKET, BY ORGANIZATION SIZE, 2019–2027 ($MILLION)
TABLE 114 CHINA NETWORK SECURITY MARKET, BY INDUSTRY VERTICAL, 2019–2027 ($MILLION)
TABLE 115 AUSTRALIA NETWORK SECURITY MARKET, BY COMPONENT, 2019–2027 ($MILLION)
TABLE 116 AUSTRALIA NETWORK SECURITY MARKET, BY SOLUTION TYPE, 2019–2027 ($MILLION)
TABLE 117 AUSTRALIA NETWORK SECURITY MARKET, BY SERVICES, 2019–2027 ($MILLION)
TABLE 118 AUSTRALIA NETWORK SECURITY MARKET, BY DEPLOYMENT MODEL, 2019–2027 ($MILLION)
TABLE 119 AUSTRALIA NETWORK SECURITY MARKET, BY ORGANIZATION SIZE, 2019–2027 ($MILLION)
TABLE 120 AUSTRALIA NETWORK SECURITY MARKET, BY INDUSTRY VERTICAL, 2019–2027 ($MILLION)
TABLE 121 INDIA NETWORK SECURITY MARKET, BY COMPONENT, 2019–2027 ($MILLION)
TABLE 122 INDIA NETWORK SECURITY MARKET, BY SOLUTION TYPE, 2019–2027 ($MILLION)
TABLE 123 INDIA NETWORK SECURITY MARKET, BY SERVICES, 2019–2027 ($MILLION)
TABLE 124 INDIA NETWORK SECURITY MARKET, BY DEPLOYMENT MODEL, 2019–2027 ($MILLION)
TABLE 125 INDIA NETWORK SECURITY MARKET, BY ORGANIZATION SIZE, 2019–2027 ($MILLION)
TABLE 126 INDIA NETWORK SECURITY MARKET, BY INDUSTRY VERTICAL, 2019–2027 ($MILLION)
TABLE 127 SOUTH KOREA NETWORK SECURITY MARKET, BY COMPONENT, 2019–2027 ($MILLION)
TABLE 128 SOUTH KOREA NETWORK SECURITY MARKET, BY SOLUTION TYPE, 2019–2027 ($MILLION)
TABLE 129 SOUTH KOREA NETWORK SECURITY MARKET, BY SERVICE, 2019–2027 ($MILLION)
TABLE 130 SOUTH KOREA NETWORK SECURITY MARKET, BY DEPLOYMENT MODEL, 2019–2027 ($MILLION)
TABLE 131 SOUTH KOREA NETWORK SECURITY MARKET, BY ORGANIZATION SIZE, 2019–2027 ($MILLION)
TABLE 132 SOUTH KOREA NETWORK SECURITY MARKET, BY INDUSTRY VERTICAL, 2019–2027 ($MILLION)
TABLE 133 REST OF ASIA-PACIFIC NETWORK SECURITY MARKET, BY COMPONENT, 2019–2027 ($MILLION)
TABLE 134 REST OF ASIA-PACIFIC NETWORK SECURITY MARKET, BY SOLUTION TYPE, 2019–2027 ($MILLION)
TABLE 135 REST OF ASIA-PACIFIC NETWORK SECURITY MARKET, BY SERVICES, 2019–2027 ($MILLION)
TABLE 136 REST OF ASIA-PACIFIC NETWORK SECURITY MARKET, BY DEPLOYMENT MODEL, 2019–2027 ($MILLION)
TABLE 137 REST OF ASIA-PACIFIC NETWORK SECURITY MARKET, BY ORGANIZATION SIZE, 2019–2027 ($MILLION)
TABLE 138 REST OF ASIA-PACIFIC NETWORK SECURITY MARKET, BY INDUSTRY VERTICAL, 2019–2027 ($MILLION)
TABLE 139 LAMEA NETWORK SECURITY MARKET, BY COMPONENT, 2019–2027 ($MILLION)
TABLE 140 LAMEA NETWORK SECURITY MARKET, BY SOLUTION TYPE, 2019–2027 ($MILLION)
TABLE 141 LAMEA NETWORK SECURITY MARKET, BY SERVICES, 2019–2027 ($MILLION)
TABLE 142 LAMEA NETWORK SECURITY MARKET, BY DEPLOYMENT MODEL, 2019–2027 ($MILLION)
TABLE 143 LAMEA NETWORK SECURITY MARKET, BY ORGANIZATION SIZE, 2019–2027 ($MILLION)
TABLE 144 LAMEA NETWORK SECURITY MARKET, BY INDUSTRY VERTICAL, 2019–2027 ($MILLION)
TABLE 145 LATIN AMERICA NETWORK SECURITY MARKET, BY COMPONENT, 2019–2027 ($MILLION)
TABLE 146 LATIN AMERICA NETWORK SECURITY MARKET, BY SOLUTION TYPE, 2019–2027 ($MILLION)
TABLE 147 LATIN AMERICA NETWORK SECURITY MARKET, BY SERVICES, 2019–2027 ($MILLION)
TABLE 148 LATIN AMERICA NETWORK SECURITY MARKET, BY DEPLOYMENT MODEL, 2019–2027 ($MILLION)
TABLE 149 LATIN AMERICA NETWORK SECURITY MARKET, BY ORGANIZATION SIZE, 2019–2027 ($MILLION)
TABLE 150 LATIN AMERICA NETWORK SECURITY MARKET, BY INDUSTRY VERTICAL, 2019–2027 ($MILLION)
TABLE 151 MIDDLE EAST NETWORK SECURITY MARKET, BY COMPONENT, 2019–2027 ($MILLION)
TABLE 152 MIDDLE EAST NETWORK SECURITY MARKET, BY SOLUTION TYPE, 2019–2027 ($MILLION)
TABLE 153 MIDDLE EAST NETWORK SECURITY MARKET, BY SERVICES, 2019–2027 ($MILLION)
TABLE 154 MIDDLE EAST NETWORK SECURITY MARKET, BY DEPLOYMENT MODEL, 2019–2027 ($MILLION)
TABLE 155 MIDDLE EAST NETWORK SECURITY MARKET, BY ORGANIZATION SIZE, 2019–2027 ($MILLION)
TABLE 156 MIDDLE EAST NETWORK SECURITY MARKET, BY INDUSTRY VERTICAL, 2019–2027 ($MILLION)
TABLE 157 AFRICA NETWORK SECURITY MARKET, BY COMPONENT, 2019–2027 ($MILLION)
TABLE 158 AFRICA NETWORK SECURITY MARKET, BY SOLUTION TYPE, 2019–2027 ($MILLION)
TABLE 159 AFRICA NETWORK SECURITY MARKET, BY SERVICES, 2019–2027 ($MILLION)
TABLE 160 AFRICA NETWORK SECURITY MARKET, BY DEPLOYMENT MODEL, 2019–2027 ($MILLION)
TABLE 161 AFRICA NETWORK SECURITY MARKET, BY DEPLOYMENT MODEL, 2019–2027 ($MILLION)
TABLE 162 AFRICA NETWORK SECURITY MARKET, BY INDUSTRY VERTICAL, 2019–2027 ($MILLION)
TABLE 163 PARTNERSHIP (2019–2020)
TABLE 164 COLLABORATION (2019–2020)
TABLE 165 ACQUISTION (2019–2020)
TABLE 166 CISCO SYSTEMS: KEY EXECUTIVES
TABLE 167 CISCO SYSTEMS: COMPANY SNAPSHOT
TABLE 168 CISCO SYSTEMS: OPERATING SEGMENTS
TABLE 169 CISCO SYSTEMS: PRODUCT PORTFOLIO
TABLE 170 SolarWinds: KEY EXECUTIVES
TABLE 171 SolarWinds: COMPANY SNAPSHOT
TABLE 172 SolarWinds: OPERATING SEGMENTS
TABLE 173 IBM. : PRODUCT PORTFOLIO
TABLE 174 TREND MICRO: KEY EXECUTIVES
TABLE 175 Trend Micro: COMPANY SNAPSHOT
TABLE 176 Trend Micro: OPERATING SEGMENTS
TABLE 177 TREND MICRO.: PRODUCT PORTFOLIO
TABLE 178 FIREMON: KEY EXECUTIVES
TABLE 179 FIREMON : COMPANY SNAPSHOT
TABLE 180 FIREMON: PRODUCT PORTFOLIO
TABLE 181 SYMANTEC: KEY EXECUTIVES
TABLE 182 Symantec: COMPANY SNAPSHOT
TABLE 183 Symantec: PRODUCT PORTFOLIO
TABLE 184 FireEye: KEY EXECUTIVES
TABLE 185 FireEye: COMPANY SNAPSHOT
TABLE 186 FireEye: PRODUCT PORTFOLIO
TABLE 187 GFI Software: KEY EXECUTIVES
TABLE 188 GFI Software: COMPANY SNAPSHOT
TABLE 189 GFI Software: PRODUCT PORTFOLIO
TABLE 190 GFI Software: KEY STRATEGIC MOVES AND DEVELOPMENT
TABLE 191 Avast Software: KEY EXECUTIVES
TABLE 192 Avast Software: COMPANY SNAPSHOT
TABLE 193 NETWORK SECURITY: PRODUCT PORTFOLIO
TABLE 194 Juniper Networks: KEY EXECUTIVES
TABLE 195 Juniper Networks: COMPANY SNAPSHOT
TABLE 196 Juniper Networks: PRODUCT PORTFOLIO
LIST OF FIGURES
FIGURE 01 NETWORK SECURITY MARKET SNAPSHOT, BY SEGMENT, 2019–2027
FIGURE 02 NETWORK SECURITY MARKET SNAPSHOT, BY SEGMENT, 2019–2027
FIGURE 03 NETWORK SECURITY MARKET SNAPSHOT, BY COUNTRY, 2019–2027
FIGURE 04 NETWORK SECURITY MARKET SNAPSHOT, BY COUNTRY, 2019–2027
FIGURE 05 TOP IMPACTING FACTORS
FIGURE 06 TOP INVESTMENT POCKETS
FIGURE 07 MODERATE-TO-HIGH BARGAINING POWER OF SUPPLIERS
FIGURE 08 HIGH BARGAINING POWER OF BUYERS
FIGURE 09 HIGH THREAT OF SUBSTITUTES
FIGURE 10 MODERATE-TO-HIGH THREAT OF NEW ENTRANTS
FIGURE 11 HIGH COMPETITIVE RIVALRY
FIGURE 12 MARKET DYNAMICS: GLOBAL NETWORK SECURITY MARKET
FIGURE 13 NETWORK SECURITY MARKET, BY COMPONENT, 2019–2027 ($MILLION)
FIGURE 14 COMPARATIVE SHARE ANALYSIS OF NETWORK SECURITY MARKET FOR SOLUTION, BY COUNTRY, 2019 & 2027 (%)
FIGURE 15 COMPARATIVE SHARE ANALYSIS OF NETWORK SECURITY MARKET FOR SERVICE, BY COUNTRY, 2019 & 2027 (%)
FIGURE 16 NETWORK SECURITY MARKET, BY SOLUTION, 2019–2027 ($MILLION)
FIGURE 17 COMPARATIVE SHARE ANALYSIS OF NETWORK SECURITY MARKET FOR FIREWALL, 2019 & 2027 (%)
FIGURE 18 COMPARATIVE SHARE ANALYSIS OF NETWORK SECURITY MARKET FOR ANTIVIRUS, 2019 & 2027 (%)
FIGURE 19 COMPARATIVE SHARE ANALYSIS OF NETWORK SECURITY MARKET FOR NETWORK ACCESS CONTROL, 2019 & 2027 (%)
FIGURE 20 COMPARATIVE SHARE ANALYSIS OF NETWORK SECURITY MARKET FOR DATA LOSS PREVENTION, 2019 & 2027 (%)
FIGURE 21 COMPARATIVE SHARE ANALYSIS OF NETWORK SECURITY MARKET FOR IDS/IPS, 2019 & 2027 (%)
FIGURE 22 COMPARATIVE SHARE ANALYSIS OF NETWORK SECURITY MARKET FOR SECURE WEB GATEWAYS, 2019 & 2027 (%)
FIGURE 23 COMPARATIVE SHARE ANALYSIS OF NETWORK SECURITY MARKET FOR DDOS MITIGATION, 2019 & 2027 (%)
FIGURE 24 COMPARATIVE SHARE ANALYSIS OF NETWORK SECURITY MARKET FOR UNIFIED THREAT MANAGEMENT, 2019 & 2027 (%)
FIGURE 25 COMPARATIVE SHARE ANALYSIS OF NETWORK SECURITY MARKET FOR OTHERS, 2019 & 2027 (%)
FIGURE 26 COMPARATIVE SHARE ANALYSIS OF NETWORK SECURITY MARKET FOR SERVICES, 2019 & 2027 (%)
FIGURE 27 COMPARATIVE SHARE ANALYSIS OF NETWORK SECURITY MARKET FOR PROFESSIONAL SERVICES, 2019 & 2027 (%)
FIGURE 28 COMPARATIVE SHARE ANALYSIS OF NETWORK SECURITY MARKET FOR MANAGED SERVICES, 2019 & 2027 (%)
FIGURE 29 NETWORK SECURITY MARKET, BY DEPLOYMENT MODEL, 2019–2027 ($MILLION)
FIGURE 30 COMPARATIVE SHARE ANALYSIS OF NETWORK SECURITY MARKET FOR ON-PREMISE SEGMENT, BY COUNTRY, 2019 & 2027 (%)
FIGURE 31 COMPARATIVE SHARE ANALYSIS OF NETWORK SECURITY MARKET FOR CLOUD SEGMENT, BY COUNTRY, 2019 & 2027 (%)
FIGURE 32 NETWORK SECURITY MARKET, BY ORGANIZATION SIZE, 2019–2027 ($MILLION)
FIGURE 33 COMPARATIVE SHARE ANALYSIS OF NETWORK SECURITY MARKET FOR LARGE ENTERPRISE, BY COUNTRY, 2019 & 2027 (%)
FIGURE 34 COMPARATIVE SHARE ANALYSIS OF NETWORK SECURITY MARKET FOR SMALL AND MEDIUM ENTERPRISE, BY COUNTRY, 2019 & 2027 (%)
FIGURE 35 NETWORK SECURITY MARKET, BY INDUSTRY VERTICAL, 2019–2027 ($MILLION)
FIGURE 36 COMPARATIVE SHARE ANALYSIS OF NETWORK SECURITY MARKET FOR AEROSPACE AND DEFENSE, BY COUNTRY, 2019 & 2027 (%)
FIGURE 37 COMPARATIVE SHARE ANALYSIS OF NETWORK SECURITY MARKET FOR GOVERNMENT, BY COUNTRY, 2019 & 2027 (%)
FIGURE 38 COMPARATIVE SHARE ANALYSIS OF NETWORK SECURITY MARKET FOR BFSI, BY COUNTRY, 2019 & 2027 (%)
FIGURE 39 COMPARATIVE SHARE ANALYSIS OF NETWORK SECURITY MARKET FOR IT AND TELECOM, BY COUNTRY, 2019 & 2027 (%)
FIGURE 40 COMPARATIVE SHARE ANALYSIS OF NETWORK SECURITY MARKET FOR HEALTHCARE, BY COUNTRY, 2019 & 2027 (%)
FIGURE 41 COMPARATIVE SHARE ANALYSIS OF NETWORK SECURITY MARKET FOR RETAIL, BY COUNTRY, 2019 & 2027 (%)
FIGURE 42 COMPARATIVE SHARE ANALYSIS OF NETWORK SECURITY MARKET FOR MANUFACTURING, BY COUNTRY, 2019 & 2027 (%)
FIGURE 43 COMPARATIVE SHARE ANALYSIS OF NETWORK SECURITY MARKET FOR ENERGY AND UTILITIES, BY COUNTRY, 2019 & 2027 (%)
FIGURE 44 COMPARATIVE SHARE ANALYSIS OF NETWORK SECURITY MARKET FOR OTHERS, BY COUNTRY, 2019 & 2027 (%)
FIGURE 45 U.S. NETWORK SECURITY MARKET, 2019–2027 ($MILLION)
FIGURE 46 CANADA NETWORK SECURITY MARKET, 2019–2027 ($MILLION)
FIGURE 47 GERMANY NETWORK SECURITY MARKET, 2019–2027 ($MILLION)
FIGURE 48 FRANCE NETWORK SECURITY MARKET, 2019–2027 ($MILLION)
FIGURE 49 UK NETWORK SECURITY MARKET, 2019–2027 ($MILLION)
FIGURE 50 SPAIN NETWORK SECURITY MARKET, 2019–2027 ($MILLION)
FIGURE 51 ITALY NETWORK SECURITY MARKET, 2019–2027 ($MILLION)
FIGURE 52 REST OF EUROPE NETWORK SECURITY MARKET, 2019–2027 ($MILLION)
FIGURE 53 JAPAN NETWORK SECURITY MARKET, 2019–2027 ($MILLION)
FIGURE 54 CHINA NETWORK SECURITY MARKET, 2019–2027 ($MILLION)
FIGURE 55 AUSTRALIA NETWORK SECURITY MARKET, 2019–2027 ($MILLION)
FIGURE 56 INDIA NETWORK SECURITY MARKET, 2019–2027 ($MILLION)
FIGURE 57 SOUTH KOREA NETWORK SECURITY MARKET, 2019–2027 ($MILLION)
FIGURE 58 REST OF ASIA-PACIFIC NETWORK SECURITY MARKET, 2019–2027 ($MILLION)
FIGURE 59 LATIN AMERICA NETWORK SECURITY MARKET, 2019–2027 ($MILLION)
FIGURE 60 MIDDLE EAST NETWORK SECURITY MARKET, 2019–2027 ($MILLION)
FIGURE 61 AFRICA NETWORK SECURITY MARKET, 2019–2027 ($MILLION)
FIGURE 62 KEY PLAYER POSITIONING ANALYSIS: GLOBAL NETWORK SECURITY MARKET
FIGURE 63 TOP WINNING STRATEGIES, BY YEAR, 2019–2020
FIGURE 64 TOP WINNING STRATEGIES, BY DEVELOPMENT, 2019 –2020
FIGURE 65 TOP WINNING STRATEGIES, BY COMPANY, 2019–2020
FIGURE 66 CISCO SYSTEMS: REVENUE, 2018–2020 ($MILLION)
FIGURE 67 CISCO SYSTEMS: REVENUE SHARE BY SEGMENT, 2020
FIGURE 68 CISCO SYSTEMS: REVENUE SHARE BY REGION, 2020
FIGURE 69 IBM, R&D EXPENDITURE, 2018–2020 ($MILLION)
FIGURE 70 IBM: REVENUE, 2018–2020 ($MILLION)
FIGURE 71 IBM: REVENUE SHARE BY SEGMENT, 2020(%)
FIGURE 72 SYMANTEC: REVENUE, 2017–2019 ($MILLION)
FIGURE 73 SYMANTEC: REVENUE SHARE BY SEGMENT, 2019 (%)
FIGURE 74 SYMANTEC: REVENUE SHARE BY REGION, 2019 (%)
FIGURE 75 JUNIPER NETWORKS: REVENUE, 2017–2019 ($MILLION)
FIGURE 76 JUNIPER NETWORKS: REVENUE SHARE BY SEGMENT, 2019 (%)
FIGURE 77 JUNIPER NETWORKS: REVENUE SHARE BY REGION, 2019 (%)
FIGURE 78 AVAST SOFTWARE: REVENUE, 2017–2019 ($MILLION)
$5769
$6450
$9995
HAVE A QUERY?
OUR CUSTOMER
