
The microgreens market size was valued at $1,276.0 million in 2019, and is estimated to reach $2,049.3 million by 2028, registering a CAGR of 11.1% from 2021 to 2028. Microgreens are young, tender vegetable greens that are approximately 1-3 inches tall. They are harvested 7-14 days after germination, when they have two fully developed cotyledon leaves. Often called vegetable confetti. Microgreens are basically used to enhance the color, texture, or flavor of different foods such as pasta, pizza, omelets, and salads, due to their intense aromatic flavor and variety of colors and textures. They constitute a number of vitamins, minerals, and antioxidants.
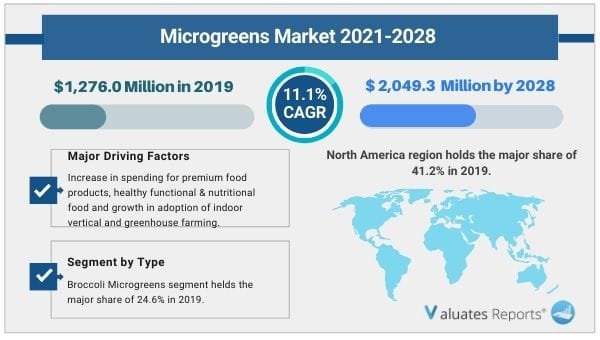
Increase in spending for premium food products, healthy functional & nutritional food and growth in adoption of indoor vertical and greenhouse farming are some of the factors driving the microgreens market growth during the forecast period. Indoor vertical and greenhouse farming is majorly used for the production of microgreens as it requires intense care through a controlled environment. Furthermore, growth in cosmetics and personal care industry is likely to drive the growth of the product market during the forecast period, as microgreens-based oils and ingredients are majorly demanded for the production of consumer items such as shampoo and skincare products. Rise in adoption of farm mechanization and growth in awareness regarding the high-tech farming methods including hydroponics, aeroponics and aquaponics are expected to favor the growth of the microgreens market.
The outbreak of the COVID-19 pandemic has negatively affected the growth of the microgreens market. Sales of microgreens have witnessed significant decrease due to disturbed supply chain and closers of restaurants and grocery stores, which are vital distributing points and end users of the microgreens.
According to microgreens market analysis, the market is segmented on the basis of type, farming, distribution channel, end user, and region. On the basis of type, the market is categorized into broccoli, cabbage, cauliflower, arugula, peas, basil, radish, cress and others. By farming, it is segregated into indoor vertical farming, commercial greenhouses and others. According to distribution channel, it is divided into retail stores, farmers market and others. By end user, market is segmented into residential and commercial. Region wise, it is analyzed across North America (the U.S., Canada, and Mexico), Europe (Russia, Spain, Italy, France, Germany, UK, Rest of Europe), Asia-Pacific (China, Japan, India, South Korea, Australia and Rest of Asia-Pacific), and LAMEA (Latin America, Middle East, Africa)
On the basis of type, the broccoli segment has been gaining major share in the global microgreens market and is expected to sustain its share during the forecast period. This is majorly attributed to health benefits associated with broccoli microgreens such as fighting inflammation, cancer prevention, improved heart health, and improved digestion. Broccoli microgreens rich dark greens are a great addition to any mix due to their tangy flavor. Growth in health-conscious people and awareness regarding health benefits of the broccoli microgreens are likely to surge the growth of the global microgreens market though broccoli microgreens segment.
By Type - Broccoli Microgreens segment helds the major share of 24.6% in 2019
According to microgreens market trends, depending on farming, the vertical farming segment was valued at $752.9 million in 2019, and is expected to reach $1,221.9 million by 2028, with a CAGR of 11.2%.
Indoor vertical farming is cultivation of the agriculture produce in controlled environment such as in building, where crops are provided with required environment such as temperature, light, appropriate water, and growth medium. This farming method has been gaining major traction in the global product market as it allows growers take production in any season and it increase the productivity of land. According to the United Nations, the world population is expected to reach 9.8 billion by 2050 and it is not possible to fulfill the food demand with conventional farming methods. Currently, agriculture production is decreasing day-by-day, owing to decreasing fertility of agriculture land and depletion of natural resources.
By Farming - Indoor Vertical Farming segment helds the major share of 59.0% in 2019
On the basis of distribution channel, the retail store segment is projected to grow at $986.3 million by 2028, registering a CAGR of 11.4%. Supermarket/hypermarkets and grocery stores are where people can find fresh microgreens. Furthermore, increase in demand for microgreens for household consumption and growth in awareness regarding the recipes that include microgreens in home are likely to drive the growth of the product market through retail stores. Furthermore, online retail stores are gaining significant popularity where people can order microgreens according to their daily need.
By Distribution Channel - Retail Stores segment helds the major share of 46.8% in 2019
On the basis of end user, the commercial segment is projected to grow at $1,408.8 million by 2028, registering a CAGR of 10.4%. Microgreens are majorly served to customers though the restaurants as people are increasingly demanding highly nutritious food. Chefs in the restaurants use microgreens as flavoring and garnishing agent, owing to its tasty flavor and crunchy texture. Microgreens are used to enhance the nutritional value, flavor, and texture of the pastas, omelet, pizzas, burgers, and salads. Furthermore, owing to rich sources of mineral and vitamins, it is used in the skin care and cosmetic products.
By End User - Commercial segment helds the major share of 72.5% in 2019
Region wise, North America dominated the microgreens market in 2019, and is expected to sustain its dominance throughout the microgreens market forecast period. U.S. has been gaining major share in North America market and is expected to sustain its share during the forecast period. Rise and evolution of wellness focused diets, which include green vegetables salad and organic-based food items is expected to attract people toward the microgreens. In the U.S., the demand for microgreens is witnessing growth at a significant rate, owing to health benefits associated with its consumption such as reduce risk of heart diseases, chronic diseases, cancer, and Alzheimer. Consumers are increasingly opting for high protein consumption, resulting in strong requirement of high protein and low carb food products. Thus, vegetable growers are focusing on cultivation of microgreens along with vegetables and increasing area under protected cultivation. For instance, according to the FAO 2017 and Hickman 2019, the area under protected cultivation in the U.S. is 15,000 ha, which is majorly used for growing tomato, herbs, cucumber, capsicum, and strawberry. Furthermore, area under protected cultivation in Mexico is 40,862 ha. Thus, growing area under protected cultivation in North America is expected to favor the growth of the product market during the forecast period.
By Region - North America region holds the major share of 41.2% in 2019
The players operating in the global microgreens market have adopted various developmental strategies to expand their microgreens market share, increase profitability, and remain competitive in the market. The key players profiled in this report include AeroFarms, Fresh Origins, Gotham Greens, Madar Farms, 2BFresh, The Chef's Garden Inc., Farmbox Greens LLC, Living Earth Farm, GoodLeaf Farms, and Bowery Farming.
|
Report Metric |
Details |
|
Report Name |
Microgreens Market Report |
|
The Market size value in 2019 |
1,276.0 Million USD |
|
The Revenue forecast in 2028 |
2,049.3 Million USD |
|
Growth Rate |
CAGR of 11.1% from 2020 to 2027 |
|
Base year considered |
2019 |
|
Forecast period |
2021-2028 |
|
Forecast units |
Value (USD) |
|
Segments covered |
Type, End-User, Offerings, and Region |
|
Report coverage |
Revenue & volume forecast, company share, competitive landscape, growth factors, and trends |
|
Geographic regions covered |
North America, Europe, Asia Pacific, Latin America, Middle East & Africa |
|
Companies covered |
AeroFarms, Fresh Origins, Gotham Greens, Madar Farms, 2BFresh, The Chef's Garden Inc., Farmbox Greens LLC, Living Earth Farm, GoodLeaf Farms, and Bowery Farming. |
Ans. The microgreens market size was valued at $1,276.0 million in 2019, and is estimated to reach $2,049.3 million by 2028.
Ans. The microgreens market is expected to grow at a compound annual growth rate of 11.1% from 2021 to 2028.
Ans. Some of the major companies are AeroFarms, Fresh Origins, Gotham Greens, Madar Farms, 2BFresh, The Chef's Garden Inc., Farmbox Greens LLC, Living Earth Farm, GoodLeaf Farms, and Bowery Farming.
CHAPTER 1:INTRODUCTION
1.1.Report description
1.2.Key benefits for stakeholders
1.3.Key market segments
1.4.Research methodology
1.4.1.Secondary research
1.4.2.Primary research
1.4.3.Analyst tools and models
CHAPTER 2:EXECUTIVE SUMMARY
2.1.Key findings of the study
2.2.CXO perspective
CHAPTER 3:MARKET OVERVIEW
3.1.Market definition and scope
3.2.Key findings
3.2.1.Top investment pockets
3.3.Value chain analysis
3.4.Porter’s five forces analysis
3.5.Market dynamics
3.5.1.Drivers
3.5.1.1.Rise in demand for indoor cultivation
3.5.1.2.Microgreens - untapped potential market
3.5.1.3.Rise in use of advanced technology in farming practices
3.5.1.4.Changes in lifestyle and food habits
3.5.2.Restraints
3.5.2.1.Lack of skilled workforce and limited microgreens crop range
3.5.2.2.High initial investments
3.5.3.Opportunities
3.5.3.1.Increase in purchasing power
3.5.3.2.Rapid growth of the retail sector and online stores
3.6.Pricing analysis
3.7.Market share analysis
3.7.1.By type
3.7.2.By farming
3.7.3.By distribution channel
3.7.4.By end user
3.7.5.By region
3.8.Impact of COVID-19 on the microgreens market
CHAPTER 4:MICROGREENS MARKET, BY TYPE
4.1.Overview
4.1.1.Market size and forecast
4.2.Broccoli
4.2.1.Key market trends, growth factors, and opportunities
4.2.2.Market size and forecast
4.3.Cabbage
4.3.1.Key market trends, growth factors, and opportunities
4.3.2.Market size and forecast
4.4.Cauliflower
4.4.1.Key market trends, growth factors, and opportunities
4.4.2.Market size and forecast
4.5.Arugula
4.5.1.Key market trends, growth factors, and opportunities
4.5.2.Market size and forecast
4.6.Peas
4.6.1.Key market trends, growth factors, and opportunities
4.6.2.Market size and forecast
4.7.Basil
4.7.1.Key market trends, growth factors, and opportunities
4.7.2.Market size and forecast
4.8.Radish
4.8.1.Key market trends, growth factors, and opportunities
4.8.2.Market size and forecast
4.9.Cress
4.9.1.Key market trends, growth factors, and opportunities
4.9.2.Market size and forecast
4.10.Others
4.10.1.Key market trends, growth factors, and opportunities
4.10.2.Market size and forecast
CHAPTER 5:MICROGREENS MARKET, BY FARMING
5.1.Overview
5.1.1.Market size and forecast
5.2.Indoor vertical farming
5.2.1.Key market trends, growth factors, and opportunities
5.2.2.Market size and forecast
5.3.Commercial greenhouse
5.3.1.Key market trends, growth factors, and opportunities
5.3.2.Market size and forecast
5.4.Others
5.4.1.Key market trends, growth factors, and opportunities
5.4.2.Market size and forecast
CHAPTER 6:MICROGREENS MARKET, BY DISTRIBUTION CHANNEL
6.1.Overview
6.1.1.Market size and forecast
6.2.Retail store
6.2.1.Key market trends, growth factors, and opportunities
6.2.2.Market size and forecast
6.3.Farmers market
6.3.1.Key market trends, growth factors, and opportunities
6.3.2.Market size and forecast
6.4.Others
6.4.1.Key market trends, growth factors, and opportunities
6.4.2.Market size and forecast
CHAPTER 7:MICROGREENS MARKET, BY END USER
7.1.Overview
7.1.1.Market size and forecast
7.2.Residential
7.2.1.Key market trends, growth factors, and opportunities
7.2.2.Market size and forecast
7.3.Commercial
7.3.1.Key market trends, growth factors, and opportunities
7.3.2.Market size and forecast
CHAPTER 8:MICROGREENS MARKET, BY REGION
8.1.Overview
8.1.1.Market size and forecast, by region
8.2.North America
8.2.1.Key market trends, growth factors, and opportunities
8.2.2.Market size and forecast, by type
8.2.3.Market size and forecast, by farming
8.2.4.Market size and forecast, by distribution channel
8.2.5.Market size and forecast, by end user
8.2.6.Market size and forecast, by country
8.2.6.1.U.S.
8.2.6.1.1.Market size and forecast, by type
8.2.6.1.2.Market size and forecast, by farming
8.2.6.1.3.Market size and forecast, by distribution channel
8.2.6.1.4.Market size and forecast, by end user
8.2.6.2.Canada
8.2.6.2.1.Market size and forecast, by type
8.2.6.2.2.Market size and forecast, by farming
8.2.6.2.3.Market size and forecast, by distribution channel
8.2.6.2.4.Market size and forecast, by end user
8.2.6.3.Mexico
8.2.6.3.1.Market size and forecast, by type
8.2.6.3.2.Market size and forecast, by farming
8.2.6.3.3.Market size and forecast, by distribution channel
8.2.6.3.4.Market size and forecast, by end user
8.3.Europe
8.3.1.Key market trends, growth factors, and opportunities
8.3.2.Market size and forecast, by type
8.3.3.Market size and forecast, by farming
8.3.4.Market size and forecast, by distribution channel
8.3.5.Market size and forecast, by end user
8.3.6.Market size and forecast, by country
8.3.6.1.Russia
8.3.6.1.1.Market size and forecast, by type
8.3.6.1.2.Market size and forecast, by farming
8.3.6.1.3.Market size and forecast, by distribution channel
8.3.6.1.4.Market size and forecast, by end user
8.3.6.2.Spain
8.3.6.2.1.Market size and forecast, by type
8.3.6.2.2.Market size and forecast, by farming
8.3.6.2.3.Market size and forecast, by distribution channel
8.3.6.2.4.Market size and forecast, by end user
8.3.6.3.Italy
8.3.6.3.1.Market size and forecast, by type
8.3.6.3.2.Market size and forecast, by farming
8.3.6.3.3.Market size and forecast, by distribution channel
8.3.6.3.4.Market size and forecast, by end user
8.3.6.4.France
8.3.6.4.1.Market size and forecast, by type
8.3.6.4.2.Market size and forecast, by farming
8.3.6.4.3.Market size and forecast, by distribution channel
8.3.6.4.4.Market size and forecast, by end user
8.3.6.5.Germany
8.3.6.5.1.Market size and forecast, by type
8.3.6.5.2.Market size and forecast, by farming
8.3.6.5.3.Market size and forecast, by distribution channel
8.3.6.5.4.Market size and forecast, by end user
8.3.6.6.UK
8.3.6.6.1.Market size and forecast, by type
8.3.6.6.2.Market size and forecast, by farming
8.3.6.6.3.Market size and forecast, by distribution channel
8.3.6.6.4.Market size and forecast, by end user
8.3.6.7.Netherlands
8.3.6.7.1.Market size and forecast, by type
8.3.6.7.2.Market size and forecast, by farming
8.3.6.7.3.Market size and forecast, by distribution channel
8.3.6.7.4.Market size and forecast, by end user
8.3.6.8.Rest of Europe
8.3.6.8.1.Market size and forecast, by type
8.3.6.8.2.Market size and forecast, by farming
8.3.6.8.3.Market size and forecast, by distribution channel
8.3.6.8.4.Market size and forecast, by end user
8.4.Asia-Pacific
8.4.1.Key market trends, growth factors, and opportunities
8.4.2.Market size and forecast, by type
8.4.3.Market size and forecast, by farming
8.4.4.Market size and forecast, by distribution channel
8.4.5.Market size and forecast, by end user
8.4.6.Market size and forecast, by country
8.4.6.1.China
8.4.6.1.1.Market size and forecast, by type
8.4.6.1.2.Market size and forecast, by farming
8.4.6.1.3.Market size and forecast, by distribution channel
8.4.6.1.4.Market size and forecast, by end user
8.4.6.2.Japan
8.4.6.2.1.Market size and forecast, by type
8.4.6.2.2.Market size and forecast, by farming
8.4.6.2.3.Market size and forecast, by distribution channel
8.4.6.2.4.Market size and forecast, by end user
8.4.6.3.India
8.4.6.3.1.Market size and forecast, by type
8.4.6.3.2.Market size and forecast, by farming
8.4.6.3.3.Market size and forecast, by distribution channel
8.4.6.3.4.Market size and forecast, by end user
8.4.6.4.South Korea
8.4.6.4.1.Market size and forecast, by type
8.4.6.4.2.Market size and forecast, by farming
8.4.6.4.3.Market size and forecast, by distribution channel
8.4.6.4.4.Market size and forecast, by end user
8.4.6.5.Australia
8.4.6.5.1.Market size and forecast, by type
8.4.6.5.2.Market size and forecast, by farming
8.4.6.5.3.Market size and forecast, by distribution channel
8.4.6.5.4.Market size and forecast, by end user
8.4.6.6.Rest of Asia-Pacific
8.4.6.6.1.Market size and forecast, by type
8.4.6.6.2.Market size and forecast, by farming
8.4.6.6.3.Market size and forecast, by distribution channel
8.4.6.6.4.Market size and forecast, by end user
8.5.LAMEA
8.5.1.Key market trends, growth factors, and opportunities
8.5.2.Market size and forecast, by type
8.5.3.Market size and forecast, by farming
8.5.4.Market size and forecast, by distribution channel
8.5.5.Market size and forecast, by end user
8.5.6.Market size and forecast, by country
8.5.6.1.Latin America
8.5.6.1.1.Market size and forecast, by type
8.5.6.1.2.Market size and forecast, by farming
8.5.6.1.3.Market size and forecast, by distribution channel
8.5.6.1.4.Market size and forecast, by end user
8.5.6.2.Middle East
8.5.6.2.1.Market size and forecast, by type
8.5.6.2.2.Market size and forecast, by farming
8.5.6.2.3.Market size and forecast, by distribution channel
8.5.6.2.4.Market size and forecast, by end user
8.5.6.3.Africa
8.5.6.3.1.Market size and forecast, by type
8.5.6.3.2.Market size and forecast, by farming
8.5.6.3.3.Market size and forecast, by distribution channel
8.5.6.3.4.Market size and forecast, by end user
CHAPTER 9:COMPETITION LANDSCAPE
9.1.Top winning strategies
9.2.Product mapping
9.3.Competitive dashboard
9.4.Competitive heat map
9.5.Key developments
9.5.1.Acquisition
9.5.2.Business Expansion
9.5.3.Agreement
9.5.4.Product Launch
CHAPTER 10:COMPANY PROFILES
10.1.AeroFarms
10.1.1.Company overview
10.1.2.Key Executives
10.1.3.Company snapshot
10.1.4.Product portfolio
10.1.5.Key strategic moves and developments
10.2.Fresh Origins
10.2.1.Company overview
10.2.2.Key Executives
10.2.3.Company snapshot
10.2.4.Product portfolio
10.3.Gotham Greens
10.3.1.Company overview
10.3.2.Key Executives
10.3.3.Company snapshot
10.3.4.Product portfolio
10.3.5.Key strategic moves and developments
10.4.Madar Farms
10.4.1.Company overview
10.4.2.Key Executives
10.4.3.Company snapshot
10.4.4.Product portfolio
10.4.5.Key strategic moves and developments
10.5.2BFresh
10.5.1.Company overview
10.5.2.Key Executives
10.5.3.Company snapshot
10.5.4.Product portfolio
10.5.5.Key strategic moves and developments
10.6.The Chef's Garden Inc.
10.6.1.Company overview
10.6.2.Key Executives
10.6.3.Company snapshot
10.6.4.Product portfolio
10.6.5.Key strategic moves and developments
10.7.Farmbox Greens LLC
10.7.1.Company overview
10.7.2.Key Executives
10.7.3.Company snapshot
10.7.4.Product portfolio
10.8.Living Earth Farm
10.8.1.Company overview
10.8.2.Key Executives
10.8.3.Company snapshot
10.8.4.Product portfolio
10.9.GoodLeaf Farms
10.9.1.Company overview
10.9.2.Key Executives
10.9.3.Company snapshot
10.9.4.Product portfolio
10.9.5.Key strategic moves and developments
10.10.Bowery Farming
10.10.1.Company overview
10.10.2.Key Executives
10.10.3.Company snapshot
10.10.4.Product portfolio
10.10.5.Key strategic moves and developments
LIST OF TABLES
TABLE 01.MICROGREENS MARKET, BY TYPE, 2019–2028 ($MILLION)
TABLE 02.MICROGREENS MARKET, BY TYPE, 2019–2028 (IN OUNCE)
TABLE 03.BROCCOLI MICROGREENS MARKET, BY REGION, 2019–2028 ($MILLION)
TABLE 04.CABBAGE MICROGREENS MARKET, BY REGION, 2019–2028 ($MILLION)
TABLE 05.CAULIFLOWER MICROGREENS MARKET, BY REGION, 2019–2028 ($MILLION)
TABLE 06.ARUGULA MICROGREENS MARKET, BY REGION, 2019–2028 ($MILLION)
TABLE 07.PEAS MICROGREENS MARKET, BY REGION, 2019–2028 ($MILLION)
TABLE 08.BASIL MICROGREENS MARKET, BY REGION, 2019–2028 ($MILLION)
TABLE 09.RADISH MICROGREENS MARKET, BY REGION, 2019–2028 ($MILLION)
TABLE 10.CARROTS MICROGREENS MARKET, BY REGION, 2019–2028 ($MILLION)
TABLE 11.OTHERS MICROGREENS MARKET, BY REGION, 2019–2028 ($MILLION)
TABLE 12.GLOBAL MICROGREENS MARKET, BY FARMING, 2019–2028 ($MILLION)
TABLE 13.INDOOR VERTICAL FARMING FOR MICROGREENS MARKET, BY REGION, 2019–2028 ($MILLION)
TABLE 14.COMMERCIAL GREENHOUSE FOR MICROGREENS MARKET, BY REGION, 2019–2028 ($MILLION)
TABLE 15.OTHERS FORMAING TYPES FOR MICROGREENS MARKET, BY REGION, 2019–2028 ($MILLION)
TABLE 16.MICROGREENS MARKET, BY DISTRIBUTION CHANNEL, 2019–2028 ($MILLION)
TABLE 17.MICROGREENS MARKET FOR RETAIL STORE, BY REGION, 2019–2028 ($MILLION)
TABLE 18.MICROGREENS MARKET FOR FARMERS MARKET, BY REGION, 2019–2028 ($MILLION)
TABLE 19.MICROGREENS MARKET FOR OTHER DISTRIBUTION CHANNELS, BY REGION, 2019–2028 ($MILLION)
TABLE 20.MICROGREENS MARKET, BY END USER, 2019–2028 ($MILLION)
TABLE 21.MICROGREENS MARKET FOR RESIDENTIAL, BY REGION, 2019–2028 ($MILLION)
TABLE 22.MICROGREENS MARKET FOR COMMERCIAL, BY REGION, 2019–2028 ($MILLION)
TABLE 23.MICROGREENS MARKET, BY REGION, 2019–2028 ($MILLION)
TABLE 24.NORTH AMERICA MICROGREENS MARKET, BY TYPE, 2019–2028 ($MILLION)
TABLE 25.NORTH AMERICA MICROGREENS MARKET, BY FARMING, 2019–2028 ($MILLION)
TABLE 26.NORTH AMERICA MICROGREENS MARKET, BY DISTRIBUTION CHANNEL, 2019–2028 ($MILLION)
TABLE 27.NORTH AMERICA MICROGREENS MARKET, BY END USER, 2019–2028 ($MILLION)
TABLE 28.NORTH AMERICA MICROGREENS MARKET, BY COUNTRY, 2019–2028 ($MILLION)
TABLE 29.U.S. MICROGREENS MARKET, BY TYPE, 2019–2028 ($MILLION)
TABLE 30.U.S MICROGREENS MARKET, BY FARMING, 2019–2028 ($MILLION)
TABLE 31.U.S. MICROGREENS MARKET, BY DISTRIBUTION CHANNEL, 2019–2028 ($MILLION)
TABLE 32.U.S MICROGREENS MARKET, BY END USER, 2019–2028 ($MILLION)
TABLE 33.CANADA MICROGREENS MARKET, BY TYPE, 2019–2028 ($MILLION)
TABLE 34.CANADA MICROGREENS MARKET, BY FARMING, 2019–2028 ($MILLION)
TABLE 35.CANADA MICROGREENS MARKET, BY DISTRIBUTION CHANNEL, 2019–2028 ($MILLION)
TABLE 36.CANADA MICROGREENS MARKET, BY END USER, 2019–2028 ($MILLION)
TABLE 37.MEXICO MICROGREENS MARKET, BY TYPE, 2019–2028 ($MILLION)
TABLE 38.MEXICO MICROGREENS MARKET, BY FARMING, 2019–2028 ($MILLION)
TABLE 39.MEXICO MICROGREENS MARKET, BY DISTRIBUTION CHANNEL, 2019–2028 ($MILLION)
TABLE 40.MEXICO MICROGREENS MARKET, BY END USER, 2019–2028 ($MILLION)
TABLE 41.EUROPE MICROGREENS MARKET, BY TYPE, 2019–2028 ($MILLION)
TABLE 42.EUROPE MICROGREENS MARKET, BY FARMING, 2019–2028 ($MILLION)
TABLE 43.EUROPE MICROGREENS MARKET, BY DISTRIBUTION CHANNEL, 2019–2028 ($MILLION)
TABLE 44.EUROPE MICROGREENS MARKET, BY END USER, 2019–2028 ($MILLION)
TABLE 45.EUROPE MICROGREENS MARKET, BY COUNTRY, 2019–2028 ($MILLION)
TABLE 46.RUSSIA MICROGREENS MARKET, BY TYPE, 2019–2028 ($MILLION)
TABLE 47.RUSSIA MICROGREENS MARKET, BY FARMING, 2019–2028 ($MILLION)
TABLE 48.RUSSIA MICROGREENS MARKET, BY DISTRIBUTION CHANNEL, 2019–2028 ($MILLION)
TABLE 49.RUSSIA MICROGREENS MARKET, BY END USER, 2019–2028 ($MILLION)
TABLE 50.SPAIN MICROGREENS MARKET, BY TYPE, 2019–2028 ($MILLION)
TABLE 51.SPAIN MICROGREENS MARKET, BY FARMING, 2019–2028 ($MILLION)
TABLE 52.SPAIN MICROGREENS MARKET, BY DISTRIBUTION CHANNEL, 2019–2028 ($MILLION)
TABLE 53.SPAIN MICROGREENS MARKET, BY END USER, 2019–2028 ($MILLION)
TABLE 54.ITALY MICROGREENS MARKET, BY TYPE, 2019–2028 ($MILLION)
TABLE 55.ITALY MICROGREENS MARKET, BY FARMING, 2019–2028 ($MILLION)
TABLE 56.ITALY MICROGREENS MARKET, BY DISTRIBUTION CHANNEL, 2019–2028 ($MILLION)
TABLE 57.ITALY MICROGREENS MARKET, BY END USER, 2019–2028 ($MILLION)
TABLE 58.FRANCE MICROGREENS MARKET, BY TYPE, 2019–2028 ($MILLION)
TABLE 59.FRANCE MICROGREENS MARKET, BY FARMING, 2019–2028 ($MILLION)
TABLE 60.FRANCE MICROGREENS MARKET, BY DISTRIBUTION CHANNEL, 2019–2028 ($MILLION)
TABLE 61.FRANCE MICROGREENS MARKET, BY END USER, 2019–2028 ($MILLION)
TABLE 62.GERMANY MICROGREENS MARKET, BY TYPE, 2019–2028 ($MILLION)
TABLE 63.GERMANY MICROGREENS MARKET, BY FARMING, 2019–2028 ($MILLION)
TABLE 64.GERMANY MICROGREENS MARKET, BY DISTRIBUTION CHANNEL, 2019–2028 ($MILLION)
TABLE 65.GERMANY MICROGREENS MARKET, BY END USER, 2019–2028 ($MILLION)
TABLE 66.UK MICROGREENS MARKET, BY TYPE, 2019–2028 ($MILLION)
TABLE 67.UK MICROGREENS MARKET, BY FARMING, 2019–2028 ($MILLION)
TABLE 68.UK MICROGREENS MARKET, BY DISTRIBUTION CHANNEL, 2019–2028 ($MILLION)
TABLE 69.UK MICROGREENS MARKET, BY END USER, 2019–2028 ($MILLION)
TABLE 70.NETHERLANDS MICROGREENS MARKET, BY TYPE, 2019–2028 ($MILLION)
TABLE 71.NETHERLANDS MICROGREENS MARKET, BY FARMING, 2019–2028 ($MILLION)
TABLE 72.NETHERLANDS MICROGREENS MARKET, BY DISTRIBUTION CHANNEL, 2019–2028 ($MILLION)
TABLE 73.NETHERLANDS MICROGREENS MARKET, BY END USER, 2019–2028 ($MILLION)
TABLE 74.REST OF EUROPE MICROGREENS MARKET, BY TYPE, 2019–2028 ($MILLION)
TABLE 75.REST OF EUROPE MICROGREENS MARKET, BY FARMING, 2019–2028 ($MILLION)
TABLE 76.REST OF EUROPE MICROGREENS MARKET, BY DISTRIBUTION CHANNEL, 2019–2028 ($MILLION)
TABLE 77.REST OF EUROPE MICROGREENS MARKET, BY END USER, 2019–2028 ($MILLION)
TABLE 78.ASIA-PACIFIC MICROGREENS MARKET, BY TYPE, 2019–2028 ($MILLION)
TABLE 79.ASIA-PACIFIC MICROGREENS MARKET, BY FARMING, 2019–2028 ($MILLION)
TABLE 80.ASIA-PACIFIC MICROGREENS MARKET, BY DISTRIBUTION CHANNEL, 2019–2028 ($MILLION)
TABLE 81.ASIA-PACIFIC MICROGREENS MARKET, BY END USER, 2019–2028 ($MILLION)
TABLE 82.ASIA-PACIFIC MICROGREENS MARKET, BY COUNTRY, 2019–2028 ($MILLION)
TABLE 83.CHINA MICROGREENS MARKET, BY TYPE, 2019–2028 ($MILLION)
TABLE 84.CHINA MICROGREENS MARKET, BY FARMING, 2019–2028 ($MILLION)
TABLE 85.CHINA MICROGREENS MARKET, BY DISTRIBUTION CHANNEL, 2019–2028 ($MILLION)
TABLE 86.CHINA MICROGREENS MARKET, BY END USER, 2019–2028 ($MILLION)
TABLE 87.JAPAN MICROGREENS MARKET, BY TYPE, 2019–2028 ($MILLION)
TABLE 88.JAPAN MICROGREENS MARKET, BY FARMING, 2019–2028 ($MILLION)
TABLE 89.JAPAN MICROGREENS MARKET, BY DISTRIBUTION CHANNEL, 2019–2028 ($MILLION)
TABLE 90.JAPAN MICROGREENS MARKET, BY END USER, 2019–2028 ($MILLION)
TABLE 91.INDIA MICROGREENS MARKET, BY TYPE, 2019–2028 ($MILLION)
TABLE 92.INDIA MICROGREENS MARKET, BY FARMING, 2019–2028 ($MILLION)
TABLE 93.INDIA MICROGREENS MARKET, BY DISTRIBUTION CHANNEL, 2019–2028 ($MILLION)
TABLE 94.INDIA MICROGREENS MARKET, BY END USER, 2019–2028 ($MILLION)
TABLE 95.SOUTH KOREA MICROGREENS MARKET, BY TYPE, 2019–2028 ($MILLION)
TABLE 96.SOUTH KOREA MICROGREENS MARKET, BY FARMING, 2019–2028 ($MILLION)
TABLE 97.SOUTH KOREA MICROGREENS MARKET, BY DISTRIBUTION CHANNEL, 2019–2028 ($MILLION)
TABLE 98.SOUTH KOREA MICROGREENS MARKET, BY END USER, 2019–2028 ($MILLION)
TABLE 99.AUSTRALIA MICROGREENS MARKET, BY TYPE, 2019–2028 ($MILLION)
TABLE 100.AUSTRALIA MICROGREENS MARKET, BY FARMING, 2019–2028 ($MILLION)
TABLE 101.AUSTRALIA MICROGREENS MARKET, BY DISTRIBUTION CHANNEL, 2019–2028 ($MILLION)
TABLE 102.AUSTRALIA MICROGREENS MARKET, BY END USER, 2019–2028 ($MILLION)
TABLE 103.REST OF ASIA-PACIFIC MICROGREENS MARKET, BY TYPE, 2019–2028 ($MILLION)
TABLE 104.REST OF ASIA-PACIFIC MICROGREENS MARKET, BY FARMING, 2019–2028 ($MILLION)
TABLE 105.REST OF ASIA-PACIFIC MICROGREENS MARKET, BY DISTRIBUTION CHANNEL, 2019–2028 ($MILLION)
TABLE 106.REST OF ASIA-PACIFIC MICROGREENS MARKET, BY END USER, 2019–2028 ($MILLION)
TABLE 107.LAMEA MICROGREENS MARKET, BY TYPE, 2019–2028 ($MILLION)
TABLE 108.LAMEA MICROGREENS MARKET, BY FARMING, 2019–2028 ($MILLION)
TABLE 109.LAMEA MICROGREENS MARKET, BY DISTRIBUTION CHANNEL, 2019–2028 ($MILLION)
TABLE 110.LAMEA MICROGREENS MARKET, BY END USER, 2019–2028 ($MILLION)
TABLE 111.LAMEA MICROGREENS MARKET, BY COUNTRY, 2019–2028 ($MILLION)
TABLE 112.LATIN AMERICA MICROGREENS MARKET, BY TYPE, 2019–2028 ($MILLION)
TABLE 113.LATIN AMERICA MICROGREENS MARKET, BY FARMING, 2019–2028 ($MILLION)
TABLE 114.LATIN AMERICA MICROGREENS MARKET, BY DISTRIBUTION CHANNEL, 2019–2028 ($MILLION)
TABLE 115.LATIN AMERICA MICROGREENS MARKET, BY END USER, 2019–2028 ($MILLION)
TABLE 116.MIDDLE EAST MICROGREENS MARKET, BY TYPE, 2019–2028 ($MILLION)
TABLE 117.MIDDLE EAST MICROGREENS MARKET, BY FARMING, 2019–2028 ($MILLION)
TABLE 118.MIDDLE EAST MICROGREENS MARKET, BY DISTRIBUTION CHANNEL, 2019–2028 ($MILLION)
TABLE 119.MIDDLE EAST MICROGREENS MARKET, BY END USER, 2019–2028 ($MILLION)
TABLE 120.AFRICA MICROGREENS MARKET, BY TYPE, 2019–2028 ($MILLION)
TABLE 121.AFRICA MICROGREENS MARKET, BY FARMING, 2019–2028 ($MILLION)
TABLE 122.AFRICA MICROGREENS MARKET, BY DISTRIBUTION CHANNEL, 2019–2028 ($MILLION)
TABLE 123.AFRICA MICROGREENS MARKET, BY END USER, 2019–2028 ($MILLION)
TABLE 124.AEROFARMS: KEY EXECUTIVES
TABLE 125.AEROFARMS: COMPANY SNAPSHOT
TABLE 126.AEROFARMS: PRODUCT PORTFOLIO
TABLE 127.FRESH ORIGINS: KEY EXECUTIVES
TABLE 128.FRESH ORIGINS: COMPANY SNAPSHOT
TABLE 129.FRESH ORIGINS: PRODUCT PORTFOLIO
TABLE 130.GOTHAM GREENS: KEY EXECUTIVES
TABLE 131.GOTHAM GREENS: COMPANY SNAPSHOT
TABLE 132.GOTHAM GREENS: PRODUCT PORTFOLIO
TABLE 133.MADAR FARMS: KEY EXECUTIVES
TABLE 134.MADAR FARMS: COMPANY SNAPSHOT
TABLE 135.MADAR FARMS: PRODUCT PORTFOLIO
TABLE 136.2BFRESH: KEY EXECUTIVES
TABLE 137.2BFRESH: COMPANY SNAPSHOT
TABLE 138.2BFRESH: PRODUCT PORTFOLIO
TABLE 139.THE CHEF'S GARDEN INC.: KEY EXECUTIVES
TABLE 140.THE CHEF'S GARDEN INC.: COMPANY SNAPSHOT
TABLE 141.THE CHEF'S GARDEN INC.: PRODUCT PORTFOLIO
TABLE 142.FARMBOX GREENS LLC: KEY EXECUTIVES
TABLE 143.FARMBOX GREENS LLC: COMPANY SNAPSHOT
TABLE 144.FARMBOX GREENS LLC: PRODUCT PORTFOLIO
TABLE 145.LIVING EARTH FARM: KEY EXECUTIVES
TABLE 146.LIVING EARTH FARM: COMPANY SNAPSHOT
TABLE 147.LIVING EARTH FARM: PRODUCT PORTFOLIO
TABLE 148.GOODLEAF FARMS: KEY EXECUTIVES
TABLE 149.GOODLEAF FARMS: COMPANY SNAPSHOT
TABLE 150.GOODLEAF FARMS: PRODUCT PORTFOLIO
TABLE 151.BOWERY FARMING: KEY EXECUTIVES
TABLE 152.BOWERY FARMING: COMPANY SNAPSHOT
TABLE 153.BOWERY FARMING: PRODUCT PORTFOLIO
LIST OF FIGURES
FIGURE 01.MICROGREENS MARKET SNAPSHOT
FIGURE 02.MICROGREENS MARKET: SEGMENTATION
FIGURE 03.TOP INVESTMENT POCKETS
FIGURE 04.VALUE CHAIN ANALYSIS
FIGURE 05.LOW BARGAINING POWER OF SUPPLIERS
FIGURE 06.HIGH BARGAINING POWER OF BUYERS
FIGURE 07.MODERATE THREAT OF SUBSTITUTION
FIGURE 08.LOW THREAT OF NEW ENTRANTS
FIGURE 09.LOW INTENSITY OF COMPETITIVE RIVALRY
FIGURE 10.MICROGREENS MARKET: DRIVERS, RESTRAINTS, AND OPPORTUNITIES
FIGURE 11.MICROGREENS MARKET, BY TYPE, 2019 (%)
FIGURE 12.COMPARATIVE SHARE ANALYSIS OF BROCCOLI MICROGREENS MARKET, BY COUNTRY 2019 & 2028 (%)
FIGURE 13.COMPARATIVE SHARE ANALYSIS OF CABBAGE MICROGREENS MARKET, BY COUNTRY 2019 & 2028 (%)
FIGURE 14.COMPARATIVE SHARE ANALYSIS OF CAULIFLOWER MICROGREENS MARKET, BY COUNTRY 2019 & 2028 (%)
FIGURE 15.COMPARATIVE SHARE ANALYSIS OF ARUGULA MICROGREENS MARKET, BY COUNTRY 2019 & 2028 (%)
FIGURE 16.COMPARATIVE SHARE ANALYSIS OF PEAS MICROGREENS MARKET, BY COUNTRY 2019 & 2028 (%)
FIGURE 17.COMPARATIVE SHARE ANALYSIS OF BASIL MICROGREENS MARKET, BY COUNTRY 2019 & 2028 (%)
FIGURE 18.COMPARATIVE SHARE ANALYSIS OF RADISH MICROGREENS MARKET, BY COUNTRY 2019 & 2028 (%)
FIGURE 19.COMPARATIVE SHARE ANALYSIS OF CARROTS MICROGREENS MARKET, BY COUNTRY 2019 & 2028 (%)
FIGURE 20.COMPARATIVE SHARE ANALYSIS OF OTHERS MICROGREENS MARKET, BY COUNTRY 2019 & 2028 (%)
FIGURE 21.MICROGREENS MARKET, BY FARMING, 2019 (%)
FIGURE 22.COMPARATIVE SHARE ANALYSIS OF INDOOR VERTICAL FARMING FOR MICROGREENS MARKET, BY COUNTRY 2019 & 2028 (%)
FIGURE 23.COMPARATIVE SHARE ANALYSIS OF COMMERCIAL GREENHOUSE FOR MICROGREENS MARKET, BY COUNTRY 2019 & 2028 (%)
FIGURE 24.COMPARATIVE SHARE ANALYSIS OF OTHERS FORMAING TYPES FOR MICROGREENS MARKET, BY COUNTRY 2019 & 2028 (%)
FIGURE 25.GLOBAL MICROGREENS MARKET, BY DISTRIBUTION CHANNEL, 2019 (%)
FIGURE 26.COMPARATIVE SHARE ANALYSIS OF RETAIL STORE FOR MICROGREENS MARKET, BY COUNTRY 2019 & 2028 (%)
FIGURE 27.COMPARATIVE SHARE ANALYSIS OF FARMERS MARKET FOR MICROGREENS MARKET, BY COUNTRY 2019 & 2028 (%)
FIGURE 28.COMPARATIVE SHARE ANALYSIS OF OTHER DISTRIBUTION CHANNELS FOR MICROGREENS MARKET, BY COUNTRY 2019 & 2028 (%)
FIGURE 29.GLOBAL MICROGREENS MARKET, BY END USER, 2019 (%)
FIGURE 30.COMPARATIVE SHARE ANALYSIS OF RESIDENTIAL FOR MICROGREENS MARKET, BY COUNTRY 2019 & 2028 (%)
FIGURE 31.COMPARATIVE SHARE ANALYSIS OF COMMERCIAL FOR MICROGREENS MARKET, BY COUNTRY 2019 & 2028 (%)
FIGURE 32.MICROGREENS MARKET, BY REGION, 2019 (%)
FIGURE 33.U.S. MICROGREENS MARKET, 2019–2028 ($MILLION)
FIGURE 34.CANADA MICROGREENS MARKET, 2019–2028 ($MILLION)
FIGURE 35.MEXICO MICROGREENS MARKET, 2019–2028 ($MILLION)
FIGURE 36.RUSSIA MICROGREENS MARKET, 2019–2028 ($MILLION)
FIGURE 37.SPAIN MICROGREENS MARKET, 2019–2028 ($MILLION)
FIGURE 38.ITALY MICROGREENS MARKET, 2019–2028 ($MILLION)
FIGURE 39.FRANCE MICROGREENS MARKET, 2019–2028 ($MILLION)
FIGURE 40.GERMANY MICROGREENS MARKET, 2019–2028 ($MILLION)
FIGURE 41.UK MICROGREENS MARKET, 2019–2028 ($MILLION)
FIGURE 42.NETHERLANDS MICROGREENS MARKET, 2019–2028 ($MILLION)
FIGURE 43.REST OF EUROPE MICROGREENS MARKET, 2019–2028 ($MILLION)
FIGURE 44.CHINA MICROGREENS MARKET, 2019–2028 ($MILLION)
FIGURE 45.JAPAN MICROGREENS MARKET, 2019–2028 ($MILLION)
FIGURE 46.INDIA MICROGREENS MARKET, 2019–2028 ($MILLION)
FIGURE 47.SOUTH KOREA MICROGREENS MARKET, 2019–2028 ($MILLION)
FIGURE 48.AUSTRALIA MICROGREENS MARKET, 2019–2028 ($MILLION)
FIGURE 49.REST OF ASIA-PACIFIC MICROGREENS MARKET, 2019–2028 ($MILLION)
FIGURE 50.LATIN AMERICA MICROGREENS MARKET, 2019–2028 ($MILLION)
FIGURE 51.MIDDLE EAST MICROGREENS MARKET, 2019–2028 ($MILLION)
FIGURE 52.AFRICA MICROGREENS MARKET, 2019–2028 ($MILLION)
FIGURE 53.TOP WINNING STRATEGIES, BY YEAR, 2017–2021*
FIGURE 54.TOP WINNING STRATEGIES, BY DEVELOPMENT, 2017–2021* (%)
FIGURE 55.PRODUCT MAPPING OF TOP 10 KEY PLAYERS
FIGURE 56.COMPETITIVE DASHBOARD OF TOP 10 KEY PLAYERS
FIGURE 57.COMPETITIVE HEATMAP OF TOP 10 KEY PLAYERS
$5769
$6450
$9995
HAVE A QUERY?
OUR CUSTOMER

SIMILAR REPORTS