

Indian Laparoscopy Devices Market by Product (Laparoscopes, Energy Devices, Insufflators, Robot-Assisted Surgical Systems, Suction or Irrigation Systems, Closure Devices, Hand Instruments, Access Devices, Accessories, and Others), Application (General Surgery, Bariatric Surgery, Gynecological Surgery, Urological Surgery, Colorectal Surgery, and Others), and End User (Hospitals, Clinics, and Others)
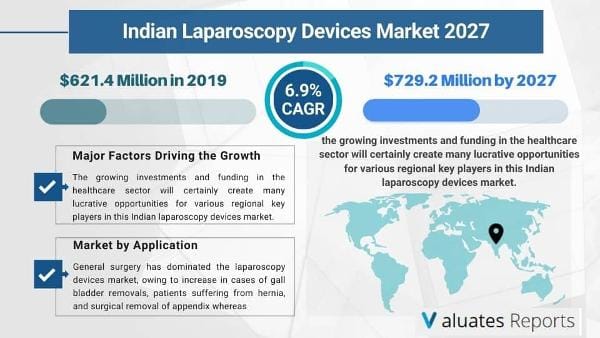
The Indian laparoscopy devices market was valued at $621.4 million in 2019 and is projected to reach $729.2 million by 2027, registering a CAGR of 6.9%.
Laparoscopic surgery, also called minimally invasive surgery (MIS), band-aid surgery, or keyhole surgery, is a modern surgical technique. Laparoscopy is a minimally invasive procedure used to examine organs inside the abdomen or pelvic cavities by inserting a laparoscope through a small incision in the abdomen. A laparoscope comprises a long, thin tube with high intensity light along with high resolution camera in front. The camera transmits images to monitor as it travels through the abdomen. Laparoscopy is used for diagnosis as well as treatment of endometriosis, ectopic pregnancy, pelvic inflammatory disease (PID), cysts, and fibroids. Laparoscopy devices are routinely used in diagnosis as well as in therapeutic procedures of various diseases such as prostatectomy, pancreatic cancer, and gastrointestinal disorders. Use of these devices in surgical procedures ensure minimal bleeding and assist in maintaining hemostasis. These devices are preferred by surgeons as well as physicians, owing to high level of precision offered by such devices in surgeries. There are a number of advantages to the patient with laparoscopic surgery versus the more common, open procedure. These include reduced pain due to smaller incisions, reduced hemorrhaging, and shorter recovery time.
The key factors that drive the Indian laparoscopy devices market include rise in number of obese populations, growth in number of minimally invasive procedures along with surge in disposable income, growth in laparoscopic-based bariatric surgeries for weight reduction, and increase in technological advancements pertaining to these devices. However, lack of expertise in laparoscopic surgeries and high costs associated with these devices and procedures are anticipated to restrain the market growth. Moreover, the growing investments and funding in the healthcare sector will certainly create many lucrative opportunities for various regional key players in this Indian laparoscopy devices market.
The COVID-19 pandemic has resulted in nationwide lockdowns; thereby, impacting every industry vertical. Likewise, the laparoscopy device market is also affected by the pandemic. The COVID-19 pandemic has affected laparoscopy device as manufacturers of laparoscopy devices have shut down their operations due to the COVID-19 pandemic, resulting in a drop in laparoscopy device output. Some of the laparoscopic and surgical services have been postponed during the coronavirus pandemic. So, patients undergoing treatment lost access to services and no surgeries had happened due to lockdown in India. The services will be made available for patients who are suffering from life threatening conditions. The rules and regulations have been tightened by the government regarding working of medical staff and activities, including several sub-domains of healthcare.
Based on product, the Indian laparoscopy devices market can be categorized into laparoscopes, energy devices, insufflators, robot assisted surgical system, suction or irrigation system, closure devices, hand instruments, access devices, and accessories. Energy devices used in laparoscopic procedures constitute light sources, camera heads, wireless display & monitors, laparoscopy cameras, carts, video processors & video convertors, transmitters & receivers, and others. The energy devices segment represents a very strong market for laparoscopic technologies. These tools are bare necessities for proper functioning of laparoscopes. Energy devices are essentially employed in laparoscopic surgeries, owing to continuous technological advancements. The need to close wounds after performing laparoscopic surgeries has resulted in development of new energy devices. This aids in improving efficiency and minimizing variability of laparoscopic surgeries. Growth in demand for single incision surgeries and other laparoscopic surgeries boost the requirement for energy devices in the laparoscopy device market.
Based on application, the Indian laparoscopy device can be categorized into general surgery, bariatric surgery, gynecological surgery, urological surgery, colorectal surgery, and others. General surgery has dominated the laparoscopy devices market, owing to increase in cases of gall bladder removals, patients suffering from hernia, and surgical removal of appendix whereas. The bariatric segment is anticipated to grow at a fast pace during the forecast period, owing to its potential in the treatment of diabetes and conditions associated with cardiovascular diseases. In addition, laparoscopic bariatric surgery assists in the improvement of ailments associated with obesity such as type 2 diabetes, high blood pressure, unhealthy cholesterol levels, and sleep apnea.
Based on end user, the Indian laparoscopy device can be categorized into hospitals, clinics, and others. Others include ambulatory surgical centers and diagnostic centers. Among these, the hospitals segment dominated the laparoscopy devices market, whereas the demand for laparoscopy devices in ambulatory surgical centers and physician offices is expected to increase in the coming years.
The key market players profiled in the report include Johnson & Johnson (Ethicon, Inc.), Olympus Corporation, Medtronic PLC. (Covidien), Boston Scientific Corporation, Stryker Corporation, Karl Storz GmbH & Co. KG, Smith & Nephew PLC., Richard Wolf GmbH, B. Braun Melsungen AG (Aesculap, Inc.), and Dolphin Surgicals. The other players in the value chain of the Indian laparoscopy devices market include Medical Equipment India (MEI), Universe Surgical Equipment Co., Xcellance Medical Technologies Pvt. Ltd., Hospiinz International, INDIA PRIVATE LIMITED, Bharat Surgical Co, Masppo Medical Devices, Hib Surgicals, SI Surgical Pvt. Ltd, and Jay Shakti Industries.
By Product
By Application
By End User
TABLE OF CONTENT
CHAPTER 1:INTRODUCTION
1.1.Report Description
1.2.Key Benefits to the Stakeholders
1.3.Key Market Segments
1.4.Research Methodology
1.4.1.Secondary research
1.4.2.Primary research
1.4.3.Analyst tools & models
CHAPTER 2:EXECUTIVE SUMMARY
2.1.CXO Perspective
CHAPTER 3:MARKET OVERVIEW
3.1.Market Definition and Scope
3.2.Key findings
3.2.1.Top investment pockets
3.2.2.Top winning strategies
3.3.Porter’s Five Forces Analysis
3.4.Regulatory Framework
3.5.Market Share Analysis, 2019
3.6.Market Dynamics
3.6.1.Drivers
3.6.1.1.Growth in preference for minimally invasive procedures
3.6.1.2.Surge in healthcare expenditure
3.6.1.3.Rise in disposable income
3.6.1.4.Increase in number of bariatric procedures using laparoscopes
3.6.1.5.Technologically advanced laparoscopy devices
3.6.1.6.Rise in incidences of colorectal cancer
3.6.2.Restraints
3.6.2.1.Dearth of skilled professionals
3.6.2.2.Post-operative risks associated with laparoscopy surgeries
3.6.3.Opportunities
3.6.3.1.Growth in adoption of robot-assisted laparoscopy devices
3.7.Covid-19 Impact analysis on laparoscopy device market
CHAPTER 4:INDIAN LAPAROSCOPY DEVICES MARKET, BY PRODUCT
4.1.Overview
4.1.1.Market size and forecast
4.2.Laparoscopes
4.2.1.Key market trends and opportunities
4.2.2.Market size and forecast
4.3.Energy Devices
4.3.1.Key market trends and opportunities
4.3.2.Market size and forecast
4.4.Insufflators
4.4.1.Key market trends and opportunities
4.4.2.Market size and forecast
4.5.Robot-assisted surgical systems
4.5.1.Key market trends and opportunities
4.5.2.Market size and forecast
4.6.Suction or Irrigation Systems
4.6.1.Key market trends and opportunities
4.6.2.Market size and forecast
4.7.Closure Devices
4.7.1.Key market trends and opportunities
4.7.2.Market size and forecast
4.8.Hand Instruments
4.8.1.Key market trends and opportunities
4.8.2.Market size and forecast
4.9.Access Devices
4.9.1.Key market trends and opportunities
4.9.2.Market size and forecast
4.10.Accessories
4.10.1.Key market trends and opportunities
4.10.2.Market size and forecast
4.11.Others
4.11.1.Key market trends and opportunities
4.11.2.Market size and forecast
CHAPTER 5:LAPAROSCOPY DEVICES MARKET, BY APPLICATION
5.1.Overview
5.1.1.Market size and forecast
5.2.General Surgery
5.2.1.Market size and forecast
5.2.2.Cholecystectomies
5.2.2.1.Market size and Forecast
5.2.3.Hernia Repairs
5.2.3.1.Market size and Forecast
5.2.4.Appendectomies
5.2.4.1.Market size and Forecast
5.2.5.Anti-reflux surgeries
5.2.5.1.Market size and Forecast
5.2.6.Others
5.2.6.1.Market size and Forecast
5.3.Bariatric Surgery
5.3.1.Market size and forecast
5.3.2.Gastric Bypass
5.3.2.1.Market size and Forecast
5.3.3.Sleeve Gastrectomy
5.3.3.1.Market size and Forecast
5.3.4.Gastric banding
5.3.4.1.Market size and Forecast
5.3.5.Others
5.3.5.1.Market size and Forecast
5.4.Gynecological Surgery
5.4.1.Market size and forecast
5.5.Urological Surgery
5.5.1.Market size and forecast
5.6.Colorectal Surgery
5.6.1.Market size and forecast
5.7.Others
5.7.1.Market size and forecast
CHAPTER 6:LAPAROSCOPY DEVICES MARKET, BY END USER
6.1.Overview
6.1.1.Market size and forecast
6.2.Hospitals
6.2.1.Market size and forecast
6.3.Clinics
6.3.1.Market size and forecast
6.4.Others
6.4.1.Market size and forecast
CHAPTER 7:COMPANY PROFILES
7.1.B. BRAUN MELSUNGEN AG
7.1.1.Company overview
7.1.2.Company snapshot
7.1.3.Operating business segments
7.1.4.Product portfolio
7.1.5.Business performance
7.2.BOSTON SCIENTIFIC CORPORATION
7.2.1.Company overview
7.2.2.Company snapshot
7.2.3.Operating business segments
7.2.4.Product portfolio
7.2.5.Business performance
7.3.DOLPHIN SURGICALS
7.3.1.Company overview
7.3.2.Company snapshot
7.3.3.Operating business segments
7.3.4.Product portfolio
7.4.JOHNSON & JOHNSON
7.4.1.Company overview
7.4.2.Company snapshot
7.4.3.Operating business segments
7.4.4.Product portfolio
7.4.5.Business performance
7.5.KARL STORZ SE & CO. KG
7.5.1.Company overview
7.5.2.Company snapshot
7.5.3.Operating business segments
7.5.4.Product portfolio
7.6.MEDTRONIC PLC. (COVIDIEN)
7.6.1.Company overview
7.6.2.Company snapshot
7.6.3.Operating business segments
7.6.4.Product portfolio
7.6.5.Business performance
7.7.OLYMPUS CORPORATION
7.7.1.Company overview
7.7.2.Company snapshot
7.7.3.Operating business segments
7.7.4.Product portfolio
7.7.5.Business performance
7.8.RICHARD WOLF GmbH
7.8.1.Company overview
7.8.2.Company snapshot
7.8.3.Operating business segments
7.8.4.Product portfolio
7.9.SMITH & NEPHEW PLC
7.9.1.Company overview
7.9.2.Company snapshot
7.9.3.Operating business segments
7.9.4.Product portfolio
7.9.5.Business performance
7.10.STRYKER CORPORATION
7.10.1.Company overview
7.10.2.Operating business segments
7.10.3.Product portfolio
7.10.4.Business performance
LIST OF TABLES & FIGURES
TABLE 01.LAPAROSCOPE DEVICES: POST-OPERATIVE RISKS
TABLE 02.INDIAN LAPAROSCOPY DEVICES MARKET, BY PRODUCT, 2019–2027 ($MILLION)
TABLE 03.LIST OF MARKET PLAYERS MANUFACTURING LAPAROSCOPES
TABLE 04.INDIAN LAPAROSCOPY DEVICES MARKET FOR LAPAROSCOPES, 2019–2027 ($MILLION)
TABLE 05.LIST OF MARKET PLAYERS MANUFACTURING ENERGY DEVICES
TABLE 06.INDIAN LAPAROSCOPY DEVICES MARKET FOR ENERGY DEVICES, 2019–2027 ($MILLION)
TABLE 07.LIST OF MARKET PLAYERS MANUFACTURING INSUFFLATORS
TABLE 08.INDIAN LAPAROSCOPY DEVICES MARKET FOR INSUFFLATORS, 2019–2027 ($MILLION)
TABLE 09.LIST OF MARKET PLAYERS MANUFACTURING ROBOT-ASSISTED SURGICAL SYSTEMS
TABLE 10.INDIAN LAPAROSCOPY DEVICES MARKET FOR ROBOT-ASSISTED SURGICAL SYSTEMS, 2019–2027 ($MILLION)
TABLE 11.LIST OF MARKET PLAYERS MANUFACTURING SUCTION OR IRRIGATION SYSTEMS
TABLE 12.INDIAN LAPAROSCOPY DEVICES MARKET FOR SUCTION OR IRRIGATION SYSTEMS, 2019–2027 ($MILLION)
TABLE 13.LIST OF MARKET PLAYERS MANUFACTURING CLOSURE DEVICES
TABLE 14.INDIAN LAPAROSCOPY DEVICES MARKET FOR CLOSURE DEVICES, 2019–2027 ($MILLION)
TABLE 15.INDIAN LAPAROSCOPY DEVICES MARKET FOR HAND INSTRUMENTS, 2019–2027 ($MILLION)
TABLE 16.INDIAN LAPAROSCOPY DEVICES MARKET FOR ACCESS DEVICES, BY REGION, 2019–2027 ($MILLION)
TABLE 17.INDIAN LAPAROSCOPY DEVICES MARKET FOR ACCESSORIES, 2019–2027 ($MILLION)
TABLE 18.INDIAN LAPAROSCOPY DEVICES MARKET FOR OTHER, 2019–2027 ($MILLION)
TABLE 19.INDIAN LAPAROSCOPY DEVICES MARKET, BY APPLICATION, 2019–2027 ($MILLION)
TABLE 20.INDIAN GENERAL SURGERY LAPAROSCOPY DEVICES MARKET, BY TYPE, 2019–2027 ($MILLION)
TABLE 21.INDIAN GENERAL SURGERY LAPAROSCOPY DEVICES MARKET, 2019–2027 ($MILLION)
TABLE 22.COMPARITIVE ANALYSIS OF LAPAROSCOPIC ANTI-REFLUX SURGERY WITH OPEN SURGERY
TABLE 23.INDIAN BARIATRIC SURGERY LAPAROSCOPY DEVICES MARKET, 2019–2027 ($MILLION)
TABLE 24.INDIAN BARIATRIC SURGERY LAPAROSCOPY DEVICES MARKET, BY TYPE, 2019–2027 ($MILLION)
TABLE 25.INDIAN GYNECOLOGICAL SURGERY LAPAROSCOPY DEVICES MARKET, 2019–2027 ($MILLION)
TABLE 26.INDIAN UROLOGICAL SURGERY LAPAROSCOPY DEVICES MARKET, BY REGION, 2019–2027 ($MILLION)
TABLE 27.INDIAN COLORECTAL SURGERY LAPAROSCOPY DEVICES MARKET, BY REGION, 2019–2027 ($MILLION)
TABLE 28.INDIAN OTHERS LAPAROSCOPY DEVICES MARKET, 2019–2027 ($MILLION)
TABLE 29.INDIAN LAPAROSCOPY DEVICES MARKET, BY END USER, 2019–2027 ($MILLION)
INDIAN LAPAROSCOPY DEVICES MARKET FOR HOSPITALS, BY REGION, 2019–2027 ($MILLION)
TABLE 30.INDIAN LAPAROSCOPY DEVICES MARKET FOR CLINICS, 2019–2027 ($MILLION)
TABLE 31.INDIAN LAPAROSCOPY DEVICES MARKET FOR OTHER END USER, 2019–2027 ($MILLION)
TABLE 32.B BRAUN: COMPANY SNAPSHOT
TABLE 33.B BRAUN: PRODUCT SEGMENTS
TABLE 34.B BRAUN: PRODUCT PORTFOLIO
TABLE 35.BOSTON: COMPANY SNAPSHOT
TABLE 36.BOSTON: OPERATING SEGMENTS
TABLE 37.BOSTON: PRODUCT PORTFOLIO
TABLE 38.DOLPHIN SURGICALS: COMPANY SNAPSHOT
TABLE 39.DOLPHIN SURGICALS: OPERATING SEGMENTS
TABLE 40.DOLPHIN SURGICALS: PRODUCT PORTFOLIO
TABLE 41.J&J: COMPANY SNAPSHOT
TABLE 42.J&J: OPERATING BUSINESS SEGMENTS
TABLE 43.J&J: PRODUCT PORTFOLIO
TABLE 44.KARL STORZ: COMPANY SNAPSHOT
TABLE 45.KARL STORZ: OPERATING BUSINESS SEGMENTS
TABLE 46.KARL STORZ: PRODUCT PORTFOLIO
TABLE 47.MEDTRONIC: COMPANY SNAPSHOT
TABLE 48.MEDTRONIC: OPERATING BUSINESS SEGMENTS
TABLE 49.MEDTRONIC: PRODUCT PORTFOLIO
TABLE 50.OLYMPUS: COMPANY SNAPSHOT
TABLE 51.OLYMPUS: OPERATING SEGMENTS
TABLE 52.OLYMPUS: PRODUCT PORTFOLIO
TABLE 53.RICHARD WOLF: COMPANY SNAPSHOT
TABLE 54.RICHARD WOLF: OPERATING SEGMENTS
TABLE 55.RICHARD WOLF: PRODUCT PORTFOLIO
TABLE 56.SMITH & NEPHEW: COMPANY SNAPSHOT
TABLE 57.SMITH & NEPHEW: OPERATING SEGMENTS
TABLE 58.SMITH & NEPHEW: PRODUCT PORTFOLIO
TABLE 59.STRYKER: COMPANY SNAPSHOT
TABLE 60.STRYKER: OPERATING SEGMENTS
TABLE 61.STRYKER: PRODUCT PORTFOLIO
LIST OF FIGURE
FIGURE 01.SEGMENTATION OF LAPAROSCOPY DEVICES MARKET
FIGURE 02.TOP INVESTMENT POCKETS IN LAPAROSCOPY DEVICES MARKET
FIGURE 03.TOP WINNING STRATEGIES, BY YEAR, 2016–2019*
FIGURE 04.TOP WINNING STRATEGIES, BY DEVELOPMENT, 2016–2019* (%)
FIGURE 05.TOP WINNING STRATEGIES, BY COMPANY, 2016–2019*
FIGURE 06.BARGAINING POWER OF BUYERS
FIGURE 07.BARGAINING POWER OF SUPPLIERS
FIGURE 08.THREAT OF NEW ENTRANTS
FIGURE 09.THREAT OF SUBSTITUTION
FIGURE 10.COMPETITIVE RIVALRY
FIGURE 11.RESTRAINTS AND DRIVERS: LAPAROSCOPY DEVICES MARKET
FIGURE 12.GENERAL SURGERY LAPAROSCOPY DEVICES MARKET: SEGMENTATION
FIGURE 13.INDIAN GENERAL SURGERY LAPAROSCOPY DEVICES MARKET BY CHOLECYSTECTOMIES, 2019–2027 ($MILLION)
FIGURE 14.INDIAN HERNIA REPAIRS GENERAL SURGERY LAPAROSCOPY DEVICES MARKET, 2019–2027 ($MILLION)
FIGURE 15.INDIAN APPENDECTOMIES GENERAL SURGERY LAPAROSCOPY DEVICES MARKET, 2019–2027 ($MILLION)
FIGURE 16.INDIAN ANTI-REFLUX SURGERIES GENERAL SURGERY LAPAROSCOPY DEVICES MARKET, 2019–2027 ($MILLION)
FIGURE 17.INDIAN OTHER GENERAL SURGERY LAPAROSCOPY DEVICES MARKET, 2019–2027 ($MILLION)
FIGURE 18.INDIAN BARIATRIC SURGERY LAPAROSCOPY DEVICES MARKET BY GASTRIC BYPASS, 2019–2027 ($MILLION)
FIGURE 19.INDIAN BARIATRIC SURGERY LAPAROSCOPY DEVICES MARKET BY SLEEVE GASTRECTOMIES, 2019–2027 ($MILLION)
FIGURE 20.INDIAN BARIATRIC SURGERY LAPAROSCOPY DEVICES MARKET BY GASTRIC BANDING, 2019–2027 ($MILLION)
FIGURE 21.INDIAN BARIATRIC SURGERY LAPAROSCOPY DEVICES MARKET BY OTHER, 2019–2027 ($MILLION)
FIGURE 22.B BRAUN: NET SALES, 2016–2018 ($MILLION)
FIGURE 23.B BRAUN: REVENUE SHARE BY SEGMENT, 2018 (%)
FIGURE 24.B BRAUN: REVENUE SHARE BY REGION, 2018(%)
FIGURE 25.BOSTON: NET SALES, 2016–2018 ($MILLION)
FIGURE 26.BOSTON: REVENUE SHARE BY SEGMENT, 2018 (%)
FIGURE 27.BOSTON: REVENUE SHARE BY REGION, 2018(%)
FIGURE 28.J&J: NET SALES, 2016–2018 ($MILLION)
FIGURE 29.J&J: REVENUE SHARE BY SEGMENT, 2018 (%)
FIGURE 30.J&J: REVENUE SHARE BY REGION, 2018(%)
FIGURE 31.MEDTRONIC: NET SALES, 2016–2018 ($MILLION)
FIGURE 32.MEDTRONIC: REVENUE SHARE BY SEGMENT, 2018 (%)
FIGURE 33.MEDTRONIC: REVENUE SHARE BY REGION, 2018 (%)
FIGURE 34.OLYMPUS: NET SALES, 2017–2019 ($MILLION)
FIGURE 35.OLYMPUS: REVENUE SHARE BY SEGMENT, 2018 (%)
FIGURE 36.OLYMPUS: REVENUE SHARE BY REGION, 2018(%)
FIGURE 37.SMITH & NEPHEW: NET SALES, 2016–2018 ($MILLION)
FIGURE 38.SMITH & NEPHEW: REVENUE SHARE BY SEGMENT, 2018 (%)
FIGURE 39.SMITH & NEPHEW: REVENUE SHARE BY REGION, 2018(%)
FIGURE 40.STRYKER: NET SALES, 2016–2018 ($MILLION)
FIGURE 41.STRYKER: REVENUE SHARE BY SEGMENT, 2018 (%)
FIGURE 42.STRYKER: REVENUE SHARE BY REGION, 2018(%)
$3249
$4774
HAVE A QUERY?
OUR CUSTOMER

Add to Cart
Add to Cart
Add to Cart
Add to Cart