
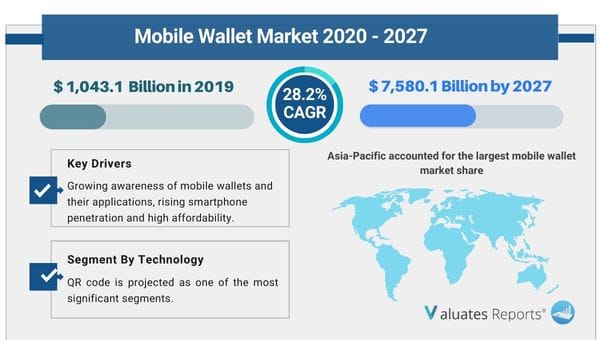
The mobile wallet market size was valued at USD 1,043.1 Billion in 2019, and is projected to reach USD 7,580.1 Billion by 2027, growing at a CAGR of 28.2% from 2020 to 2027. A mobile wallet allows consumers to make transactions even during travel, from any location, anytime. It not only provides transaction facilities at affordable prices but also facilitates consumers to manage their accounts easily. While all these aspects are boosting the growth of the mobile wallet industry, consumers’ concerns related to security and technology infancy, investment, and deployment issues are expected to impede the growth of the mobile wallet market. Although these restraints are prevalent, companies from the telecommunication industry are collaborating with each other to serve the needs of their customers with new and improved product / service innovation.
Mobile wallet offers an entirely new dimension to retail sales to improve their business presence. While mobile devices provide consumers with an easy way to make payments, they act as a new channel for merchants and financial institutions to connect with their customers. Information can be easily sent and received via mobile devices; they also run specialty applications, and are location-aware. The mobile connection facilitates merchants and financial institutions to communicate information such as promotional offers with their customers in such a way that the information is targeted, useful, and more relevant to their interests. Businesses can also come up with new branded applications that are freely downloadable. As unique shopping preferences and needs of a person are tracked, this aspect can make customer communications highly personalized. Such a connected and real-time marketing offers a new opportunity and competitive challenge to marketers.
Wide adoption of smartphones indicates the accessibility level for mobile wallet. Smartphone users are able to make the most of the mobile wallet functionalities, and it is expected that more such users will come up in the next few years owing to plenty of benefits that mobile wallet provides.
On the basis of mode of payment, the global mobile wallet market is categorized into remote and NFC payment. The NFC market is further sub-segmented into NFC handsets, NFC chips and tags, NFC readers, NFC Micro SD, and NFC SIM / UICC card. The global mobile wallet market stakeholders encompass mobile network operators (MNOs), handset manufacturers, OSS / BSS solution providers, software developers, content applications & aggregators, and other stakeholders. Increase in awareness regarding mobile wallets and their applications, rise in smartphone penetration, and high affordability are expected to drive the growth of the mobile wallet application market. Moreover, widespread smartphone adoption and implementation of multi-channel strategies by merchants due to increase in competition from Internet vendors is further expected to propel the mobile wallet market opportunities in the coming years
The report focuses on the growth prospects, restraints, and market analysis. The study provides Porter’s five forces analysis of the mobile wallet industry to understand the impact of various factors such as bargaining power of suppliers, competitive intensity of competitors, threat of new entrants, threat of substitutes, and bargaining power of buyers on the market.
The global mobile wallet market is segmented into type, technology, end user, industry vertical, and region. Depending on type, the market is bifurcated into proximity and remote. On the basis of technology, it is classified into near field communication, QR code, text based/ short message service, and digital only. By end user, the market is categorized into personal and business. By industry vertical, the market is classified into hospitality & transportation, media & entertainment, retail, healthcare, energy & utilities, telecommunication, and others. Region wise, it is analyzed across North America, Europe, Asia-Pacific, and LAMEA.
Emergence of payment-enabled mobile phones, connected and real-time marketing, and the social media effect are some of the major factors impacting the market growth. The top markets with high revenue and growth rates are mobile commerce and mobile ticketing. The key market drivers for mobile wallet market forecast include rise in adoption of smart phones and companies’ efforts toward improvement in mobile commerce platforms, services, and apps owing to high usage. As for mobile ticketing, the growth is expected to be driven by anticipated extensive usage of NFC-based ticketing solutions for transit purposes. However, stiff competition in the market is expected to hamper the mobile wallet market growth.
Greater Convenience and Accessibility
The ability of mobile wallet to provide online bill payment options and other money transfer facilities easily and securely drives the growth of the market. In addition, the user-friendly interface of mobile wallets has increased the number of consumers that are opting for a mobile wallet; where they can receive and make regular payments at their convenience through mobile wallets. Also, the user-friendly interface facilitates ease of transaction during travel, which is a major factor estimated to boost the growth of the market. Even, financial institutions and banks get an opportunity to connect with consumers in rural areas via the mobile wallet module, which has helped the market to grow and reach its end user at less cost. Various modules of mobile wallet are being developed to enhance security and ease of use of such services, which is further expected to drive the mobile wallet market growth in the coming years.
|
Report Metric |
Details |
|
Report Name |
Mobile Wallet Market |
|
The Market size value in 2019 |
1,043.1 Billion USD |
|
The Revenue forecast in 2027 |
200.85 Billion USD |
|
Growth Rate |
CAGR of 28.2% from 2020 to 2027 |
|
Base year considered |
2019 |
|
Forecast period |
2020-2027 |
|
Forecast units |
Value (USD) |
|
Segments covered |
Type, End-User, Offerings, and Region |
|
Report coverage |
Revenue & volume forecast, company share, competitive landscape, growth factors, and trends |
|
Geographic regions covered |
North America, Europe, Asia Pacific, Latin America, Middle East & Africa |
|
Companies covered |
Amazon Web Services Inc, American Express Banking Corp., Apple, Alipay.com, AT&T Inc, GOOGLE INC, Mastercard Incorporated, PayPal Holdings, Inc, Samsung Electronics Co Ltd, Visa |
Ans. The mobile wallet market size was valued at $1,043.1 billion in 2019, and is projected to reach $7,580.1 billion by 2027.
Ans. The mobile wallet market is expected to grow at a compound annual growth rate of 28.2% from 2020 to 2027.
Ans. Amazon Web Services Inc., American Express Banking Corp., Apple Inc., Alipay.com, AT&T Inc., Google Inc., Mastercard Incorporated, PayPal Holdings, Inc., Samsung Electronics Co., Ltd., and VISA Inc.
Ans. Growing awareness of mobile wallets and their applications, rising smartphone penetration and high affordability, are expected to drive the growth of mobile wallet market size.
CHAPTER 1:INTRODUCTION
1.1.REPORT DESCRIPTION
1.2.RESEARCH METHODOLOGY
1.2.1.Secondary research
1.2.2.Primary research
1.2.3.Analyst tools & models
CHAPTER 2:EXECUTIVE SUMMARY
2.1.KEY FINDINGS
2.1.1.Top impacting factors
2.1.2.Top investment pockets
2.2.CXO PERSPECTIVE
CHAPTER 3:MARKET OVERVIEW
3.1.MARKET DEFINITION AND SCOPE
3.2.PORTER’S FIVE FORCES ANALYSIS
3.2.1.Moderate -To-High bargaining power of suppliers
3.2.2.Low-To-High bargaining power of buyers
3.2.3.Low-To-High Threat of substitutes
3.2.4.Low threat of new entrants
3.2.5.Low-To-High competitive rivalry
3.3.MARKET DYNAMICS
3.3.1.Drivers
3.3.1.1.Soar in number of mobile subscribers across the globe
3.3.1.2.Increase in government initiatives to encourage cashless economy
3.3.1.3.Rise in the adoption of mobile wallet as a digital payment-based business models among digital applicationss
3.3.2.Restraint
3.3.2.1.Concerns associated with fraudulence transactions and data security
3.3.3.Opportunities
3.3.3.1.Increase in mobile point of sale (POS) devices and NFC-enabled handset
3.3.3.2.Mobile banking and inventive mobile payment application
3.4.MARKET EVOLUTION/ INDUSTRY ROADMAP
3.4.1.Online acceptance models
3.4.2.Reducing friction
3.4.3.Acceptance of mobile wallets
3.5.IMPACT OF GOVERNMENT REGULATIONS ON THE GLOBAL MOBILE WALLET MARKET
3.5.1.North America
3.5.2.Europe
3.5.3.Asia-Pacific
3.5.4.LAMEA
CHAPTER 4:MOBILE WALLET MARKET, BY TYPE
4.1.OVERVIEW
4.2.PROXIMITY
4.2.1.Key market trends, growth factors, and opportunities
4.2.2.Market size and forecast, by region
4.2.3.Market analysis, by country
4.3.REMOTE
4.3.1.Key market trends, growth factors, and opportunities
4.3.2.Market size and forecast, by region
4.3.3.Market analysis, by country
CHAPTER 5:MOBILE WALLET MARKET, BY TECHNOLOGY
5.1.OVERVIEW
5.2.NEAR FIELD COMMUNICATION
5.2.1.Key market trends, growth factors, and opportunities
5.2.2.Market size and forecast, by region
5.2.3.Market analysis, by country
5.3.QR CODE
5.3.1.Key market trends, growth factors, and opportunities
5.3.2.Market size and forecast, by region
5.3.3.Market analysis, by country
5.4.TEXT BASED/ SHORT MESSAGE SERVICE
5.4.1.Key market trends, growth factors, and opportunities
5.4.2.Market size and forecast, by region
5.4.3.Market analysis, by country
5.5.DIGITAL ONLY
5.5.1.Key market trends, growth factors, and opportunities
5.5.2.Market size and forecast, by region
5.5.3.Market analysis, by country
CHAPTER 6:MOBILE WALLET MARKET, BY APPLICATIONS6.1.OVERVIEW
6.2.HOSPITALITY & TRANSPORTATION
6.2.1.Key market trends, growth factors, and opportunities
6.2.2.Market size and forecast, by region
6.2.3.Market analysis, by country
6.3.MEDIA & ENTERTAINMENT
6.3.1.Key market trends, growth factors, and opportunities
6.3.2.Market size and forecast, by region
6.3.3.Market analysis, by country
6.4.RETAIL
6.4.1.Key market trends, growth factors, and opportunities
6.4.2.Market size and forecast, by region
6.4.3.Market analysis, by country
6.5.HEALTHCARE
6.5.1.Key market trends, growth factors, and opportunities
6.5.2.Market size and forecast, by region
6.5.3.Market analysis, by country
6.6.ENERGY & UTILITIES
6.6.1.Key market trends, growth factors, and opportunities
6.6.2.Market size and forecast, by region
6.6.3.Market analysis, by country
6.7.TELECOMMUNICATION
6.7.1.Key market trends, growth factors, and opportunities
6.7.2.Market size and forecast, by region
6.7.3.Market analysis, by country
6.8.OTHERS
6.8.1.Key market trends, growth factors, and opportunities
6.8.2.Market size and forecast, by region
6.8.3.Market analysis, by country
CHAPTER 7:MOBILE WALLET MARKET, BY END USER
7.1.OVERVIEW
7.2.PERSONAL
7.2.1.Key market trends, growth factors, and opportunities
7.2.2.Market size and forecast, by region
7.2.3.Market analysis, by country
7.3.BUSINESS
7.3.1.Key market trends, growth factors, and opportunities
7.3.2.Market size and forecast, by region
7.3.3.Market analysis, by country
CHAPTER 8:MOBILE WALLET MARKET, BY REGION
8.1.OVERVIEW
8.2.NORTH AMERICA
8.2.1.Key market trends, growth factors and opportunities
8.2.2.Market size and forecast, by technology
8.2.3.Market size and forecast, by type
8.2.4.Market size and forecast, by applications
8.2.5.Market size and forecast, by end user
8.2.6.Market analysis by country
8.2.6.1.U.S.
8.2.6.1.1.Market size and forecast, by technology
8.2.6.1.2.Market size and forecast, by type
8.2.6.1.3.Market size and forecast, by applications
8.2.6.1.4.Market size and forecast, by end user
8.2.6.2.CANADA
8.2.6.2.1.Market size and forecast, by technology
8.2.6.2.2.Market size and forecast, by type
8.2.6.2.3.Market size and forecast, by applications
8.2.6.2.4.Market size and forecast, by end user
8.3.EUROPE
8.3.1.Key market trends, growth factors and opportunities
8.3.2.Market size and forecast, by technology
8.3.3.Market size and forecast, by type
8.3.4.Market size and forecast, by applications
8.3.5.Market size and forecast, by end user
8.3.6.Market analysis by country
8.3.6.1.GERMANY
8.3.6.1.1.Market size and forecast, by technology
8.3.6.1.2.Market size and forecast, by type
8.3.6.1.3.Market size and forecast, by applications
8.3.6.1.4.Market size and forecast, by end user
8.3.6.2.FRANCE
8.3.6.2.1.Market size and forecast, by technology
8.3.6.2.2.Market size and forecast, by type
8.3.6.2.3.Market size and forecast, by applications
8.3.6.2.4.Market size and forecast, by end user
8.3.6.3.UK
8.3.6.3.1.Market size and forecast, by technology
8.3.6.3.2.Market size and forecast, by type
8.3.6.3.3.Market size and forecast, by applications
8.3.6.3.4.Market size and forecast, by end user
8.3.6.4.SPAIN
8.3.6.4.1.Market size and forecast, by technology
8.3.6.4.2.Market size and forecast, by type
8.3.6.4.3.Market size and forecast, by applications
8.3.6.4.4.Market size and forecast, by end user
8.3.6.5.ITALY
8.3.6.5.1.Market size and forecast, by technology
8.3.6.5.2.Market size and forecast, by type
8.3.6.5.3.Market size and forecast, by applications
8.3.6.5.4.Market size and forecast, by end user
8.3.6.6.REST OF EUROPE
8.3.6.6.1.Market size and forecast, by technology
8.3.6.6.2.Market size and forecast, by type
8.3.6.6.3.Market size and forecast, by applications
8.3.6.6.4.Market size and forecast, by end user
8.4.ASIA-PACIFIC
8.4.1.Key market trends, growth factors and opportunities
8.4.2.Market size and forecast, by technology
8.4.3.Market size and forecast, by type
8.4.4.Market size and forecast, by applications
8.4.5.Market size and forecast, by end user
8.4.6.Market analysis by country
8.4.6.1.JAPAN
8.4.6.1.1.Market size and forecast, by technology
8.4.6.1.2.Market size and forecast, by type
8.4.6.1.3.Market size and forecast, by applications
8.4.6.1.4.Market size and forecast, by end user
8.4.6.2.CHINA
8.4.6.2.1.Market size and forecast, by technology
8.4.6.2.2.Market size and forecast, by type
8.4.6.2.3.Market size and forecast, by applications
8.4.6.2.4.Market size and forecast, by end user
8.4.6.3.AUSTRALIA
8.4.6.3.1.Market size and forecast, by technology
8.4.6.3.2.Market size and forecast, by type
8.4.6.3.3.Market size and forecast, by applications
8.4.6.3.4.Market size and forecast, by end user
8.4.6.4.INDIA
8.4.6.4.1.Market size and forecast, by technology
8.4.6.4.2.Market size and forecast, by type
8.4.6.4.3.Market size and forecast, by applications
8.4.6.4.4.Market size and forecast, by end user
8.4.6.5.SOUTH KOREA
8.4.6.5.1.Market size and forecast, by technology
8.4.6.5.2.Market size and forecast, by type
8.4.6.5.3.Market size and forecast, by applications
8.4.6.5.4.Market size and forecast, by end user
8.4.6.6.REST OF ASIA-PACIFIC
8.4.6.6.1.Market size and forecast, by technology
8.4.6.6.2.Market size and forecast, by type
8.4.6.6.3.Market size and forecast, by applications
8.4.6.6.4.Market size and forecast, by end user
8.5.LAMEA
8.5.1.Key market trends, growth factors and opportunities
8.5.2.Market size and forecast, by technology
8.5.3.Market size and forecast, by type
8.5.4.Market size and forecast, by applications
8.5.5.Market size and forecast, by end user
8.5.6.Market analysis by country
8.5.6.1.LATIN AMERICA
8.5.6.1.1.Market size and forecast, by technology
8.5.6.1.2.Market size and forecast, by type
8.5.6.1.3.Market size and forecast, by applications
8.5.6.1.4.Market size and forecast, by end user
8.5.6.2.MIDDLE EAST
8.5.6.2.1.Market size and forecast, by technology
8.5.6.2.2.Market size and forecast, by type
8.5.6.2.3.Market size and forecast, by applications
8.5.6.2.4.Market size and forecast, by end user
8.5.6.3.AFRICA
8.5.6.3.1.Market size and forecast, by technology
8.5.6.3.2.Market size and forecast, by type
8.5.6.3.3.Market size and forecast, by applications
8.5.6.3.4.Market size and forecast, by end user
CHAPTER 9:COMPETITIVE LANDSCAPE
9.1.KEY PLAYER POSITIONING ANALYSIS, 2019
9.2.TOP WINNING STRATEGIES
9.3.COMPETITIVE DASHBOARD
9.4.KEY DEVELOPMENTS
9.4.1.New Type launches
9.4.2.Product development
9.4.3.Collaboration
9.4.4.Acquisition
9.4.5.Partnership
9.4.6.Business Expansion
CHAPTER 10:COMPANY PROFILES
10.1.ALIPAY.COM
10.1.1.Company overview
10.1.2.Key executives
10.1.3.Company snapshot
10.1.4.Operating business segments
10.1.5.Product portfolio
10.1.6.Business performance
10.1.7.Key strategic moves and developments
10.2.AMAZON.COM INC.
10.2.1.Company overview
10.2.2.Key executives
10.2.3.Company snapshot
10.2.4.Operating business segments
10.2.5.Product portfolio
10.2.6.Business performance
10.2.7.Key strategic moves and developments
10.3.AMERICAN EXPRESS COMPANY
10.3.1.Company overview
10.3.2.Key executives
10.3.3.Company snapshot
10.3.4.Operating business segments
10.3.5.Product portfolio
10.3.6.Business performance
10.3.7.Key strategic moves and developments
10.4.APPLE INC.
10.4.1.Company overview
10.4.2.Key executives
10.4.3.Company snapshot
10.4.4.Operating business segments
10.4.5.Product portfolio
10.4.6.R&D expenditure
10.4.7.Business performance
10.4.8.Key strategic moves and developments
10.5.AT&T INC.
10.5.1.Company overview
10.5.2.Key executives
10.5.3.Company snapshot
10.5.4.Operating business segments
10.5.5.Product portfolio
10.5.6.R&D expenditure
10.5.7.Business performance
10.5.8.Key strategic moves and developments
10.6.GOOGLE LLC
10.6.1.Company overview
10.6.2.Key executives
10.6.3.Company snapshot
10.6.4.Operating business segments
10.6.5.Product portfolio
10.6.6.R&D expenditure
10.6.7.Business performance
10.6.8.Key strategic moves and developments
10.7.MASTERCARD
10.7.1.Company overview
10.7.2.Key executives
10.7.3.Company snapshot
10.7.4.Product portfolio
10.7.5.Business performance
10.7.6.Key strategic moves and developments
10.8.PAYPAL HOLDINGS, INC.
10.8.1.Company overview
10.8.2.Key executives
10.8.3.Company snapshot
10.8.4.Product portfolio
10.8.5.R&D expenditure
10.8.6.Business performance
10.8.7.Key strategic moves and developments
10.9.SAMSUNG ELECTRONICS CO., LTD.
10.9.1.Company overview
10.9.2.Key Executives
10.9.3.Company snapshot
10.9.4.Operating business segments
10.9.5.Product portfolio
10.9.6.R&D expenditure
10.9.7.Business performance
10.9.8.Key strategic moves and developments
10.10.VISA INC.
10.10.1.Company overview
10.10.2.Key executives
10.10.3.Company snapshot
10.10.4.Product portfolio
10.10.5.Business performance
10.10.6.Key strategic moves and developments
LIST OF TABLES
TABLE 01.MOBILE WALLET MARKET, BY TYPE 2019–2027 ($BILLION)
TABLE 02.MOBILE WALLET MARKET FOR PROXIMITY, BY REGION, 2019–2027 ($BILLION)
TABLE 03.MOBILE WALLET MARKET FOR REMOTE, BY REGION, 2019–2027 ($BILLION)
TABLE 04.MOBILE WALLET MARKET, BY TECHNOLOGY 2019–2027 ($BILLION)
TABLE 05.MOBILE WALLET MARKET FOR NEAR FIELD COMMUNICATION, BY REGION, 2019–2027 ($BILLION)
TABLE 06.MOBILE WALLET MARKET FOR QR CODE, BY REGION, 2019–2027 ($BILLION)
TABLE 07.MOBILE WALLET MARKET FOR TEXT BASED/ SHORT MESSAGE SERVICE, BY REGION, 2019–2027 ($BILLION)
TABLE 08.MOBILE WALLET MARKET FOR DIGITAL ONLY, BY REGION, 2019–2027 ($BILLION)
TABLE 09.MOBILE WALLET MARKET, BY APPLICATIONS, 2019–2027 ($BILLION)
TABLE 10.MOBILE WALLET MARKET FOR HOSPITALITY & TRANSPORTATION, BY REGION, 2019–2027 ($BILLION)
TABLE 11.MOBILE WALLET MARKET FOR MEDIA & ENTERTAINMENT, BY REGION, 2019–2027 ($BILLION)
TABLE 12.MOBILE WALLET MARKET FOR RETAIL, BY REGION, 2019–2027 ($BILLION)
TABLE 13.MOBILE WALLET MARKET FOR HEALTHCARE, BY REGION, 2019–2027 ($BILLION)
TABLE 14.MOBILE WALLET MARKET FOR ENERGY & UTILITIES, BY REGION, 2019–2027 ($BILLION)
TABLE 15.MOBILE WALLET MARKET FOR TELECOMMUNICATION, BY REGION, 2019–2027 ($BILLION)
TABLE 16.MOBILE WALLET MARKET FOR OTHERS, BY REGION, 2019–2027 ($BILLION)
TABLE 17.MOBILE WALLET MARKET, BY END USER 2019–2027 ($BILLION)
TABLE 18.MOBILE WALLET MARKET FOR PERSONAL, BY REGION, 2019–2027 ($BILLION)
TABLE 19.MOBILE WALLET MARKET FOR BUSINESS, BY REGION, 2019–2027 ($BILLION)
TABLE 20.MOBILE WALLET MARKET, BY REGION, 2019–2027 ($BILLION)
TABLE 21.MOBILE WALLET MARKET, BY REGION, 2019–2027 ($BILLION)
TABLE 22.NORTH AMERICA MOBILE WALLET MARKET, BY TECHNOLOGY, 2019-2027 ($BILLION)
TABLE 23.NORTH AMERICA MOBILE WALLET MARKET, BY TYPE, 2019-2027 ($BILLION)
TABLE 24.NORTH AMERICA MOBILE WALLET MARKET, BY APPLICATIONS, 2019-2027 ($BILLION)
TABLE 25.NORTH AMERICA MOBILE WALLET MARKET, BY END USER, 2019-2027 ($BILLION)
TABLE 26.NORTH AMERICA MOBILE WALLET MARKET, BY COUNTRY, 2019-2027 ($BILLION)
TABLE 27.U.S. MOBILE WALLET MARKET, BY TECHNOLOGY, 2019-2027 ($BILLION)
TABLE 28.U.S. MOBILE WALLET MARKET, BY TYPE, 2019-2027 ($BILLION)
TABLE 29.U.S. MOBILE WALLET MARKET, BY APPLICATIONS, 2019-2027 ($BILLION)
TABLE 30.U.S. MOBILE WALLET MARKET, BY END USER, 2019-2027 ($BILLION)
TABLE 31.CANADA MOBILE WALLET MARKET, BY TECHNOLOGY, 2019-2027 ($BILLION)
TABLE 32.CANADA MOBILE WALLET MARKET, BY TYPE, 2019-2027 ($BILLION)
TABLE 33.CANADA MOBILE WALLET MARKET, BY APPLICATIONS, 2019-2027 ($BILLION)
TABLE 34.CANADA MOBILE WALLET MARKET, BY END USER, 2019-2027 ($BILLION)
TABLE 35.EUROPE MOBILE WALLET MARKET, BY TECHNOLOGY, 2019-2027 ($BILLION)
TABLE 36.EUROPE MOBILE WALLET MARKET, BY TYPE, 2019-2027 ($BILLION)
TABLE 37.EUROPE MOBILE WALLET MARKET, BY APPLICATIONS, 2019-2027 ($BILLION)
TABLE 38.EUROPE MOBILE WALLET MARKET, BY END USER, 2019-2027 ($BILLION)
TABLE 39.EUROPE MOBILE WALLET MARKET, BY COUNTRY, 2019-2027 ($BILLION)
TABLE 40.GERMANY MOBILE WALLET MARKET, BY TECHNOLOGY, 2019-2027 ($BILLION)
TABLE 41.GERMANY MOBILE WALLET MARKET, BY TYPE, 2019-2027 ($BILLION)
TABLE 42.GERMANY MOBILE WALLET MARKET, BY APPLICATIONS, 2019-2027 ($BILLION)
TABLE 43.GERMANY MOBILE WALLET MARKET, BY END USER, 2019-2027 ($BILLION)
TABLE 44.FRANCE MOBILE WALLET MARKET, BY TECHNOLOGY, 2019-2027 ($BILLION)
TABLE 45.FRANCE MOBILE WALLET MARKET, BY TYPE, 2019-2027 ($BILLION)
TABLE 46.FRANCE MOBILE WALLET MARKET, BY APPLICATIONS, 2019-2027 ($BILLION)
TABLE 47.FRANCE MOBILE WALLET MARKET, BY END USER, 2019-2027 ($BILLION)
TABLE 48.UK MOBILE WALLET MARKET, BY TECHNOLOGY, 2019-2027 ($BILLION)
TABLE 49.UK MOBILE WALLET MARKET, BY TYPE, 2019-2027 ($BILLION)
TABLE 50.UK MOBILE WALLET MARKET, BY APPLICATIONS, 2019-2027 ($BILLION)
TABLE 51.UK MOBILE WALLET MARKET, BY END USER, 2019-2027 ($BILLION)
TABLE 52.SPAIN MOBILE WALLET MARKET, BY TECHNOLOGY, 2019-2027 ($BILLION)
TABLE 53.SPAIN MOBILE WALLET MARKET, BY TYPE, 2019-2027 ($BILLION)
TABLE 54.SPAIN MOBILE WALLET MARKET, BY APPLICATIONS, 2019-2027 ($BILLION)
TABLE 55.SPAIN MOBILE WALLET MARKET, BY END USER, 2019-2027 ($BILLION)
TABLE 56.ITALY MOBILE WALLET MARKET, BY TECHNOLOGY, 2019-2027 ($BILLION)
TABLE 57.ITALY MOBILE WALLET MARKET, BY TYPE, 2019-2027 ($BILLION)
TABLE 58.ITALY MOBILE WALLET MARKET, BY APPLICATIONS, 2019-2027 ($BILLION)
TABLE 59.ITALY MOBILE WALLET MARKET, BY END USER, 2019-2027 ($BILLION)
TABLE 60.REST OF EUROPE MOBILE WALLET MARKET, BY TECHNOLOGY, 2019-2027 ($BILLION)
TABLE 61.REST OF EUROPE MOBILE WALLET MARKET, BY TYPE, 2019-2027 ($BILLION)
TABLE 62.REST OF EUROPE MOBILE WALLET MARKET, BY APPLICATIONS, 2019-2027 ($BILLION)
TABLE 63.REST OF EUROPE MOBILE WALLET MARKET, BY END USER, 2019-2027 ($BILLION)
TABLE 64.ASIA-PACIFIC MOBILE WALLET MARKET, BY TECHNOLOGY, 2019-2027 ($BILLION)
TABLE 65.ASIA-PACIFIC MOBILE WALLET MARKET, BY TYPE, 2019-2027 ($BILLION)
TABLE 66.ASIA-PACIFIC MOBILE WALLET MARKET, BY APPLICATIONS, 2019-2027 ($BILLION)
TABLE 67.ASIA-PACIFIC MOBILE WALLET MARKET, BY END USER, 2019-2027 ($BILLION)
TABLE 68.ASIA-PACIFIC MOBILE WALLET MARKET, BY COUNTRY, 2019-2027 ($BILLION)
TABLE 69.JAPAN MOBILE WALLET MARKET, BY TECHNOLOGY, 2019-2027 ($BILLION)
TABLE 70.JAPAN MOBILE WALLET MARKET, BY TYPE, 2019-2027 ($BILLION)
TABLE 71.JAPAN MOBILE WALLET MARKET, BY APPLICATIONS, 2019-2027 ($BILLION)
TABLE 72.JAPAN MOBILE WALLET MARKET, BY END USER, 2019-2027 ($BILLION)
TABLE 73.CHINA MOBILE WALLET MARKET, BY TECHNOLOGY, 2019-2027 ($BILLION)
TABLE 74.CHINA MOBILE WALLET MARKET, BY TYPE, 2019-2027 ($BILLION)
TABLE 75.CHINA MOBILE WALLET MARKET, BY APPLICATIONS, 2019-2027 ($BILLION)
TABLE 76.CHINA MOBILE WALLET MARKET, BY END USER, 2019-2027 ($BILLION)
TABLE 77.AUSTRALIA MOBILE WALLET MARKET, BY TECHNOLOGY, 2019-2027 ($BILLION)
TABLE 78.AUSTRALIA MOBILE WALLET MARKET, BY TYPE, 2019-2027 ($BILLION)
TABLE 79.AUSTRALIA MOBILE WALLET MARKET, BY APPLICATIONS, 2019-2027 ($BILLION)
TABLE 80.AUSTRALIA MOBILE WALLET MARKET, BY END USER, 2019-2027 ($BILLION)
TABLE 81.INDIA MOBILE WALLET MARKET, BY TECHNOLOGY, 2019-2027 ($BILLION)
TABLE 82.INDIA MOBILE WALLET MARKET, BY TYPE, 2019-2027 ($BILLION)
TABLE 83.INDIA MOBILE WALLET MARKET, BY APPLICATIONS, 2019-2027 ($BILLION)
TABLE 84.INDIA MOBILE WALLET MARKET, BY END USER, 2019-2027 ($BILLION)
TABLE 85.SOUTH KOREA MOBILE WALLET MARKET, BY TECHNOLOGY, 2019-2027 ($BILLION)
TABLE 86.SOUTH KOREA MOBILE WALLET MARKET, BY TYPE, 2019-2027 ($BILLION)
TABLE 87.SOUTH KOREA MOBILE WALLET MARKET, BY APPLICATIONS, 2019-2027 ($BILLION)
TABLE 88.SOUTH KOREA MOBILE WALLET MARKET, BY END USER, 2019-2027 ($BILLION)
TABLE 89.REST OF ASIA-PACIFIC MOBILE WALLET MARKET, BY TECHNOLOGY, 2019-2027 ($BILLION)
TABLE 90.REST OF ASIA-PACIFIC MOBILE WALLET MARKET, BY TYPE, 2019-2027 ($BILLION)
TABLE 91.REST OF ASIA-PACIFIC MOBILE WALLET MARKET, BY APPLICATIONS, 2019-2027 ($BILLION)
TABLE 92.REST OF ASIA-PACIFIC MOBILE WALLET MARKET, BY END USER, 2019-2027 ($BILLION)
TABLE 93.LAMEA MOBILE WALLET MARKET, BY TECHNOLOGY, 2019-2027 ($BILLION)
TABLE 94.LAMEA MOBILE WALLET MARKET, BY TYPE, 2019-2027 ($BILLION)
TABLE 95.LAMEA MOBILE WALLET MARKET, BY APPLICATIONS, 2019-2027 ($BILLION)
TABLE 96.LAMEA MOBILE WALLET MARKET, BY END USER, 2019-2027 ($BILLION)
TABLE 97.LATIN AMERICA MOBILE WALLET MARKET, BY TECHNOLOGY, 2019-2027 ($BILLION)
TABLE 98.LATIN AMERICA MOBILE WALLET MARKET, BY TYPE, 2019-2027 ($BILLION)
TABLE 99.LATIN AMERICA MOBILE WALLET MARKET, BY APPLICATIONS, 2019-2027 ($BILLION)
TABLE 100.LATIN AMERICA MOBILE WALLET MARKET, BY END USER, 2019-2027 ($BILLION)
TABLE 101.MIDDLE EAST MOBILE WALLET MARKET, BY TECHNOLOGY, 2019-2027 ($BILLION)
TABLE 102.MIDDLE EAST MOBILE WALLET MARKET, BY TYPE, 2019-2027 ($BILLION)
TABLE 103.MIDDLE EAST MOBILE WALLET MARKET, BY APPLICATIONS, 2019-2027 ($BILLION)
TABLE 104.MIDDLE EAST MOBILE WALLET MARKET, BY END USER, 2019-2027 ($BILLION)
TABLE 105.AFRICA MOBILE WALLET MARKET, BY TECHNOLOGY, 2019-2027 ($BILLION)
TABLE 106.AFRICA MOBILE WALLET MARKET, BY TYPE, 2019-2027 ($BILLION)
TABLE 107.AFRICA MOBILE WALLET MARKET, BY APPLICATIONS, 2019-2027 ($BILLION)
TABLE 108.AFRICA MOBILE WALLET MARKET, BY END USER, 2019-2027 ($BILLION)
TABLE 109.KEY NEW TYPE LAUNCHES (2018-2020)
TABLE 110.TYPEDEVELOPMENT (2018-2020)
TABLE 111.COLLABORATION (2018-2020)
TABLE 112.ACQUISTION (2018-2020)
TABLE 113.PARTNERSHIP (2018-2020)
TABLE 114.BUSINESS EXPANSION (2018-2020)
TABLE 115.ALIPAY.COM.: COMPANY SNAPSHOT
TABLE 116.ALIBABA GROUP HOLDING LIMITED: OPERATING SEGMENTS
TABLE 117.ALIPAY.COM: PRODUCT PORTFOLIO
TABLE 118.AMAZON.COM INC.: KEY EXECUTIVES
TABLE 119.AMAZON.COM INC.: COMPANY SNAPSHOT
TABLE 120.AMAZON.COM INC.: OPERATING SEGMENTS
TABLE 121.AMAZON.COM INC.: PRODUCT PORTFOLIO
TABLE 122.AMERICAN EXPRESS COMPANY: COMPANY SNAPSHOT
TABLE 123.AMERICAN EXPRESS COMPANY: OPERATING SEGMENTS
TABLE 124.AMERICAN EXPRESS COMPANY: PRODUCT PORTFOLIO
TABLE 125.APPLE INC.: KEY EXECUTIVES
TABLE 126.APPLE INC.: COMPANY SNAPSHOT
TABLE 127.APPLE INC.: PRODUCT CATEGORIES
TABLE 128.APPLE INC.: PRODUCT PORTFOLIO
TABLE 129.AT&T INC.: KEY EXECUTIVES
TABLE 130.AT&T INC.: COMPANY SNAPSHOT
TABLE 131.AT&T INC.: OPERATING SEGMENTS
TABLE 132.AT&T INC.: PRODUCT PORTFOLIO
TABLE 133.AT&T INC.: KEY STRATEGIC MOVES AND DEVELOPMENTS
TABLE 134.GOOGLE LLC: KEY EXECUTIVES
TABLE 135.GOOGLE LLC: COMPANY SNAPSHOT
TABLE 136.ALPHABET INC.: OPERATING SEGMENTS
TABLE 137.ALPHABET INC.: PRODUCT PORTFOLIO
TABLE 138.MASTERCARD: KEY EXECUTIVES
TABLE 139.MASTERCARD: COMPANY SNAPSHOT
TABLE 140.MASTERCARD: PRODUCT PORTFOLIO
TABLE 141.PAYPAL HOLDINGS, INC. : KEY EXECUTIVES
TABLE 142.PAYPAL HOLDINGS, INC. : COMPANY SNAPSHOT
TABLE 143.PAYPAL HOLDINGS, INC. : PRODUCT PORTFOLIO
TABLE 144.SAMSUNG ELECTRONICS CO., LTD.: KEY EXECUTIVES
TABLE 145.SAMSUNG ELECTRONICS CO., LTD.: COMPANY SNAPSHOT
TABLE 146.SAMSUNG ELECTRONICS CO., LTD.: OPERATING SEGMENTS
TABLE 147.SAMSUNG ELECTRONICS CO., LTD.: PRODUCT PORTFOLIO
TABLE 148.VISA INC.: KEY EXECUTIVES
TABLE 149.VISA INC.: COMPANY SNAPSHOT
TABLE 150.VISA INC.: PRODUCT PORTFOLIO
LIST OF FIGURES
FIGURE 01.KEY MARKET SEGMENTS
FIGURE 02.MOBILE WALLET MARKET, 2019–2027
FIGURE 03.MOBILE WALLET MARKET, BY COUNTRY, 2019-2027
FIGURE 04.TOP IMPACTING FACTORS
FIGURE 05.TOP INVESTMENT POCKETS
FIGURE 06.MODERATE -TO-HIGH BARGAINING POWER OF SUPPLIERS
FIGURE 07.LOW-TO-HIGH BARGAINING POWER OF BUYERS
FIGURE 08.LOW-TO-HIGH THREAT OF SUBSTITUTES
FIGURE 09.LOW THREAT OF NEW ENTRANTS
FIGURE 10.LOW-TO-HIGH COMPETITIVE RIVALRY
FIGURE 11.MARKET DYNAMICS: GLOBAL MOBILE WALLET MARKET
FIGURE 12.OPPORTUNISTIC FORM FACTORS THAT WILL IMPACT THE EVOLUTION OF MOBILE PAYMENTS IN COMING YEARS
FIGURE 13.INDUSTRY ROADMAP OF GLOBAL MOBILE WALLET MARKET
FIGURE 14.IMPACT OF RETAIL REGULATIONS ON THE GLOBAL MOBILE WALLET MARKET
FIGURE 15.MOBILE WALLET MARKET, BY TYPE, 2019–2027 ($BILLION)
FIGURE 16.COMPARATIVE SHARE ANALYSIS OF MOBILE WALLET MARKET FOR PROXIMITY, BY COUNTRY, 2019 & 2027 (%)
FIGURE 17.COMPARATIVE SHARE ANALYSIS OF MOBILE WALLET MARKET FOR REMOTE, BY COUNTRY, 2019 & 2027 (%)
FIGURE 18.MOBILE WALLET MARKET, BY TECHNOLOGY, 2019–2027 ($BILLION)
FIGURE 19.COMPARATIVE SHARE ANALYSIS OF MOBILE WALLET MARKET FOR NEAR FIELD COMMUNICATION, BY COUNTRY, 2019 & 2027 (%)
FIGURE 20.COMPARATIVE SHARE ANALYSIS OF MOBILE WALLET MARKET FOR QR CODE, BY COUNTRY, 2019 & 2027 (%)
FIGURE 21.COMPARATIVE SHARE ANALYSIS OF MOBILE WALLET MARKET FOR TEXT BASED/ SHORT MESSAGE SERVICE, BY COUNTRY, 2019 & 2027 (%)
FIGURE 22.COMPARATIVE SHARE ANALYSIS OF MOBILE WALLET MARKET FOR DIGITAL ONLY, BY COUNTRY, 2019 & 2027 (%)
FIGURE 23.MOBILE WALLET MARKET, BY APPLICATIONS, 2019–2027 ($BILLION)
FIGURE 24.COMPARATIVE SHARE ANALYSIS OF MOBILE WALLET MARKET FOR HOSPITALITY & TRANSPORTATION, BY COUNTRY, 2019 & 2027 (%)
FIGURE 25.COMPARATIVE SHARE ANALYSIS OF MOBILE WALLET MARKET FOR MEDIA & ENTERTAINMENT, BY COUNTRY, 2019 & 2027 (%)
FIGURE 26.COMPARATIVE SHARE ANALYSIS OF MOBILE WALLET MARKET FOR RETAIL, BY COUNTRY, 2019 & 2027 (%)
FIGURE 27.COMPARATIVE SHARE ANALYSIS OF MOBILE WALLET MARKET FOR HEALTHCARE, BY COUNTRY, 2019 & 2027 (%)
FIGURE 28.COMPARATIVE SHARE ANALYSIS OF MOBILE WALLET MARKET FOR ENERGY & UTILITIES, BY COUNTRY, 2019 & 2027 (%)
FIGURE 29.COMPARATIVE SHARE ANALYSIS OF MOBILE WALLET MARKET FOR TELECOMMUNICATION, BY COUNTRY, 2019 & 2027 (%)
FIGURE 30.COMPARATIVE SHARE ANALYSIS OF MOBILE WALLET MARKET FOR OTHERS, BY COUNTRY, 2019 & 2027 (%)
FIGURE 31.MOBILE WALLET MARKET, BY END USER, 2019–2027 ($BILLION)
FIGURE 32.COMPARATIVE SHARE ANALYSIS OF MOBILE WALLET MARKET FOR PERSONAL, BY COUNTRY, 2019 & 2027 (%)
FIGURE 33.COMPARATIVE SHARE ANALYSIS OF MOBILE WALLET MARKET FOR BUSINESS, BY COUNTRY, 2019 & 2027 (%)
FIGURE 34.U.S. MOBILE WALLET MARKET, 2019-2027 ($BILLION)
FIGURE 35.CANADA MOBILE WALLET MARKET, 2019-2027 ($BILLION)
FIGURE 36.GERMANY MOBILE WALLET MARKET, 2019-2027 ($BILLION)
FIGURE 37.FRANCE MOBILE WALLET MARKET, 2019-2027 ($BILLION)
FIGURE 38.UK MOBILE WALLET MARKET, 2019-2027 ($BILLION)
FIGURE 39.SPAIN MOBILE WALLET MARKET, 2019-2027 ($BILLION)
FIGURE 40.ITALY MOBILE WALLET MARKET, 2019-2027 ($BILLION)
FIGURE 41.REST OF EUROPE MOBILE WALLET MARKET, 2019-2027 ($BILLION)
FIGURE 42.JAPAN MOBILE WALLET MARKET, 2019-2027 ($BILLION)
FIGURE 43.CHINA MOBILE WALLET MARKET, 2019-2027 ($BILLION)
FIGURE 44.AUSTRALIA MOBILE WALLET MARKET, 2019-2027 ($BILLION)
FIGURE 45.INDIA MOBILE WALLET MARKET, 2019-2027 ($BILLION)
FIGURE 46.SOUTH KOREA MOBILE WALLET MARKET, 2019-2027 ($BILLION)
FIGURE 47.REST OF ASIA-PACIFIC MOBILE WALLET MARKET, 2019-2027 ($BILLION)
FIGURE 48.LAMEA MOBILE WALLET MARKET, BY COUNTRY, 2019-2027 ($BILLION)
FIGURE 49.LATIN AMERICA MOBILE WALLET MARKET, 2019-2027 ($BILLION)
FIGURE 50.MIDDLE EAST MOBILE WALLET MARKET, 2019-2027 ($BILLION)
FIGURE 51.AFRICA MOBILE WALLET MARKET, 2019-2027 ($BILLION)
FIGURE 52.KEY PLAYER POSITIONING ANLYSIS: GLOBAL MOBILE WALLET MARKET
FIGURE 53.TOP WINNING STRATEGIES, BY YEAR, 2017-2020
FIGURE 54.TOP WINNING STRATEGIES, BY DEVELOPMENT, 2017-2020
FIGURE 55.TOP WINNING STRATEGIES, BY COMPANY, 2018-2020
FIGURE 56.COMPETITIVE DASHBOARD
FIGURE 57.COMPETITIVE DASHBOARD
FIGURE 58.COMPETITIVE HEATMAP OF KEY PLAYERS
FIGURE 59.ALIBABA GROUP HOLDING LIMITED: KEY EXECUTIVES
FIGURE 60.ALIBABA GROUP HOLDING LIMITED: REVENUE, 2017–2019 ($BILLION)
FIGURE 61.ALIBABA GROUP HOLDING LIMITED: REVENUE SHARE BY SEGMENT, 2019 (%)
FIGURE 62.AMAZON.COM, INC.: REVENUE, 2017–2019 ($BILLION)
FIGURE 63.AMAZON.COM, INC.: REVENUE SHARE BY SEGMENT, 2019 (%)
FIGURE 64.AMAZON.COM, INC.: REVENUE SHARE BY REGION, 2019 (%)
FIGURE 65.AMERICAN EXPRESS COMPANY: KEY EXECUTIVES
FIGURE 66.AMERICAN EXPRESS COMPANY: REVENUE, 2017–2019 ($BILLION)
FIGURE 67.AMERICAN EXPRESS COMPANY: REVENUE SHARE BY SEGMENT, 2019 (%)
FIGURE 68.AMERICAN EXPRESS COMPANY: REVENUE SHARE BY REGION, 2019 (%)
FIGURE 69.R&D EXPENDITURE, 2017–2019 ($BILLION)
FIGURE 70.APPLE INC.: REVENUE, 2017–2019 ($BILLION)
FIGURE 71.APPLE INC.: REVENUE SHARE BY SEGMENT, 2019 (%)
FIGURE 72.APPLE INC.: REVENUE SHARE BY REGION, 2019 (%)
FIGURE 73.R&D EXPENDITURE, 2017–2019 ($BILLION)
FIGURE 74.AT&T INC.: REVENUE, 2017–2019 ($BILLION)
FIGURE 75.AT&T INC.: REVENUE SHARE BY SEGMENT, 2019 (%)
FIGURE 76.AT&T INC.: REVENUE SHARE BY REGION, 2019 (%)
FIGURE 77.R&D EXPENDITURE, 2017–2019 ($BILLION)
FIGURE 78.ALPHABET INC.: REVENUE, 2017–2019 ($BILLION)
FIGURE 79.ALPHABET INC.: REVENUE SHARE BY SEGMENT, 2019 (%)
FIGURE 80.ALPHABET INC.: REVENUE SHARE BY REGION, 2019 (%)
FIGURE 81.MASTERCARD: REVENUE, 2017–2019 ($BILLION)
FIGURE 82.MASTERCARD: REVENUE SHARE BY REGION, 2019 (%)
FIGURE 83.R&D EXPENDITURE, 2017–2019 ($BILLION)
FIGURE 84.PAYPAL HOLDINGS, INC. : REVENUE, 2017–2019 ($BILLION)
FIGURE 85.PAYPAL HOLDINGS, INC.: REVENUE SHARE BY REGION, 2019 (%)
FIGURE 86.R&D EXPENDITURE, 2017–2019 ($BILLION)
FIGURE 87.SAMSUNG ELECTRONICS CO., LTD.: REVENUE, 2017–2019 ($BILLION)
FIGURE 88.SAMSUNG ELECTRONICS CO., LTD.: REVENUE SHARE BY SEGMENT, 2019 (%)
FIGURE 89.SAMSUNG ELECTRONICS CO., LTD.: REVENUE SHARE BY REGION, 2019 (%)
FIGURE 90.VISA INC.: REVENUE, 2017–2019 ($BILLION)
FIGURE 91.VISA INC.: REVENUE SHARE BY REGION, 2019 (%)
$5769
$8995
HAVE A QUERY?
OUR CUSTOMER
