
Lead Acid Battery Market Overview 2026
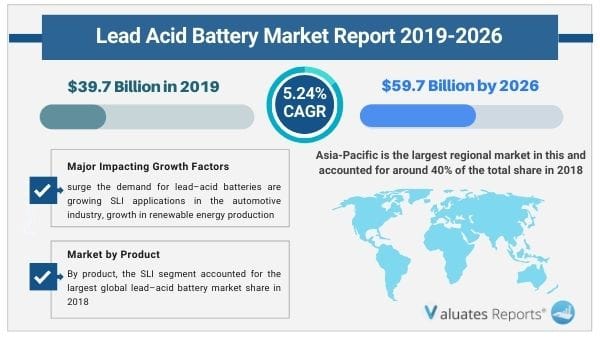
The global lead–acid battery market size was valued at $39.7 billion in 2018 and is projected to reach $59.7 billion by 2026, growing at a CAGR of 5.24% from 2019 to 2026. Key drivers of the lead acid battery market include increasing SLI applications in the automotive industry.
The huge increase in renewable energy production and demand for energy storage devices will fuel the growth of the lead-acid battery industry during the forecast period.
The rapid expansion of the telecom industry and booming need for UPS systems in data centers will drive the growth of the market in the coming years.
Lead Acid Battery Market Trends
Need in the automotive industry
The automobile sector is going through a transformative phase. Lead acid batteries are extensively used in passenger, and commercial vehicles, tractors, and two-wheelers. They are a low-cost option for storing energy and provide efficient recycling opportunities. The batteries are very cheap and have a simple manufacturing process. The power deployment is specific along with a high discharge current. The performance is highly effective in both low and high temperatures. This will boost the growth of the global lead acid battery market in the coming years. There is no additional requirement for cell-wise BMS or blocks. The maintenance is low and service is quite dependable. The technology is relatively mature and the current capacity is huge. They are extremely tolerant of overcharging and a wide range of sizes and specifications are available. It perfectly meets the high current requirement of automobiles.
Energy storage
Lead acid batteries are widely used in energy storage and grid stabilization in renewable energy projects like solar and wind power. The increasing focus on renewable energy sources for meeting ambitious decarbonization targets has put attention toward lead-acid batteries. This will drive the growth of the lead acid battery market in the forthcoming period. These batteries are a crucial part of the overnight storage of solar energy. Specific systems are built with batteries to ensure an uninterrupted power supply. The sulphuric acid reacts with a specific type of lead to produce electricity. The reverse process is charged to create the required acid and lead. They are mass-produced and very cost-effective. Solar or photovoltaic panels are configured with lead-acid batteries to increase their overall efficiency. Certain charging techniques are used to increase the lifespan of the batteries. It is constantly charged to 95% of its maximum limit to prevent overcharging and avoid minimal gassing. The float charge is done at a lower threshold to balance out the cells. Moreover, the batteries are discharged in such a way as to prevent sulphation. The use of lead-acid batteries in wind energy systems is done to improve signal stabilization. The turbine spins at different speeds. The produced electricity should be consistent and stable. The batteries are added in between to stabilize the interconnected network of grids. The charging and discharging activity are done simultaneously. It is specifically done up to a certain threshold in order to increase the charge percentage. The battery acts as the connecting bridge between wind energy and the grid.
Telecom industry
The booming telecommunication networks and rising data complexities have led to the large expansion of data centers. The need for efficient power backup systems in tense centers will drive the growth prospects of the lead acid battery market in the upcoming years. They have an inexpensive design structure and very low operating costs. Lead acid batteries are perfectly suitable for handling the entire telecom load as they have the requisite design standards as per the cabinet size. The cycle of life and ability is deep and high. The batteries are capable of operating in a wide range of temperatures. The maintenance is trouble-free and easily accessible on a remote site. The gassing is minimum with additional leakage and a spillproof system. Furthermore, the technology is easily scalable and compatible with any energy grid storage system.
Benefits of lithium-ion batteries
The advent of lithium-ion batteries has severely restricted the market penetration of lead-acid batteries. This will hamper the growth prospects of the lead acid battery market in the coming years. It has a high discharge and a longer-lasting cycling rate. The lifespan is huge as a normal battery lasts up to 5 years or even more. It is quick and effective and charges faster than other battery systems. They are optimized to work under high-stress situations and suffer no temperature fluctuations or energy depletion. It is extremely lightweight and provides high energy density. The installation is easy and provides enhanced flexibility in comparison to lead-acid batteries.
Lead Acid Battery Market Share Analysis
Based on the product, the SLI segment will be the most lucrative with a market share of 50% due to growing vehicle sales and increasing deployment in the automobile industry. It provides long cycle life and weight reduction. These batteries are cheaper than lithium-ion batteries.
Based on the construction method, the flooded battery segment is expected to maintain dominance in the lead acid battery market share with 85% penetration due to the rising need for diesel-electric submarines as efficient power backup. It is also used in forklift trucks for material handling owing to its cost-effective nature.
Based on application, the automotive segment will witness significant growth with a 60% market share due to increasing sales of electric vehicles and rising demand for cost-effective energy sources.
Based on region, Asia-pacific will grow the highest with a market share of 40% due to rising urbanization, huge population base, and booming production of automobiles and sales. The rising need for UPS systems is also contributing to the growth.
Key Benefits for Stakeholders:
Key Market Segments:
By Product
By Construction Method
By Application
By Region
CHAPTER 1: INTRODUCTION
1.1. Report description
1.2. Key benefits for stakeholders
1.3. Key market segments
1.4. Research methodology
1.4.1. Secondary research
1.4.2. Primary research
1.5. Analyst tools and models
CHAPTER 2: EXECUTIVE SUMMARY
2.1. Key findings of the study
2.2. CXO perspective
CHAPTER 3: MARKET OVERVIEW
3.1. Market definition and scope
3.2. Key findings
3.2.1. Top investment pockets
3.3. Porter’s five forces analysis
3.4. Market dynamics
3.4.1. Drivers
3.4.1.1. Lead acid battery as a cost efficient energy storage solution
3.4.1.2. Recyclability associated with lead-acid batteries over lithium-ion batteries
3.4.2. Restraints
3.4.2.1. Emerging as well as existing alternatives available in the market
3.4.3. Opportunity
3.4.3.1. Need to expand data centers
3.5. Parent Peer Market Overview
3.6. Patent analysis (2015-2018)
3.6.1. Patent analysis by country
3.6.2. Patent analysis by applicant
3.7. Impact of government rules and regulations
3.7.1. Mandatory renewable energy targets
CHAPTER 4: LEAD ACID BATTERY MARKET, BY CONSTRUCTION METHOD
4.1. Overview
4.1.1. Market size and forecast, by region
4.2. Flooded
4.2.1. Market size and forecast, by region
4.2.2. Market share analysis, by country
4.3. Valve Regulated Sealed Lead Acid Battery (VRLA Battery)
4.3.1. Market size and forecast, by region
4.3.2. Market share analysis, by country
CHAPTER 5: LEAD ACID BATTERY MARKET, BY PRODUCT
5.1. Overview
5.1.1. Market size and forecast, by region
5.2. SLI
5.2.1. Market size and forecast, by region
5.2.2. Market share analysis, by country
5.3. Stationary
5.3.1. Market size and forecast, by region
5.3.2. Market share analysis, by country
5.4. Motive
5.4.1. Market size and forecast, by region
5.4.2. Market share analysis, by country
CHAPTER 6: LEAD ACID MARKET, BY APPLICATION
6.1. Overview
6.1.1. Market size and forecast, by region
6.2. Automotive
6.2.1. Market size and forecast, by region
6.2.1.1. Market size and forecast, by automotive applications
6.2.2. Market share analysis, by country
6.3. UPA
6.3.1. Market size and forecast, by region
6.3.2. Market share analysis, by country
6.4. Telecom
6.4.1. Market size and forecast, by region
6.4.2. Market share analysis, by country
6.5. Others
6.5.1. Market size and forecast, by region
6.5.2. Market share analysis, by country
CHAPTER 7: LEAD ACID MARKET, BY REGION
7.1. Overview
7.1.1. Market size and forecast, by region
7.1.2. Market size and forecast, by construction method
7.1.3. Market size and forecast, by product
7.1.4. Market size and forecast, by application
7.1.4.1. Market size and forecast, by automotive application
7.2. North America
7.2.1. Market size and forecast, by construction method
7.2.2. Market size and forecast, by product
7.2.3. Market size and forecast, by application
7.2.3.1. Market size and forecast, by automotive application
7.2.4. Market size and forecast by Country
7.2.5. U.S.
7.2.5.1. Market size and forecast, by construction method
7.2.5.2. Market size and forecast, by product
7.2.5.3. Market size and forecast, by application
7.2.5.3.1. Market size and forecast, by automotive application
7.2.6. Canada
7.2.6.1. Market size and forecast, by construction method
7.2.6.2. Market size and forecast, by product
7.2.6.3. Market size and forecast, by application
7.2.6.3.1. Market size and forecast, by automotive application
7.2.7. Mexico
7.2.7.1. Market size and forecast, by construction method
7.2.7.2. Market size and forecast, by product
7.2.7.3. Market size and forecast, by application
7.2.7.3.1. Market size and forecast, by automotive application
7.3. Europe
7.3.1. Market size and forecast, by construction method
7.3.2. Market size and forecast, by product
7.3.3. Market size and forecast, by application
7.3.3.1. Market size and forecast, by automotive application
7.3.4. Market size and forecast by Country
7.3.5. Germany
7.3.5.1. Market size and forecast, by construction method
7.3.5.2. Market size and forecast, by product
7.3.5.3. Market size and forecast, by application
7.3.5.3.1. Market size and forecast, by automotive application
7.3.6. France
7.3.6.1. Market size and forecast, by construction method
7.3.6.2. Market size and forecast, by product
7.3.6.3. Market size and forecast, by application
7.3.6.3.1. Market size and forecast, by automotive application
7.3.7. Italy
7.3.7.1. Market size and forecast, by construction method
7.3.7.2. Market size and forecast, by product
7.3.7.3. Market size and forecast, by application
7.3.7.3.1. Market size and forecast, by automotive application
7.3.8. Spain
7.3.8.1. Market size and forecast, by construction method
7.3.8.2. Market size and forecast, by product
7.3.8.3. Market size and forecast, by application
7.3.8.3.1. Market size and forecast, by automotive application
7.3.9. UK
7.3.9.1. Market size and forecast, by construction method
7.3.9.2. Market size and forecast, by product
7.3.9.3. Market size and forecast, by application
7.3.9.3.1. Market size and forecast, by automotive application
7.3.10. Rest of Europe
7.3.10.1. Market size and forecast, by construction method
7.3.10.2. Market size and forecast, by product
7.3.10.3. Market size and forecast, by application
7.3.10.3.1. Market size and forecast, by automotive application
7.4. Asia-Pacific
7.4.1. Market size and forecast, by construction method
7.4.2. Market size and forecast, by product
7.4.3. Market size and forecast, by application
7.4.3.1. Market size and forecast, by automotive application
7.4.4. Market size and forecast by Country
7.4.5. China
7.4.5.1. Market size and forecast, by construction method
7.4.5.2. Market size and forecast, by product
7.4.5.3. Market size and forecast, by application
7.4.5.3.1. Market size and forecast, by automotive application
7.4.6. Japan
7.4.6.1. Market size and forecast, by construction method
7.4.6.2. Market size and forecast, by product
7.4.6.3. Market size and forecast, by application
7.4.6.3.1. Market size and forecast, by automotive application
7.4.7. India
7.4.7.1. Market size and forecast, by construction method
7.4.7.2. Market size and forecast, by product
7.4.7.3. Market size and forecast, by application
7.4.7.3.1. Market size and forecast, by automotive application
7.4.8. South Korea
7.4.8.1. Market size and forecast, by construction method
7.4.8.2. Market size and forecast, by product
7.4.8.3. Market size and forecast, by application
7.4.8.3.1. Market size and forecast, by automotive application
7.4.9. Australia
7.4.9.1. Market size and forecast, by construction method
7.4.9.2. Market size and forecast, by product
7.4.9.3. Market size and forecast, by application
7.4.9.3.1. Market size and forecast, by automotive application
7.4.10. Rest of Asia-Pacific
7.4.10.1. Market size and forecast, by construction method
7.4.10.2. Market size and forecast, by product
7.4.10.3. Market size and forecast, by application
7.4.10.3.1. Market size and forecast, by automotive application
7.5. LAMEA
7.5.1. Market size and forecast, by construction method
7.5.2. Market size and forecast, by product
7.5.3. Market size and forecast, by application
7.5.3.1. Market size and forecast, by automotive application
7.5.4. Market size and forecast by Country
7.5.5. Brazil
7.5.5.1. Market size and forecast, by construction method
7.5.5.2. Market size and forecast, by product
7.5.5.3. Market size and forecast, by application
7.5.5.3.1. Market size and forecast, by automotive application
7.5.6. Saudi Arabia
7.5.6.1. Market size and forecast, by construction method
7.5.6.2. Market size and forecast, by product
7.5.6.3. Market size and forecast, by application
7.5.6.3.1. Market size and forecast, by automotive application
7.5.7. UAE
7.5.7.1. Market size and forecast, by construction method
7.5.7.2. Market size and forecast, by product
7.5.7.3. Market size and forecast, by application
7.5.7.3.1. Market size and forecast, by automotive application
7.5.8. South Africa
7.5.8.1. Market size and forecast, by construction method
7.5.8.2. Market size and forecast, by product
7.5.8.3. Market size and forecast, by application
7.5.8.3.1. Market size and forecast, by automotive application
7.5.9. Rest of LAMEA
7.5.9.1. Market size and forecast, by construction method
7.5.9.2. Market size and forecast, by product
7.5.9.3. Market size and forecast, by application
7.5.9.3.1. Market size and forecast, by automotive application
CHAPTER 8: COMPETITIVE LANDSCAPE
8.1. INTRODUCTION
8.1.1. MARKET PLAYER POSITIONING, 2018
8.2. TOP WINNING STRATEGIES
8.2.1. Top winning strategies, by year
8.2.2. Top winning strategies, by development
8.2.3. Top winning strategies, by company
8.3. PRODUCT MAPPING OF TOP 10 PLAYER
8.4. COMPETITIVE HEATMAP
8.5. KEY DEVELOPMENTS
8.5.1. New product launches
8.5.2. Expansions
8.5.3. Acquisition
8.5.4. Agreement
8.5.5. Joint Ventures
CHAPTER 9: COMPANY PROFILES:
9.1. Accumulatorenwerke HOPPECKE Carl Zoellner & Sohn GmbH
9.1.1. Company overview
9.1.2. Company snapshot
9.1.3. Product portfolio
9.1.4. Key strategic moves and developments
9.2. C&D Technologies Inc.
9.2.1. Company overview
9.2.2. Company snapshot
9.2.3. Product portfolio
9.3. East Penn Manufacturing Company
9.3.1. Company overview
9.3.2. Company snapshot
9.3.3. Product portfolio
9.3.4. Key strategic moves and developments
9.4. Enersys
9.4.1. Company overview
9.4.2. Company snapshot
9.4.3. Operating business segments
9.4.4. Product portfolio
9.4.5. Business performance
9.5. Exide Industries Limited
9.5.1. Company overview
9.5.2. Company snapshot
9.5.3. Product portfolio
9.5.4. Business performance
9.5.5. Key strategic moves and developments
9.6. GS Yuasa Corporation
9.6.1. Company overview
9.6.2. Company snapshot
9.6.3. Operating business segments
9.6.4. Product portfolio
9.6.5. Business performance
9.6.6. Key strategic moves and developments
9.7. Hankook AtlasBX Co. Ltd.
9.7.1. Company overview
9.7.2. Company snapshot
9.7.3. Product portfolio
9.7.4. Business performance
9.7.5. Key strategic moves and developments
9.8. HBL Power Systems Ltd.
9.8.1. Company overview
9.8.2. Company snapshot
9.8.3. Product portfolio
9.8.4. Operating business segments
9.8.5. Business performance
9.9. Hitachi Chemical Co. Ltd.
9.9.1. Company overview
9.9.2. Company snapshot
9.9.3. Operating business segments
9.9.4. Product portfolio
9.9.5. Business performance
9.9.6. Key strategic moves and developments
9.10. Teledyne Technologies Inc.
9.10.1. Company overview
9.10.2. Company snapshot
9.10.3. Operating business segments
9.10.4. Product portfolio
9.10.5. Business performance
LIST OF TABLES
TABLE 01. GLOBAL LEAD ACID BATTERY MARKET REVENUE, BY CONSTRUCTION METHOD ($MILLION) (2019-2026)
TABLE 02. GLOBAL LEAD ACID BATTERY MARKET, BY CONSTRUCTION METHOD 2018–2026 ($MILLION)
TABLE 03. GLOBAL LEAD ACID BATTERY MARKET FOR FLOODED BATTERY, BY REGION, 2018–2026 ($MILLION)
TABLE 04. GLOBAL LEAD ACIDBATTERY MARKET FOR VRLA, BY REGION, 2018–2026 ($MILLION)
TABLE 05. GLOBAL LEAD ACID BATTERY MARKET REVENUE, BY PRODUCT ($MILLION) (2019-2026)
TABLE 06. GLOBAL LEAD ACID BATTERY MARKET, BY PRODUCT 2018–2026 ($MILLION)
TABLE 07. GLOBAL LEAD ACID BATTERY MARKET FOR SLI, BY REGION, 2018–2026 ($MILLION)
TABLE 08. GLOBAL LEAD ACID BATTERY MARKET FOR STATIONARY, BY REGION, 2018–2026 ($MILLION)
TABLE 09. GLOBAL LEAD ACID BATTERY MARKET FOR MOTIVE, BY REGION, 2018–2026 ($MILLION)
TABLE 10. GLOBAL LEAD ACID BATTERY MARKET REVENUE, BY APPLICATION ($MILLION) (2019-2026)
TABLE 11. GLOBAL LEAD ACID BATTERY MARKET, BY APPLICATION 2018–2026 ($MILLION)
TABLE 12. GLOBAL LEAD ACID BATTERY MARKET FOR AUTOMOTIVE, BY REGION, 2018–2026 ($MILLION)
TABLE 13. GLOBAL LEAD ACID BATTERY MARKET FOR AUTOMOTIVEAPPLICATIONS, 2018–2026 ($MILLION)
TABLE 14. GLOBAL LEAD ACID BATTERY MARKET FOR UPA, BY REGION, 2018–2026 ($MILLION)
TABLE 15. GLOBAL LEAD ACID BATTERY MARKET FOR TELECOM, BY REGION, 2018–2026 ($MILLION)
TABLE 16. GLOBAL LEAD ACID BATTERY MARKET FOR OTHERS, BY REGION, 2018–2026 ($MILLION)
TABLE 17. GLOBAL LEAD ACID BATTERY MARKET, BY REGION 2018–2026 ($MILLION)
TABLE 18. GLOBAL LEAD ACID BATTERY MARKET, BY CONSTRUCTION METHOD 2018–2026 ($MILLION)
TABLE 19. GLOBAL LEAD ACID BATTERY MARKET, BY PRODUCT 2018–2026 ($MILLION)
TABLE 20. GLOBAL LEAD ACID BATTERY MARKET, BY APPLICATION 2018–2026 ($MILLION)
TABLE 21. GLOBAL LEAD ACID BATTERY MARKET, BY AUTOMOTIVE APPLICATION 2018–2026 ($MILLION)
TABLE 22. NORTH AMERICA LEAD ACID BATTERY MARKET, BY CONSTRUCTION METHOD 2018–2026 ($MILLION)
TABLE 23. NORTH AMERICA LEAD ACID BATTERY MARKET, BY PRODUCT 2018–2026 ($MILLION)
TABLE 24. NORTH AMERICA LEAD ACID BATTERY MARKET, BY APPLICATION 2018–2026 ($MILLION)
TABLE 25. NORTH AMERICA LEAD ACID BATTERY MARKET, BY AUTOMOTIVE APPLICATION 2018–2026 ($MILLION)
TABLE 26. NORTH AMERICA LEAD ACID BATTERY MARKET, BY COUNTRY 2018–2026 ($MILLION)
TABLE 27. U.S. LEAD ACID BATTERY MARKET, BY CONSTRUCTION METHOD 2018–2026 ($MILLION)
TABLE 28. U.S. LEAD ACID BATTERY MARKET, BY PRODUCT 2018–2026 ($MILLION)
TABLE 29. U.S. LEAD ACID BATTERY MARKET, BY APPLICATION 2018–2026 ($MILLION)
TABLE 30. U.S. LEAD ACID BATTERY MARKET, BY AUTOMOTIVE APPLICATION 2018–2026 ($MILLION)
TABLE 31. CANADA LEAD ACID BATTERY MARKET, BY CONSTRUCTION METHOD 2018–2026 ($MILLION)
TABLE 32. CANADA LEAD ACID BATTERY MARKET, BY PRODUCT 2018–2026 ($MILLION)
TABLE 33. CANADA LEAD ACID BATTERY MARKET, BY APPLICATION 2018–2026 ($MILLION)
TABLE 34. CANADA LEAD ACID BATTERY MARKET, BY AUTOMOTIVE APPLICATION 2018–2026 ($MILLION)
TABLE 35. MEXICO LEAD ACID BATTERY MARKET, BY CONSTRUCTION METHOD 2018–2026 ($MILLION)
TABLE 36. MEXICO LEAD ACID BATTERY MARKET, BY PRODUCT 2018–2026 ($MILLION)
TABLE 37. MEXICO LEAD ACID BATTERY MARKET, BY APPLICATION 2018–2026 ($MILLION)
TABLE 38. MEXICO LEAD ACID BATTERY MARKET, BY AUTOMOTIVE APPLICATION 2018–2026 ($MILLION)
TABLE 39. INDUSTRIAL MANUFACTURING OUTPUT IN THE LEADING EUROPEAN COUNTRIES ($BILLION)(2017)
TABLE 40. EUROPE LEAD ACID BATTERY MARKET, BY CONSTRUCTION METHOD 2018–2026 ($MILLION)
TABLE 41. EUROPE LEAD ACID BATTERY MARKET, BY PRODUCT 2018–2026 ($MILLION)
TABLE 42. EUROPE LEAD ACID BATTERY MARKET, BY APPLICATION 2018–2026 ($MILLION)
TABLE 43. EUROPE LEAD ACID BATTERY MARKET, BY AUTOMOTIVE APPLICATION 2018–2026 ($MILLION)
TABLE 44. EUROPE LEAD ACID BATTERY MARKET, BY COUNTRY 2018–2026 ($MILLION)
TABLE 45. GERMANY LEAD ACID BATTERY MARKET, BY CONSTRUCTION METHOD 2018–2026 ($MILLION)
TABLE 46. GERMANY LEAD ACID BATTERY MARKET, BY PRODUCT 2018–2026 ($MILLION)
TABLE 47. GERMANY LEAD ACID BATTERY MARKET, BY APPLICATION 2018–2026 ($MILLION)
TABLE 48. GERMANY LEAD ACID BATTERY MARKET, BY AUTOMOTIVE APPLICATION 2018–2026 ($MILLION)
TABLE 49. FRANCE LEAD ACID BATTERY MARKET, BY CONSTRUCTION METHOD 2018–2026 ($MILLION)
TABLE 50. FRANCE LEAD ACID BATTERY MARKET, BY PRODUCT 2018–2026 ($MILLION)
TABLE 51. FRANCE LEAD ACID BATTERY MARKET, BY APPLICATION 2018–2026 ($MILLION)
TABLE 52. FRANCE LEAD ACID BATTERY MARKET, BY AUTOMOTIVE APPLICATION 2018–2026 ($MILLION)
TABLE 53. ITALY LEAD ACID BATTERY MARKET, BY CONSTRUCTION METHOD 2018–2026 ($MILLION)
TABLE 54. ITALY LEAD ACID BATTERY MARKET, BY PRODUCT 2018–2026 ($MILLION)
TABLE 55. ITALY LEAD ACID BATTERY MARKET, BY APPLICATION 2018–2026 ($MILLION)
TABLE 56. ITALY LEAD ACID BATTERY MARKET, BY AUTOMOTIVE APPLICATION 2018–2026 ($MILLION)
TABLE 57. SPAIN LEAD ACID BATTERY MARKET, BY CONSTRUCTION METHOD 2018–2026 ($MILLION)
TABLE 58. SPAIN LEAD ACID BATTERY MARKET, BY PRODUCT 2018–2026 ($MILLION)
TABLE 59. SPAIN LEAD ACID BATTERY MARKET, BY APPLICATION 2018–2026 ($MILLION)
TABLE 60. SPAIN LEAD ACID BATTERY MARKET, BY AUTOMOTIVE APPLICATION 2018–2026 ($MILLION)
TABLE 61. UK LEAD ACID BATTERY MARKET, BY CONSTRUCTION METHOD 2018–2026 ($MILLION)
TABLE 62. UK LEAD ACID BATTERY MARKET, BY PRODUCT 2018–2026 ($MILLION)
TABLE 63. UK LEAD ACID BATTERY MARKET, BY APPLICATION 2018–2026 ($MILLION)
TABLE 64. UK LEAD ACID BATTERY MARKET, BY AUTOMOTIVE APPLICATION 2018–2026 ($MILLION)
TABLE 65. REST OF EUROPE LEAD ACID BATTERY MARKET, BY CONSTRUCTION METHOD 2018–2026 ($MILLION)
TABLE 66. REST OF EUROPE LEAD ACID BATTERY MARKET, BY PRODUCT 2018–2026 ($MILLION)
TABLE 67. REST OF EUROPE LEAD ACID BATTERY MARKET, BY APPLICATION 2018–2026 ($MILLION)
TABLE 68. REST OF EUROPE LEAD ACID BATTERY MARKET, BY AUTOMOTIVE APPLICATION 2018–2026 ($MILLION)
TABLE 69. ASIA-PACIFIC LEAD ACID BATTERY MARKET, BY CONSTRUCTION METHOD 2018–2026 ($MILLION)
TABLE 70. ASIA-PACIFIC LEAD ACID BATTERY MARKET, BY PRODUCT 2018–2026 ($MILLION)
TABLE 71. ASIA-PACIFIC LEAD ACID BATTERY MARKET, BY APPLICATION 2018–2026 ($MILLION)
TABLE 72. ASIA-PACIFIC LEAD ACID BATTERY MARKET, BY AUTOMOTIVE APPLICATION 2018–2026 ($MILLION)
TABLE 73. ASIA-PACIFIC LEAD ACID BATTERY MARKET, BY COUNTRY 2018–2026 ($MILLION)
TABLE 74. CHINA LEAD ACID BATTERY MARKET, BY CONSTRUCTION METHOD 2018–2026 ($MILLION)
TABLE 75. CHINA LEAD ACID BATTERY MARKET, BY PRODUCT 2018–2026 ($MILLION)
TABLE 76. CHINA LEAD ACID BATTERY MARKET, BY APPLICATION 2018–2026 ($MILLION)
TABLE 77. CHINA LEAD ACID BATTERY MARKET, BY AUTOMOTIVE APPLICATION 2018–2026 ($MILLION)
TABLE 78. JAPAN LEAD ACID BATTERY MARKET, BY CONSTRUCTION METHOD 2018–2026 ($MILLION)
TABLE 79. JAPAN LEAD ACID BATTERY MARKET, BY PRODUCT 2018–2026 ($MILLION)
TABLE 80. JAPAN LEAD ACID BATTERY MARKET, BY APPLICATION 2018–2026 ($MILLION)
TABLE 81. JAPAN LEAD ACID BATTERY MARKET, BY AUTOMOTIVE APPLICATION 2018–2026 ($MILLION)
TABLE 82. INDIA LEAD ACID BATTERY MARKET, BY CONSTRUCTION METHOD 2018–2026 ($MILLION)
TABLE 83. INDIA LEAD ACID BATTERY MARKET, BY PRODUCT 2018–2026 ($MILLION)
TABLE 84. INDIA LEAD ACID BATTERY MARKET, BY APPLICATION 2018–2026 ($MILLION)
TABLE 85. INDIA LEAD ACID BATTERY MARKET, BY AUTOMOTIVE APPLICATION 2018–2026 ($MILLION)
TABLE 86. SOUTH KOREA LEAD ACID BATTERY MARKET, BY CONSTRUCTION METHOD 2018–2026 ($MILLION)
TABLE 87. SOUTH KOREA LEAD ACID BATTERY MARKET, BY PRODUCT 2018–2026 ($MILLION)
TABLE 88. SOUTH KOREA LEAD ACID BATTERY MARKET, BY APPLICATION 2018–2026 ($MILLION)
TABLE 89. SOUTH KOREA LEAD ACID BATTERY MARKET, BY AUTOMOTIVE APPLICATION 2018–2026 ($MILLION)
TABLE 90. AUSTRALIA LEAD ACID BATTERY MARKET, BY CONSTRUCTION METHOD 2018–2026 ($MILLION)
TABLE 91. AUSTRALIA LEAD ACID BATTERY MARKET, BY PRODUCT 2018–2026 ($MILLION)
TABLE 92. AUSTRALIA LEAD ACID BATTERY MARKET, BY APPLICATION 2018–2026 ($MILLION)
TABLE 93. AUSTRALIA LEAD ACID BATTERY MARKET, BY AUTOMOTIVE APPLICATION 2018–2026 ($MILLION)
TABLE 94. REST OF ASIA-PACIFIC LEAD ACID BATTERY MARKET, BY CONSTRUCTION METHOD 2018–2026 ($MILLION)
TABLE 95. REST OF ASIA-PACIFIC LEAD ACID BATTERY MARKET, BY PRODUCT 2018–2026 ($MILLION)
TABLE 96. REST OF ASIA-PACIFIC LEAD ACID BATTERY MARKET, BY APPLICATION 2018–2026 ($MILLION)
TABLE 97. REST OF ASIA-PACIFIC LEAD ACID BATTERY MARKET, BY AUTOMOTIVE APPLICATION 2018–2026 ($MILLION)
TABLE 98. LAMEA LEAD ACID BATTERY MARKET, BY CONSTRUCTION METHOD 2018–2026 ($MILLION)
TABLE 99. LAMEA LEAD ACID BATTERY MARKET, BY PRODUCT 2018–2026 ($MILLION)
TABLE 100. LAMEA LEAD ACID BATTERY MARKET, BY APPLICATION 2018–2026 ($MILLION)
TABLE 101. LAMEA LEAD ACID BATTERY MARKET, BY AUTOMOTIVE APPLICATION 2018–2026 ($MILLION)
TABLE 102. LAMEA LEAD ACID BATTERY MARKET, BY COUNTRY 2018–2026 ($MILLION)
TABLE 103. BRAZIL LEAD ACID BATTERY MARKET, BY CONSTRUCTION METHOD 2018–2026 ($MILLION)
TABLE 104. BRAZIL LEAD ACID BATTERY MARKET, BY PRODUCT 2018–2026 ($MILLION)
TABLE 105. BRAZIL LEAD ACID BATTERY MARKET, BY APPLICATION 2018–2026 ($MILLION)
TABLE 106. BRAZIL LEAD ACID BATTERY MARKET, BY AUTOMOTIVE APPLICATION 2018–2026 ($MILLION)
TABLE 107. SAUDI ARABIA LEAD ACID BATTERY MARKET, BY CONSTRUCTION METHOD 2018–2026 ($MILLION)
TABLE 108. SAUDI ARABIA LEAD ACID BATTERY MARKET, BY PRODUCT 2018–2026 ($MILLION)
TABLE 109. SAUDI ARABIA LEAD ACID BATTERY MARKET, BY APPLICATION 2018–2026 ($MILLION)
TABLE 110. SAUDI ARABIA LEAD ACID BATTERY MARKET, BY AUTOMOTIVE APPLICATION 2018–2026 ($MILLION)
TABLE 111. UAE LEAD ACID BATTERY MARKET, BY CONSTRUCTION METHOD 2018–2026 ($MILLION)
TABLE 112. UAE LEAD ACID BATTERY MARKET, BY PRODUCT 2018–2026 ($MILLION)
TABLE 113. UAE LEAD ACID BATTERY MARKET, BY APPLICATION 2018–2026 ($MILLION)
TABLE 114. UAE LEAD ACID BATTERY MARKET, BY AUTOMOTIVE APPLICATION 2018–2026 ($MILLION)
TABLE 115. SOUTH AFRICA LEAD ACID BATTERY MARKET, BY CONSTRUCTION METHOD 2018–2026 ($MILLION)
TABLE 116. SOUTH AFRICA LEAD ACID BATTERY MARKET, BY PRODUCT 2018–2026 ($MILLION)
TABLE 117. SOUTH AFRICA LEAD ACID BATTERY MARKET, BY APPLICATION 2018–2026 ($MILLION)
TABLE 118. SOUTH AFRICA LEAD ACID BATTERY MARKET, BY AUTOMOTIVE APPLICATION 2018–2026 ($MILLION)
TABLE 119. REST OF LAMEA LEAD ACID BATTERY MARKET, BY CONSTRUCTION METHOD 2018–2026 ($MILLION)
TABLE 120. REST OF LAMEA LEAD ACID BATTERY MARKET, BY PRODUCT 2018–2026 ($MILLION)
TABLE 121. REST OF LAMEA LEAD ACID BATTERY MARKET, BY APPLICATION 2018–2026 ($MILLION)
TABLE 122. REST OF LAMEA LEAD ACID BATTERY MARKET, BY AUTOMOTIVE APPLICATION 2018–2026 ($MILLION)
TABLE 123. KEY NEW PRODUCT LAUNCHES (2016-2019)
TABLE 124. KEY EXPANSIONS (2016-2019)
TABLE 125. KEY ACQUISITION (2016-2019)
TABLE 126. KEY AGREEMENT (2016-2019)
TABLE 127. KEY JOINT VETURE (2016-2019)
TABLE 128. HOPPECKE: COMPANY SNAPSHOT
TABLE 129. HOPPECKE: PRODUCT PORTFOLIO
TABLE 130. HOPPECKE: KEY STRATEGIC MOVES AND DEVELOPMENTS
TABLE 131. C&D TECHNOLOGIES INC.: COMPANY SNAPSHOT
TABLE 132. C&D TECHNOLOGIES INC.: PRODUCT PORTFOLIO
TABLE 133. EAST PENN: COMPANY SNAPSHOT
TABLE 134. EAST PENN: PRODUCT PORTFOLIO
TABLE 135. EAST PENN: KEY STRATEGIC MOVES AND DEVELOPMENTS
TABLE 136. ENERSYS: COMPANY SNAPSHOT
TABLE 137. ENERSYS: OPERATING SEGMENTS
TABLE 138. ENERSYS: PRODUCT PORTFOLIO
TABLE 139. OVERALL FINANCIAL STATUS ($MILLION)
TABLE 140. EXIDE: COMPANY SNAPSHOT
TABLE 141. EXIDE: PRODUCT PORTFOLIO
TABLE 142. OVERALL FINANCIAL STATUS ($MILLION)
TABLE 143. EXIDE: KEY STRATEGIC MOVES AND DEVELOPMENTS
TABLE 144. GS YUASA CORPORATION: COMPANY SNAPSHOT
TABLE 145. GS YUASA CORPORATION: OPERATING SEGMENTS
TABLE 146. GS YUASA CORPORATION: PRODUCT PORTFOLIO
TABLE 147. OVERALL FINANCIAL STATUS ($MILLION)
TABLE 148. GS YUASA CORPORATION: KEY STRATEGIC MOVES AND DEVELOPMENTS
TABLE 149. HANKOOK ALTASBX CO. LTD.: COMPANY SNAPSHOT
TABLE 150. HANKOOK ALTASBX CO. LTD.: PRODUCT PORTFOLIO
TABLE 151. OVERALL FINANCIAL STATUS ($MILLION)
TABLE 152. HANKOOK ALTASBX CO. LTD.: KEY STRATEGIC MOVES AND DEVELOPMENTS
TABLE 153. HBL: COMPANY SNAPSHOT
TABLE 154. HBL: PRODUCT PORTFOLIO
TABLE 155. HBL: OPERATING SEGMENTS
TABLE 156. OVERALL FINANCIAL STATUS ($MILLION)
TABLE 157. HITACHI CHEMICAL CO. LTD. : COMPANY SNAPSHOT
TABLE 158. HITACHI CHEMICAL CO. LTD. : OPERATING SEGMENTS
TABLE 159. HITACHI CHEMICAL CO. LTD. : PRODUCT PORTFOLIO
TABLE 160. OVERALL FINANCIAL STATUS ($MILLION)
TABLE 161. HITACHI CHEMICAL CO. LTD. : KEY STRATEGIC MOVES AND DEVELOPMENTS
TABLE 162. TELEDYNE TECHNOLOGIES INC.: COMPANY SNAPSHOT
TABLE 163. TELEDYNE TECHNOLOGIES INC.: OPERATING SEGMENTS
TABLE 164. TELEDYNE TECHNOLOGIES INC.: PRODUCT PORTFOLIO
TABLE 165. OVERALL FINANCIAL STATUS ($MILLION)
LIST OF FIGURES
FIGURE 01. GLOBAL LEAD ACID BATTERY MARKET SEGMENTATION
FIGURE 02. TOP INVESTMENT POCKETS, BY
FIGURE 03. LOW BARGAINING POWER OF SUPPLIERS
FIGURE 04. HIGH BARGAINING POWER OF BUYERS
FIGURE 05. MODERATE THREAT OF NEW ENTRANTS
FIGURE 06. HIGH THREAT OF SUBSTITUTES
FIGURE 07. HIGH INTENSITY OF COMPETITIVE RIVALRY
FIGURE 08. LEAD ACID BATTERY MARKET DYNAMICS
FIGURE 09. PARENT PEER MARKET
FIGURE 10. PATENT ANALYSIS, BY COUNTRY
FIGURE 11. PATENT ANALYSIS, BY APPLICANT
FIGURE 12. COMPARATIVE SHARE ANALYSIS OF LEAD ACIDBATTERY MARKET FOR FLOODED BATTERY, BY COUNTRY, 2018 & 2026 ($MILLION)
FIGURE 13. COMPARATIVE SHARE ANALYSIS OF LEAD ACIDBATTERY MARKET FOR VRLA, BY COUNTRY, 2018 & 2026 ($MILLION)
FIGURE 14. COMPARATIVE SHARE ANALYSIS OF LEAD ACID BATTERY MARKET FOR SLI, BY COUNTRY, 2018 & 2026 ($MILLION)
FIGURE 15. COMPARATIVE SHARE ANALYSIS OF LEAD ACID BATTERY MARKET FOR STATIONARY, BY COUNTRY, 2018 & 2026 ($MILLION)
FIGURE 16. COMPARATIVE SHARE ANALYSIS OF MOTIVEBATTERY MARKET FOR SLI, BY COUNTRY, 2018 & 2026 ($MILLION)
FIGURE 17. COMPARATIVE SHARE ANALYSIS OF LEAD ACID BATTERY MARKET FOR AUTOMOTIVE, BY COUNTRY, 2018 & 2026 ($MILLION)
FIGURE 18. COMPARATIVE SHARE ANALYSIS OF LEAD ACID BATTERY MARKET FOR UPA, BY COUNTRY, 2018 & 2026 ($MILLION)
FIGURE 19. COMPARATIVE SHARE ANALYSIS OF LEAD ACID BATTERY MARKET FOR TELECOM, BY COUNTRY, 2018 & 2026 ($MILLION)
FIGURE 20. COMPARATIVE SHARE ANALYSIS OF LEAD ACID BATTERY MARKET FOR OTHERS, BY COUNTRY, 2018 & 2026 ($MILLION)
FIGURE 21. U.S. REVENUE FOR LEAD ACID BATTERIES ($MILLION) (2018-2026)
FIGURE 22. CANADA REVENUE FOR LEAD ACID BATTERIES ($MILLION) (2018-2026)
FIGURE 23. MEXICO REVENUE FOR LEAD ACID BATTERIES ($MILLION) (2018-2026)
FIGURE 24. GERMANY REVENUE FOR LEAD ACID BATTERIES ($MILLION) (2018-2026)
FIGURE 25. FRANCE REVENUE FOR LEAD ACID BATTERIES ($MILLION) (2018-2026)
FIGURE 26. ITALY REVENUE FOR LEAD ACID BATTERIES ($MILLION) (2018-2026)
FIGURE 27. SPAIN REVENUE FOR LEAD ACID BATTERIES ($MILLION) (2018-2026)
FIGURE 28. UK REVENUE FOR LEAD ACID BATTERIES ($MILLION) (2018-2026)
FIGURE 29. REST OF EUROPE REVENUE FOR LEAD ACID BATTERIES ($MILLION) (2018-2026)
FIGURE 30. CHINA REVENUE FOR LEAD ACID BATTERIES ($MILLION) (2018-2026)
FIGURE 31. JAPAN REVENUE FOR LEAD ACID BATTERIES ($MILLION) (2018-2026)
FIGURE 32. INDIA REVENUE FOR LEAD ACID BATTERIES ($MILLION) (2018-2026)
FIGURE 33. SOUTH KOREA REVENUE FOR LEAD ACID BATTERIES ($MILLION) (2018-2026)
FIGURE 34. AUSTRALIA REVENUE FOR LEAD ACID BATTERIES ($MILLION) (2018-2026)
FIGURE 35. REST OF ASIA-PACIFIC REVENUE FOR LEAD ACID BATTERIES ($MILLION) (2018-2026)
FIGURE 36. BRAZIL REVENUE FOR LEAD ACID BATTERIES ($MILLION) (2018-2026)
FIGURE 37. SAUDI ARABIA REVENUE FOR LEAD ACID BATTERIES ($MILLION) (2018-2026)
FIGURE 38. UAE REVENUE FOR LEAD ACID BATTERIES ($MILLION) (2018-2026)
FIGURE 39. SOUTH AFRICA REVENUE FOR LEAD ACID BATTERIES ($MILLION) (2018-2026)
FIGURE 40. SOUTH AFRICA REVENUE FOR LEAD ACID BATTERIES ($MILLION) (2018-2026)
FIGURE 41. MARKET PLAYER POSITIONING, 2018
FIGURE 42. TOP WINNING STRATEGIES, BY YEAR, 2016–2019
FIGURE 43. TOP WINNING STRATEGIES, BY DEVELOPMENT, 2016–2019 (%)
FIGURE 44. TOP WINNING STRATEGIES, BY COMPANY, 2016–2019
FIGURE 45. PRODUCT MAPPING OF TOP 10 PLAYERS
FIGURE 46. COMPETITIVE HEATMAP OF KEY PLAYERS
FIGURE 47. ENERSYS: REVENUE, 2016–2018 ($MILLION)
FIGURE 48. ENERSYS: REVENUE SHARE BY SEGMENT, 2018 (%)
FIGURE 49. ENERSYS: REVENUE SHARE BY REGION, 2018 (%)
FIGURE 50. EXIDE: NET SALES, 2016–2018 ($MILLION)
FIGURE 51. EXIDE: REVENUE SHARE BY REGION, 2018 (%)
FIGURE 52. GS YUASA CORPORATION: REVENUE, 2016–2018 ($MILLION)
FIGURE 53. GS YUASA CORPORATION: REVENUE SHARE BY SEGMENT, 2018 (%)
FIGURE 54. GS YUASA CORPORATION: REVENUE SHARE BY REGION, 2018 (%)
FIGURE 55. HANKOOK ALTASBX CO. LTD.: NET SALES, 2016–2018 ($MILLION)
FIGURE 56. HBL: NET SALES, 2016–2018 ($MILLION)
FIGURE 57. HBL: REVENUE SHARE BY SEGMENT, 2018 (%)
FIGURE 58. HBL: REVENUE SHARE BY REGION, 2018 (%)
FIGURE 59. HITACHI CHEMICAL CO. LTD. : REVENUE, 2016–2018 ($MILLION)
FIGURE 60. HITACHI CHEMICAL CO. LTD: REVENUE SHARE BY SEGMENT, 2018 (%)
FIGURE 61. HITACHI CHEMICAL CO. LTD.: REVENUE SHARE BY REGION, 2018 (%)
FIGURE 62. TELEDYNE TECHNOLOGIES INC.: REVENUE, 2016–2018 ($MILLION)
FIGURE 63. TELEDYNE TECHNOLOGIES INC.: REVENUE SHARE BY SEGMENT, 2018 (%)
FIGURE 64. TELEDYNE TECHNOLOGIES INC.: REVENUE SHARE BY REGION, 2018 (%)
$5370
$8995
HAVE A QUERY?
OUR CUSTOMER

SIMILAR REPORTS