
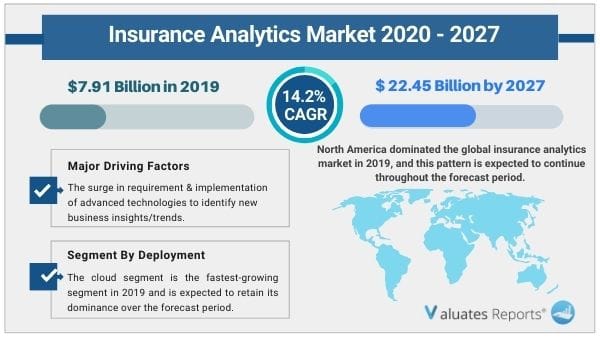
The global insurance analytics market size was valued at USD 7.91 billion in 2019, and is projected to reach USD 22.45 billion by 2027, growing at a CAGR of 14.2% from 2020 to 2027. In the wake of COVID-19 global health crisis, the insurance analytics market is largely impacted, as insurers are heavily relying on the analytical tools for business optimization and developing existing business models to insure better services to the policyholders. In addition, with the help of analytical tools, insurers are able to predict risk factors, executing claims management strategies, forecasting sales, among others, which therefore boosting the market growth during the pandemic situation.
Insurance analytics is widely used for controlling risk in underwriting, pricing, rating, claims, marketing, and reserving in the insurance sector. In addition, this analytic solution helps insurance companies to manage risks & offer better insurance contracts in fields such as health, life, and property or casualty. Furthermore, the key role of this insurance analytics is to reduce costs, optimize customer relationship processes and use predictive analytics in insurance models to create reliable reports across several product lines.
With growth in competition in the insurance sector, demand for analytics solutions is on the rise to sustain in stiff competition across the global market. In addition, surge in requirement & implementation of advanced technologies to provide integrated & value-added services to customers and reduce operational cost, therefore, propels the insurance analytics market growth.
However, stringent government regulations and security & data privacy concerns are some of the factors that limit the market growth. Furthermore, developing economies offer significant opportunities for insurance analytics solution providers to expand & develop their offerings, especially among emerging economies such as Australia, China, India, Singapore, and South Korea. In addition, increase in fraudulent activities are expected to boost demand for insurance analytics solutions in the upcoming years.
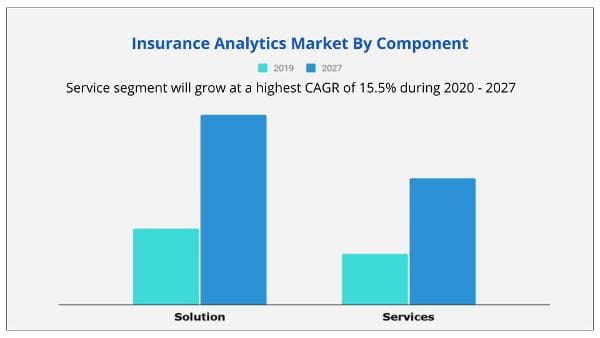
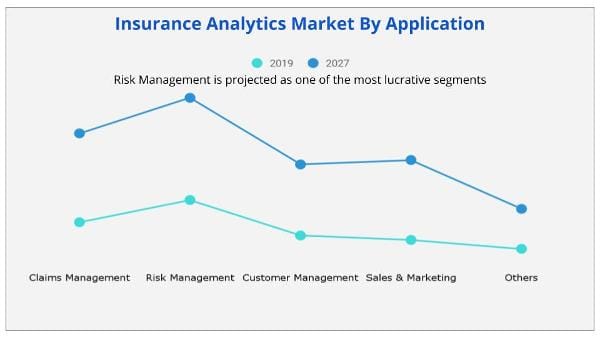
The service segment is projected to maintain its dominance during the insurance analytics market forecast period. This is attributed to the fact that insurance analytics covers a wide range of services such as claims analytics services, subrogation analytics, and fraud & customer analytics services. In addition, these services help insurance agents identify actual perils covered in insurance, promotes cross-selling & upselling, which leads to more sales.
The report focuses on growth prospects, restraints, and trends of the insurance analytics market analysis. The study provides Porter’s five forces analysis to understand the impact of various factors such as bargaining power of suppliers, competitive intensity of competitors, threat of new entrants, threat of substitutes, and bargaining power of buyers on the insurance analytics market.
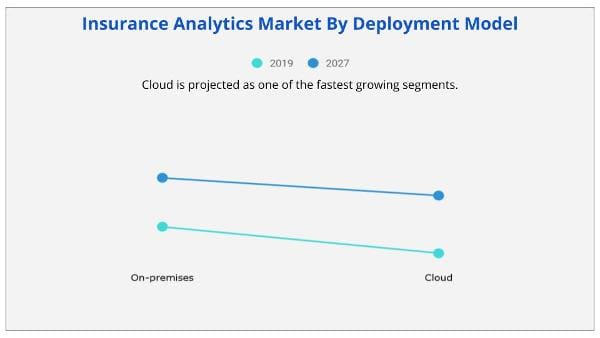
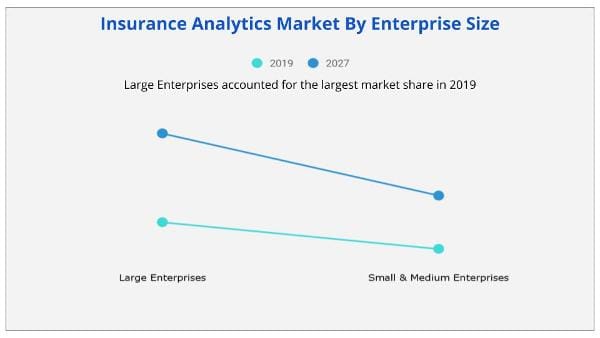
The insurance analytics market is segmented on the basis of component, deployment type, enterprise size, application, end user, and region. On the basis of components, the market is bifurcated into solution and service. In terms of deployment type, it is divided into on-premises and cloud. On the basis of enterprise size, it is segmented into large enterprises and small & medium enterprises (SMEs).
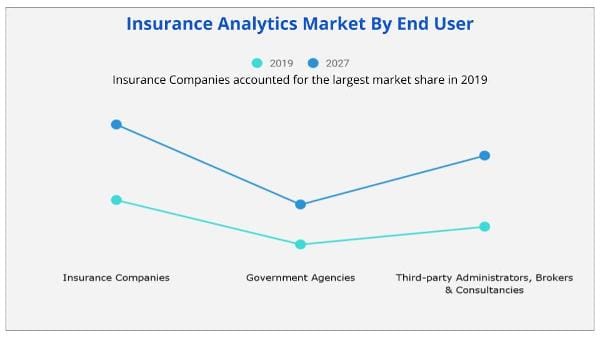
By application, it is segmented into claims management, risk management, customer management, sales & marketing, and others. Based on end users, the market is segmented into insurance companies, government agencies, and third-party administrators, brokers & consultancies. Region wise, the market is analyzed across North America, Europe, Asia-Pacific, and LAMEA.
The report analyses the profiles of key players operating in the market include Applied Systems, IBM Corp., Microsoft, Open Text Corporation, Oracle, Pegasystems Inc., salesforce.com inc., SAP SE, SAS Institute Inc., and Vertafore, Inc. These players have adopted various strategies to increase their market penetration and strengthen their position in the insurance analytics industry.
COVID-19 pandemic has a significant impact on the insurance analytics market, owing to increase in use and adoption of advanced technologies to provide digitalized services globally. Moreover, for Property and Casualty (P&C) & life insurance industries, it has become a challenge to be prepared for excess morbidity & mortality during the pandemic situation. Therefore, with understanding the potential impacts & need for advanced analytical solutions, insurers have largely adopted & implemented insurance analytics solutions globally. This, in turn, has become one of the major growth factors for the insurance analytics market during the global health crisis.
Insurance industry has become a fastest adopter of technologies such as cloud computing, application programming interfaces (APIs), data analytics, artificial intelligence, robotic process automation (RPA), chatbots, and machine learning. In addition, firms operating in this industry are inclined toward integrated customization services, which has increased adoption of insurance analytics solutions across the globe.
Moreover, significant requirement & implementation of advanced technologies and providing integrated & value-added services to customers promoting adoption of technologies. Therefore, increased implementation of technologies to reduce operational cost and provide convenience & efficiency services drive the insurance analytics market growth.
Various laws set different standards & regulations across different jurisdictions with an increased unified approach taken by financial centers toward regulation. Regulators continue to refine existing regulations & impose stringent regulatory actions with a higher level of accountability & enforcement, which hinders the insurance analytics market growth. In addition, with focus on data privacy & increases in pandemic-related digital customer engagement, governments tend to execute regulations & insurers to increase focus on data governance significantly. This, as a result, is the major factor that hampers the market growth.
Padding, inflating claims, staging accidents, misrepresenting facts on an insurance application, submitting claims for injuries or damage that never occurred are some of the major frauds occurring in the insurance sector. In addition, frauds such as internal fraud, rate evasion, underwriting fraud, claims fraud, and cybersecurity fraud are committed at different points in transaction by applicants, policyholders, third-party claimants, and professionals providing services to claimants.
Therefore, with rapid growth in fraudulent activities, companies providing insurance solutions are expected to adopt insurance analytics solutions in upcoming years. For instance, in 2018, the Coalition Against Insurance Fraud, in partnership with SAS Institute Inc. projected that about 10% of property-casualty insurance losses & loss adjustment expenses by USD 34 billion a year. This, as a result, is expected to boost demand for insurance analytics in the market.
By Region - Asia-Pacific would exhibit the highest CAGR of 15.9% during 2020-2027.
|
Report Metric |
Details |
|
Report Name |
Insurance Analytics Market Report |
|
The Market size value in 2019 |
7.91 Billion USD |
|
The Revenue forecast in 2027 |
22.45 Billion USD |
|
Growth Rate |
CAGR of 14.2% from 2020 to 2027 |
|
Base year considered |
2019 |
|
Forecast period |
2020-2027 |
|
Forecast units |
Value (USD) |
|
Segments covered |
Type, End-User, Offerings, and Region |
|
Report coverage |
Revenue & volume forecast, company share, competitive landscape, growth factors, and trends |
|
Geographic regions covered |
North America, Europe, Asia Pacific, Latin America, Middle East & Africa |
|
Companies covered |
Applied Systems, IBM Corp., Microsoft, Open Text Corporation, Oracle, Pegasystems Inc., salesforce.com inc., SAP SE, SAS Institute Inc., and Vertafore, Inc. |
Ans. The global insurance analytics market size was valued at USD 7.91 billion in 2019, and is projected to reach USD 22.45 billion by 2027.
Ans. The global insurance analytics market is expected to grow at a compound annual growth rate of 14.2% from 2020 to 2027.
Ans. Applied Systems, IBM Corp., Microsoft, Open Text Corporation, Oracle, Pegasystems Inc., salesforce.com inc., SAP SE, SAS Institute Inc., and Vertafore, Inc.
CHAPTER 1:INTRODUCTION
1.1.Report description
1.2.Key benefits for stakeholders
1.3.Key market segments
1.4.Key market segments
1.5.Research methodology
1.5.1.Secondary research
1.5.2.Primary research
1.5.3.Analyst tools & models
CHAPTER 2:EXECUTIVE SUMMARY
2.1.Key findings
2.1.1.Top impacting factors
2.1.2.Top investment pockets
2.2.CXO perspective
CHAPTER 3:MARKET OVERVIEW
3.1.Market definition and scope
3.2.Key forces shaping insurance analytics market
3.3.Market dynamics
3.3.1.Drivers
3.3.1.1.Increased adoption of advance technologies
3.3.1.2.Rise in competition among the insurance sector
3.3.2.Restraint
3.3.2.1.Stringent government regulations
3.3.2.1.Privacy & security concern
3.3.3.Opportunities
3.3.3.1.Surge in fraudulent activities
3.3.3.2.Untapped potential of emerging economies
3.4.COVID-19 impact analysis on insurance analytics market
3.4.1.Impact on insurance analytics market size
3.4.2.Change in insurers trends, preferences, and budget impact, owing to COVID-19
3.4.3.Framework for market challenges faced by insurance analytics solution providers
3.4.4.Economic impact on insurance analytics solution providers
3.4.5.Key player strategies to tackle negative impact on the industry
3.4.6.Opportunity analysis for insurance analytics solution providers
CHAPTER 4:INSURANCE ANALYTICS MARKET, BY COMPONENT
4.1.Overview
4.2.Solution
4.2.1.Key market trends, growth factors, and opportunities
4.2.2.Market size and forecast, by region
4.2.3.Market analysis, by country
4.3.Service
4.3.1.Key market trends, growth factors, and opportunities
4.3.2.Market size and forecast, by region
4.3.3.Market analysis, by country
CHAPTER 5:INSURANCE ANALYTICS MARKET, BY DEPLOYMENT MODEL
5.1.Overview
5.2.On-premises
5.2.1.Key market trends, growth factors, and opportunities
5.2.2.Market size and forecast, by region
5.2.3.Market analysis, by country
5.3.Cloud
5.3.1.Key market trends, growth factors, and opportunities
5.3.2.Market size and forecast, by region
5.3.3.Market analysis, by country
CHAPTER 6:INSURANCE ANALYTICS MARKET, BY ENTERPRISE SIZE
6.1.Overview
6.2.Large Enterprises
6.2.1.Key market trends, growth factors, and opportunities
6.2.2.Market size and forecast, by region
6.2.3.Market analysis, by country
6.3.Small & Medium Enterprises (SMEs)
6.3.1.Key market trends, growth factors, and opportunities
6.3.2.Market size and forecast, by region
6.3.3.Market analysis by country
CHAPTER 7:INSURANCE ANALYTICS MARKET, BY APPLICATION
7.1.Overview
7.2.Claims Management
7.2.1.Key market trends, growth factors, and opportunities
7.2.2.Market size and forecast, by region
7.2.3.Market analysis, by country
7.3.Risk Management
7.3.1.Key market trends, growth factors, and opportunities
7.3.2.Market size and forecast, by region
7.3.3.Market analysis, by country
7.4.Customer Management
7.4.1.Key market trends, growth factors, and opportunities
7.4.2.Market size and forecast, by region
7.4.3.Market analysis, by country
7.5.Sales & Marketing
7.5.1.Key market trends, growth factors, and opportunities
7.5.2.Market size and forecast, by region
7.5.3.Market analysis, by country
7.6.Others
7.6.1.Key market trends, growth factors, and opportunities
7.6.2.Market size and forecast, by region
7.6.3.Market analysis, by country
CHAPTER 8:INSURANCE ANALYTICS MARKET, BY END USER
8.1.Overview
8.2.Insurance Companies
8.2.1.Key market trends, growth factors, and opportunities
8.2.2.Market size and forecast, by region
8.2.3.Market analysis, by country
8.3.Government Agencies
8.3.1.Key market trends, growth factors, and opportunities
8.3.2.Market size and forecast, by region
8.3.3.Market analysis, by country
8.4.Third-party Administrators, Brokers & Consultancies
8.4.1.Key market trends, growth factors, and opportunities
8.4.2.Market size and forecast, by region
8.4.3.Market analysis, by country
CHAPTER 9:INSURANCE ANALYTICS MARKET, BY REGION
9.1.Overview
9.1.1.Market size and forecast, by region
9.2.North America
9.2.1.Key market trends, growth factors, and opportunities
9.2.2.Market size and forecast, by component
9.2.3.Market size and forecast, by deployment model
9.2.4.Market size and forecast, by enterprise size
9.2.5.Market size and forecast, by application
9.2.6.Market size and forecast, by end user
9.2.7.Market analysis, by country
9.2.7.1.U.S.
9.2.7.1.1.Market size and forecast, by component
9.2.7.1.2.Market size and forecast, by deployment model
9.2.7.1.3.Market size and forecast, by enterprise size
9.2.7.1.4.Market size and forecast, by application
9.2.7.1.5.Market size and forecast, by end user
9.2.7.2.Canada
9.2.7.2.1.Market size and forecast, by component
9.2.7.2.2.Market size and forecast, by deployment model
9.2.7.2.3.Market size and forecast, by enterprise size
9.2.7.2.4.Market size and forecast, by application
9.2.7.2.5.Market size and forecast, by end user
9.3.Europe
9.3.1.Key market trends, growth factors, and opportunities
9.3.2.Market size and forecast, by component
9.3.3.Market size and forecast, by deployment model
9.3.4.Market size and forecast, by enterprise size
9.3.5.Market size and forecast, by application
9.3.6.Market size and forecast, by end user
9.3.7.Market analysis, by country
9.3.7.1.UK
9.3.7.1.1.Market size and forecast, by component
9.3.7.1.2.Market size and forecast, by deployment model
9.3.7.1.3.Market size and forecast, by enterprise size
9.3.7.1.4.Market size and forecast, by application
9.3.7.1.5.Market size and forecast, by end user
9.3.7.2.Germany
9.3.7.2.1.Market size and forecast, by component
9.3.7.2.2.Market size and forecast, by deployment model
9.3.7.2.3.Market size and forecast, by enterprise size
9.3.7.2.4.Market size and forecast, by application
9.3.7.2.5.Market size and forecast, by end user
9.3.7.3.France
9.3.7.3.1.Market size and forecast, by component
9.3.7.3.2.Market size and forecast, by deployment model
9.3.7.3.3.Market size and forecast, by enterprise size
9.3.7.3.4.Market size and forecast, by application
9.3.7.3.5.Market size and forecast, by end user
9.3.7.4.Italy
9.3.7.4.1.Market size and forecast, by component
9.3.7.4.2.Market size and forecast, by deployment model
9.3.7.4.3.Market size and forecast, by enterprise size
9.3.7.4.4.Market size and forecast, by application
9.3.7.4.5.Market size and forecast, by end user
9.3.7.5.Spain
9.3.7.5.1.Market size and forecast, by component
9.3.7.5.2.Market size and forecast, by deployment model
9.3.7.5.3.Market size and forecast, by enterprise size
9.3.7.5.4.Market size and forecast, by application
9.3.7.5.5.Market size and forecast, by end user
9.3.7.6.Netherlands
9.3.7.6.1.Market size and forecast, by component
9.3.7.6.2.Market size and forecast, by deployment model
9.3.7.6.3.Market size and forecast, by enterprise size
9.3.7.6.4.Market size and forecast, by application
9.3.7.6.5.Market size and forecast, by end user
9.3.7.7.Rest of Europe
9.3.7.7.1.Market size and forecast, by component
9.3.7.7.2.Market size and forecast, by deployment model
9.3.7.7.3.Market size and forecast, by enterprise size
9.3.7.7.4.Market size and forecast, by application
9.3.7.7.5.Market size and forecast, by end user
9.4.Asia-Pacific
9.4.1.Key market trends, growth factors, and opportunities
9.4.2.Market size and forecast, by component
9.4.3.Market size and forecast, by deployment model
9.4.4.Market size and forecast, by enterprise size
9.4.5.Market size and forecast, by application
9.4.6.Market size and forecast, by end user
9.4.7.Market analysis, by country
9.4.7.1.China
9.4.7.1.1.Market size and forecast, by component
9.4.7.1.2.Market size and forecast, by deployment model
9.4.7.1.3.Market size and forecast, by enterprise size
9.4.7.1.4.Market size and forecast, by application
9.4.7.1.5.Market size and forecast, by end user
9.4.7.2.India
9.4.7.2.1.Market size and forecast, by component
9.4.7.2.2.Market size and forecast, by deployment model
9.4.7.2.3.Market size and forecast, by enterprise size
9.4.7.2.4.Market size and forecast, by application
9.4.7.2.5.Market size and forecast, by end user
9.4.7.3.Japan
9.4.7.3.1.Market size and forecast, by component
9.4.7.3.2.Market size and forecast, by deployment model
9.4.7.3.3.Market size and forecast, by enterprise size
9.4.7.3.4.Market size and forecast, by application
9.4.7.3.5.Market size and forecast, by end user
9.4.7.4.South Korea
9.4.7.4.1.Market size and forecast, by component
9.4.7.4.2.Market size and forecast, by deployment model
9.4.7.4.3.Market size and forecast, by enterprise size
9.4.7.4.4.Market size and forecast, by application
9.4.7.4.5.Market size and forecast, by end user
9.4.7.5.Australia
9.4.7.5.1.Market size and forecast, by component
9.4.7.5.2.Market size and forecast, by deployment model
9.4.7.5.3.Market size and forecast, by enterprise size
9.4.7.5.4.Market size and forecast, by application
9.4.7.5.5.Market size and forecast, by end user
9.4.7.6.Rest of Asia-Pacific
9.4.7.6.1.Market size and forecast, by component
9.4.7.6.2.Market size and forecast, by deployment model
9.4.7.6.3.Market size and forecast, by enterprise size
9.4.7.6.4.Market size and forecast, by application
9.4.7.6.5.Market size and forecast, by end user
9.5.LAMEA
9.5.1.Key market trends, growth factors, and opportunities
9.5.2.Market size and forecast, by component
9.5.3.Market size and forecast, by deployment model
9.5.4.Market size and forecast, by enterprise size
9.5.5.Market size and forecast, by application
9.5.6.Market size and forecast, by end user
9.5.7.Market analysis, by country
9.5.7.1.Latin America
9.5.7.1.1.Market size and forecast, by component
9.5.7.1.2.Market size and forecast, by deployment model
9.5.7.1.3.Market size and forecast, by enterprise size
9.5.7.1.4.Market size and forecast, by application
9.5.7.1.5.Market size and forecast, by end user
9.5.7.2.Middle East
9.5.7.2.1.Market size and forecast, by component
9.5.7.2.2.Market size and forecast, by deployment model
9.5.7.2.3.Market size and forecast, by enterprise size
9.5.7.2.4.Market size and forecast, by application
9.5.7.2.5.Market size and forecast, by end user
9.5.7.3.Africa
9.5.7.3.1.Market size and forecast, by component
9.5.7.3.2.Market size and forecast, by deployment model
9.5.7.3.3.Market size and forecast, by enterprise size
9.5.7.3.4.Market size and forecast, by application
9.5.7.3.5.Market size and forecast, by end user
CHAPTER 10:COMPETITIVE LANDSCAPE
10.1.Introduction
10.1.1.Market player positioning, 2019
10.1.2.Top winning strategies
CHAPTER 11:COMPANY PROFILES
11.1.Applied Systems
11.1.1.Company overview
11.1.2.Company snapshot
11.1.3.Product portfolio
11.1.4.Key strategic moves and developments
11.2.INTERNATIONAL BUSINESS MACHINES CORPORATION
11.2.1.Company overview
11.2.2.Company snapshot
11.2.3.Operating business segments
11.2.4.Product portfolio
11.2.5.Business performance
11.3.MICROSOFT
11.3.1.Company overview
11.3.2.Company snapshot
11.3.3.Operating business segments
11.3.4.Product portfolio
11.3.5.Business performance
11.4.Open Text Corporation
11.4.1.Company overview
11.4.2.Company snapshot
11.4.3.Product portfolio
11.4.4.Business performance
11.5.Oracle
11.5.1.Company overview
11.5.2.Company snapshot
11.5.3.Operating business segments
11.5.4.Product portfolio
11.5.5.Business performance
11.5.6.Key strategic moves and developments
11.6.Pegasystems Inc.
11.6.1.Company overview
11.6.2.Company snapshot
11.6.3.Product portfolio
11.6.4.Business performance
11.7.salesforce.com inc.
11.7.1.Company overview
11.7.2.Company snapshot
11.7.3.Product portfolio
11.7.4.Business performance
11.7.5.Key strategic moves and developments
11.8.SAP SE
11.8.1.Company overview
11.8.2.Company snapshot
11.8.3.Operating business segments
11.8.4.Product portfolio
11.8.5.Business performance
11.9.SAS Institute Inc.
11.9.1.Company overview
11.9.2.Company snapshot
11.9.3.Product portfolio
11.10.Vertafore, Inc.
11.10.1.Company overview
11.10.2.Company snapshot
11.10.3.Product portfolio
11.10.4.Key strategic moves and developments
LIST OF TABLES
TABLE 01.INSURANCE ANALYTICS MARKET REVENUE, BY COMPONENT, 2019–2027 ($MILLION)
TABLE 02.INSURANCE ANALYTICS MARKET REVENUE FOR SOLUTION, BY REGION, 2019–2027 ($MILLION)
TABLE 03.INSURANCE ANALYTICS MARKET REVENUE FOR SERVICE, BY REGION, 2019–2027 ($MILLION)
TABLE 04.INSURANCE ANALYTICS MARKET REVENUE, BY DEPLOYMENT MODEL, 2019–2027 ($MILLION)
TABLE 05.INSURANCE ANALYTICS MARKET REVENUE FOR ON-PREMISES, BY REGION, 2019–2027 ($MILLION)
TABLE 06.INSURANCE ANALYTICS MARKET REVENUE FOR CLOUD, BY REGION, 2019–2027 ($MILLION)
TABLE 07.INSURANCE ANALYTICS MARKET REVENUE, BY ENTERPRISE SIZE, 2019–2027 ($MILLION)
TABLE 08.INSURANCE ANALYTICS MARKET REVENUE FOR LARGE ENTERPRISES, BY REGION, 2019–2027 ($MILLION)
TABLE 09.INSURANCE ANALYTICS MARKET REVENUE FOR SMALL & MEDIUM ENTERPRISES (SMES), BY REGION, 2019–2027 ($MILLION)
TABLE 10.INSURANCE ANALYTICS MARKET REVENUE, BY APPLICATION, 2019–2027 ($MILLION)
TABLE 11.INSURANCE ANALYTICS MARKET REVENUE FOR CLAIMS MANAGEMENT, BY REGION, 2019–2027 ($MILLION)
TABLE 12.INSURANCE ANALYTICS MARKET REVENUE FOR RISK MANAGEMENT, BY REGION, 2019–2027 ($MILLION)
TABLE 13.INSURANCE ANALYTICS MARKET REVENUE FOR CUSTOMER MANAGEMENT, BY REGION, 2019–2027 ($MILLION)
TABLE 14.INSURANCE ANALYTICS MARKET REVENUE FOR SALES & MARKETING, BY REGION, 2019–2027 ($MILLION)
TABLE 15.INSURANCE ANALYTICS MARKET REVENUE FOR OTHERS, BY REGION, 2019–2027 ($MILLION)
TABLE 16.INSURANCE ANALYTICS MARKET REVENUE, BY END USER, 2019–2027 ($MILLION)
TABLE 17.INSURANCE ANALYTICS MARKET REVENUE FOR INSURANCE COMPANIES, BY REGION, 2019–2027 ($MILLION)
TABLE 18.INSURANCE ANALYTICS MARKET REVENUE FOR GOVERNMENT AGENCIES, BY REGION, 2019–2027 ($MILLION)
TABLE 19.INSURANCE ANALYTICS MARKET REVENUE FOR THIRD-PARTY ADMINISTRATORS, BROKERS & CONSULTANCIES, BY REGION, 2019–2027 ($MILLION)
TABLE 20.INSURANCE ANALYTICS MARKET REVENUE, BY REGION, 2019–2027 ($MILLION)
TABLE 21.NORTH AMERICA INSURANCE ANALYTICS MARKET REVENUE, BY COMPONENT, 2019–2027 ($MILLION)
TABLE 22.NORTH AMERICA INSURANCE ANALYTICS MARKET REVENUE, BY DEPLOYMENT MODEL, 2019–2027 ($MILLION)
TABLE 23.NORTH AMERICA INSURANCE ANALYTICS MARKET REVENUE, BY ENTERPRISE SIZE, 2019–2027 ($MILLION)
TABLE 24.NORTH AMERICA INSURANCE ANALYTICS MARKET REVENUE, BY APPLICATION, 2019–2027 ($MILLION)
TABLE 25.NORTH AMERICA INSURANCE ANALYTICS MARKET REVENUE, BY END USER, 2019–2027 ($MILLION)
TABLE 26.NORTH AMERICA INSURANCE ANALYTICS MARKET REVENUE, BY COUNTRY, 2019–2027 ($MILLION)
TABLE 27.U.S. INSURANCE ANALYTICS MARKET REVENUE, BY COMPONENT, 2019–2027 ($MILLION)
TABLE 28.U.S. INSURANCE ANALYTICS MARKET REVENUE, BY DEPLOYMENT MODEL, 2019–2027 ($MILLION)
TABLE 29.U.S. INSURANCE ANALYTICS MARKET REVENUE, BY ENTERPRISE SIZE, 2019–2027 ($MILLION)
TABLE 30.U.S. INSURANCE ANALYTICS MARKET REVENUE, BY APPLICATION, 2019–2027 ($MILLION)
TABLE 31.U.S. INSURANCE ANALYTICS MARKET REVENUE, BY END USER, 2019–2027 ($MILLION)
TABLE 32.CANADA INSURANCE ANALYTICS MARKET REVENUE, BY COMPONENT, 2019–2027 ($MILLION)
TABLE 33.CANADA INSURANCE ANALYTICS MARKET REVENUE, BYDEPLOYMENT MODEL, 2019–2027 ($MILLION)
TABLE 34.CANADA INSURANCE ANALYTICS MARKET REVENUE, BY ENTERPRISE SIZE, 2019–2027 ($MILLION)
TABLE 35.U.S. INSURANCE ANALYTICS MARKET REVENUE, BY APPLICATION, 2019–2027 ($MILLION)
TABLE 36.U.S. INSURANCE ANALYTICS MARKET REVENUE, BY END USER, 2019–2027 ($MILLION)
TABLE 37.EUROPE INSURANCE ANALYTICS MARKET REVENUE, BY COMPONENT, 2019–2027 ($MILLION)
TABLE 38.EUROPE INSURANCE ANALYTICS MARKET REVENUE, BY DEPLOYMENT MODEL, 2019–2027 ($MILLION)
TABLE 39.EUROPE INSURANCE ANALYTICS MARKET REVENUE, BY ENTERPRISE SIZE, 2019–2027 ($MILLION)
TABLE 40.EUROPE INSURANCE ANALYTICS MARKET REVENUE, BY APPLICATION, 2019–2027 ($MILLION)
TABLE 41.EUROPE INSURANCE ANALYTICS MARKET REVENUE, BY END USER, 2019–2027 ($MILLION)
TABLE 42.EUROPE INSURANCE ANALYTICS MARKET REVENUE, BY COUNTRY, 2019–2027 ($MILLION)
TABLE 43.UK INSURANCE ANALYTICS MARKET REVENUE, BY COMPONENT, 2019–2027 ($MILLION)
TABLE 44.UK INSURANCE ANALYTICS MARKET REVENUE, BYDEPLOYMENT MODEL, 2019–2027 ($MILLION)
TABLE 45.UK INSURANCE ANALYTICS MARKET REVENUE, BY ENTERPRISE SIZE, 2019–2027 ($MILLION)
TABLE 46.UK INSURANCE ANALYTICS MARKET REVENUE, BY APPLICATION, 2019–2027 ($MILLION)
TABLE 47.UK INSURANCE ANALYTICS MARKET REVENUE, BY END USER, 2019–2027 ($MILLION)
TABLE 48.GERMANY INSURANCE ANALYTICS MARKET REVENUE, BY COMPONENT, 2019–2027 ($MILLION)
TABLE 49.GERMANY INSURANCE ANALYTICS MARKET REVENUE, BYDEPLOYMENT MODEL, 2019–2027 ($MILLION)
TABLE 50.GERMANY INSURANCE ANALYTICS MARKET REVENUE, BY ENTERPRISE SIZE, 2019–2027 ($MILLION)
TABLE 51.GERMANY INSURANCE ANALYTICS MARKET REVENUE, BY APPLICATION, 2019–2027 ($MILLION)
TABLE 52.GERMANY INSURANCE ANALYTICS MARKET REVENUE, BY END USER, 2019–2027 ($MILLION)
TABLE 53.FRANCE INSURANCE ANALYTICS MARKET REVENUE, BY COMPONENT, 2019–2027 ($MILLION)
TABLE 54.FRANCE INSURANCE ANALYTICS MARKET REVENUE, BY DEPLOYMENT MODEL, 2019–2027 ($MILLION)
TABLE 55.FRANCE INSURANCE ANALYTICS MARKET REVENUE, BY ENTERPRISE SIZE, 2019–2027 ($MILLION)
TABLE 56.FRANCE INSURANCE ANALYTICS MARKET REVENUE, BY APPLICATION, 2019–2027 ($MILLION)
TABLE 57.FRANCE INSURANCE ANALYTICS MARKET REVENUE, BY END USER, 2019–2027 ($MILLION)
TABLE 58.ITALY INSURANCE ANALYTICS MARKET REVENUE, BY COMPONENT, 2019–2027 ($MILLION)
TABLE 59.ITALY INSURANCE ANALYTICS MARKET REVENUE, BY DEPLOYMENT MODEL, 2019–2027 ($MILLION)
TABLE 60.ITALY INSURANCE ANALYTICS MARKET REVENUE, BY ENTERPRISE SIZE, 2019–2027 ($MILLION)
TABLE 61.ITALY INSURANCE ANALYTICS MARKET REVENUE, BY APPLICATION, 2019–2027 ($MILLION)
TABLE 62.ITALY INSURANCE ANALYTICS MARKET REVENUE, BY END USER, 2019–2027 ($MILLION)
TABLE 63.SPAIN INSURANCE ANALYTICS MARKET REVENUE, BY COMPONENT, 2019–2027 ($MILLION)
TABLE 64.SPAIN INSURANCE ANALYTICS MARKET REVENUE, BY DEPLOYMENT MODEL, 2019–2027 ($MILLION)
TABLE 65.SPAIN INSURANCE ANALYTICS MARKET REVENUE, BY ENTERPRISE SIZE, 2019–2027 ($MILLION)
TABLE 66.SPAIN INSURANCE ANALYTICS MARKET REVENUE, BY APPLICATION, 2019–2027 ($MILLION)
TABLE 67.SPAIN INSURANCE ANALYTICS MARKET REVENUE, BY END USER, 2019–2027 ($MILLION)
TABLE 68.NETHERLANDS INSURANCE ANALYTICS MARKET REVENUE, BY COMPONENT, 2019–2027 ($MILLION)
TABLE 69.NETHERLANDS INSURANCE ANALYTICS MARKET REVENUE, BY DEPLOYMENT MODEL, 2019–2027 ($MILLION)
TABLE 70.NETHERLANDS INSURANCE ANALYTICS MARKET REVENUE, BY ENTERPRISE SIZE, 2019–2027 ($MILLION)
TABLE 71.NETHERLANDS INSURANCE ANALYTICS MARKET REVENUE, BY APPLICATION, 2019–2027 ($MILLION)
TABLE 72.NETHERLANDS INSURANCE ANALYTICS MARKET REVENUE, BY END USER, 2019–2027 ($MILLION)
TABLE 73.REST OF EUROPE INSURANCE ANALYTICS MARKET REVENUE, BY COMPONENT, 2019–2027 ($MILLION)
TABLE 74.REST OF EUROPE INSURANCE ANALYTICS MARKET REVENUE, BY DEPLOYMENT MODEL, 2019–2027 ($MILLION)
TABLE 75.REST OF EUROPE INSURANCE ANALYTICS MARKET REVENUE, BY ENTERPRISE SIZE, 2019–2027 ($MILLION)
TABLE 76.REST OF EUROPE INSURANCE ANALYTICS MARKET REVENUE, BY APPLICATION, 2019–2027 ($MILLION)
TABLE 77.REST OF EUROPE INSURANCE ANALYTICS MARKET REVENUE, BY END USER, 2019–2027 ($MILLION)
TABLE 78.ASIA-PACIFIC INSURANCE ANALYTICS MARKET REVENUE, BY COMPONENT, 2019–2027 ($MILLION)
TABLE 79.ASIA-PACIFIC INSURANCE ANALYTICS MARKET REVENUE, BY DEPLOYMENT MODEL, 2019–2027 ($MILLION)
TABLE 80.ASIA-PACIFIC INSURANCE ANALYTICS MARKET REVENUE, BY ENTERPRISE SIZE, 2019–2027 ($MILLION)
TABLE 81.ASIA-PACIFIC INSURANCE ANALYTICS MARKET REVENUE, BY APPLICATION, 2019–2027 ($MILLION)
TABLE 82.ASIA-PACIFIC INSURANCE ANALYTICS MARKET REVENUE, BY END USER, 2019–2027 ($MILLION)
TABLE 83.ASIA-PACIFIC INSURANCE ANALYTICS MARKET REVENUE, BY COUNTRY, 2019–2027 ($MILLION)
TABLE 84.CHINA INSURANCE ANALYTICS MARKET REVENUE, BY COMPONENT, 2019–2027 ($MILLION)
TABLE 85.CHINA INSURANCE ANALYTICS MARKET REVENUE, BYDEPLOYMENT MODEL, 2019–2027 ($MILLION)
TABLE 86.CHINA INSURANCE ANALYTICS MARKET REVENUE, BY ENTERPRISE SIZE, 2019–2027 ($MILLION)
TABLE 87.CHINA INSURANCE ANALYTICS MARKET REVENUE, BY APPLICATION, 2019–2027 ($MILLION)
TABLE 88.CHINA INSURANCE ANALYTICS MARKET REVENUE, BY END USER, 2019–2027 ($MILLION)
TABLE 89.INDIA INSURANCE ANALYTICS MARKET REVENUE, BY COMPONENT, 2019–2027 ($MILLION)
TABLE 90.INDIA INSURANCE ANALYTICS MARKET REVENUE, BY DEPLOYMENT MODEL, 2019–2027 ($MILLION)
TABLE 91.INDIA INSURANCE ANALYTICS MARKET REVENUE, BY ENTERPRISE SIZE, 2019–2027 ($MILLION)
TABLE 92.INDIA INSURANCE ANALYTICS MARKET REVENUE, BY APPLICATION, 2019–2027 ($MILLION)
TABLE 93.INDIA INSURANCE ANALYTICS MARKET REVENUE, BY END USER, 2019–2027 ($MILLION)
TABLE 94.JAPAN INSURANCE ANALYTICS MARKET REVENUE, BY COMPONENT, 2019–2027 ($MILLION)
TABLE 95.JAPAN INSURANCE ANALYTICS MARKET REVENUE, BYDEPLOYMENT MODEL, 2019–2027 ($MILLION)
TABLE 96.JAPAN INSURANCE ANALYTICS MARKET REVENUE, BY ENTERPRISE SIZE, 2019–2027 ($MILLION)
TABLE 97.JAPAN INSURANCE ANALYTICS MARKET REVENUE, BY APPLICATION, 2019–2027 ($MILLION)
TABLE 98.JAPAN INSURANCE ANALYTICS MARKET REVENUE, BY END USER, 2019–2027 ($MILLION)
TABLE 99.SOUTH KOREA INSURANCE ANALYTICS MARKET REVENUE, BY COMPONENT, 2019–2027 ($MILLION)
TABLE 100.SOUTH KOREA INSURANCE ANALYTICS MARKET REVENUE, BY DEPLOYMENT MODEL, 2019–2027 ($MILLION)
TABLE 101.SOUTH KOREA INSURANCE ANALYTICS MARKET REVENUE, BY ENTERPRISE SIZE, 2019–2027 ($MILLION)
TABLE 102.SOUTH KOREA INSURANCE ANALYTICS MARKET REVENUE, BY APPLICATION, 2019–2027 ($MILLION)
TABLE 103.SOUTH KOREA INSURANCE ANALYTICS MARKET REVENUE, BY END USER, 2019–2027 ($MILLION)
TABLE 104.AUSTRALIA INSURANCE ANALYTICS MARKET REVENUE, BY COMPONENT, 2019–2027 ($MILLION)
TABLE 105.AUSTRALIA INSURANCE ANALYTICS MARKET REVENUE, BYD EPLOYMENT MODEL, 2019–2027 ($MILLION)
TABLE 106.AUSTRALIA INSURANCE ANALYTICS MARKET REVENUE, BY ENTERPRISE SIZE, 2019–2027 ($MILLION)
TABLE 107.AUSTRALIA INSURANCE ANALYTICS MARKET REVENUE, BY APPLICATION, 2019–2027 ($MILLION)
TABLE 108.AUSTRALIA INSURANCE ANALYTICS MARKET REVENUE, BY END USER, 2019–2027 ($MILLION)
TABLE 109.REST OF ASIA-PACIFIC INSURANCE ANALYTICS MARKET REVENUE, BY COMPONENT, 2019–2027 ($MILLION)
TABLE 110.REST OF ASIA-PACIFIC INSURANCE ANALYTICS MARKET REVENUE, BYDEPLOYMENT MODEL, 2019–2027 ($MILLION)
TABLE 111.REST OF ASIA-PACIFIC INSURANCE ANALYTICS MARKET REVENUE, BY ENTERPRISE SIZE, 2019–2027 ($MILLION)
TABLE 112.REST OF ASIA-PACIFIC INSURANCE ANALYTICS MARKET REVENUE, BY APPLICATION, 2019–2027 ($MILLION)
TABLE 113.REST OF ASIA-PACIFIC INSURANCE ANALYTICS MARKET REVENUE, BY END USER, 2019–2027 ($MILLION)
TABLE 114.LAMEA INSURANCE ANALYTICS MARKET REVENUE, BY COMPONENT, 2019–2027 ($MILLION)
TABLE 115.LAMEA INSURANCE ANALYTICS MARKET REVENUE, BY DEPLOYMENT MODEL, 2019–2027 ($MILLION)
TABLE 116.LAMEA INSURANCE ANALYTICS MARKET REVENUE, BY ENTERPRISE SIZE, 2019–2027 ($MILLION)
TABLE 117.LAMEA INSURANCE ANALYTICS MARKET REVENUE, BY APPLICATION, 2019–2027 ($MILLION)
TABLE 118.LAMEA INSURANCE ANALYTICS MARKET REVENUE, BY END USER, 2019–2027 ($MILLION)
TABLE 119.LAMEA INSURANCE ANALYTICS MARKET REVENUE, BY COUNTRY, 2019–2027 ($MILLION)
TABLE 120.LATIN AMERICA INSURANCE ANALYTICS MARKET REVENUE, BY COMPONENT, 2019–2027 ($MILLION)
TABLE 121.LATIN AMERICA INSURANCE ANALYTICS MARKET REVENUE, BYDEPLOYMENT MODEL, 2019–2027 ($MILLION)
TABLE 122.LATIN AMERICA INSURANCE ANALYTICS MARKET REVENUE, BY ENTERPRISE SIZE, 2019–2027 ($MILLION)
TABLE 123.LATIN AMERICA INSURANCE ANALYTICS MARKET REVENUE, BY APPLICATION, 2019–2027 ($MILLION)
TABLE 124.LATIN AMERICA INSURANCE ANALYTICS MARKET REVENUE, BY END USER, 2019–2027 ($MILLION)
TABLE 125.MIDDLE EAST INSURANCE ANALYTICS MARKET REVENUE, BY COMPONENT, 2019–2027 ($MILLION)
TABLE 126.MIDDLE EAST INSURANCE ANALYTICS MARKET REVENUE, BYDEPLOYMENT MODEL, 2019–2027 ($MILLION)
TABLE 127.MIDDLE EAST INSURANCE ANALYTICS MARKET REVENUE, BY ENTERPRISE SIZE, 2019–2027 ($MILLION)
TABLE 128.MIDDLE EAST INSURANCE ANALYTICS MARKET REVENUE, BY APPLICATION, 2019–2027 ($MILLION)
TABLE 129.MIDDLE EAST INSURANCE ANALYTICS MARKET REVENUE, BY END USER, 2019–2027 ($MILLION)
TABLE 130.AFRICA INSURANCE ANALYTICS MARKET REVENUE, BY COMPONENT, 2019–2027 ($MILLION)
TABLE 131.AFRICA INSURANCE ANALYTICS MARKET REVENUE, BY DEPLOYMENT MODEL, 2019–2027 ($MILLION)
TABLE 132.AFRICA INSURANCE ANALYTICS MARKET REVENUE, BY ENTERPRISE SIZE, 2019–2027 ($MILLION)
TABLE 133.LATIN AMERICA INSURANCE ANALYTICS MARKET REVENUE, BY APPLICATION, 2019–2027 ($MILLION)
TABLE 134.LATIN AMERICA INSURANCE ANALYTICS MARKET REVENUE, BY END USER, 2019–2027 ($MILLION)
TABLE 135.APPLIED SYSTEMS: COMPANY SNAPSHOT
TABLE 136.APPLIED SYSTEMS: PRODUCT PORTFOLIO
TABLE 137.INTERNATIONAL BUSINESS MACHINES CORPORATION: COMPANY SNAPSHOT
TABLE 138.INTERNATIONAL BUSINESS MACHINES CORPORATION: OPERATING SEGMENTS
TABLE 139.INTERNATIONAL BUSINESS MACHINES CORPORATION: PRODUCT PORTFOLIO
TABLE 140.MICROSOFT: COMPANY SNAPSHOT
TABLE 141.MICROSOFT: OPERATING SEGMENTS
TABLE 142.MICROSOFT: PRODUCT PORTFOLIO
TABLE 143.OPEN TEXT CORPORATION: COMPANY SNAPSHOT
TABLE 144.OPEN TEXT CORPORATION: PRODUCT PORTFOLIO
TABLE 145.ORACLE: COMPANY SNAPSHOT
TABLE 146.ORACLE: OPERATING SEGMENTS
TABLE 147.ORACLE: PRODUCT PORTFOLIO
TABLE 148.PEGASYSTEMS INC.: COMPANY SNAPSHOT
TABLE 149.PEGASYSTEMS INC.: PRODUCT PORTFOLIO
TABLE 150.SALESFORCE.COM INC.: COMPANY SNAPSHOT
TABLE 151.SALESFORCE.COM INC.: PRODUCT PORTFOLIO
TABLE 152.SAP SE: COMPANY SNAPSHOT
TABLE 153.SAP SE: OPERATING SEGMENTS
TABLE 154.SAP SE: PRODUCT PORTFOLIO
TABLE 155.SAS INSTITUTE INC.: COMPANY SNAPSHOT
TABLE 156.SAS INSTITUTE INC.: PRODUCT PORTFOLIO
TABLE 157.VERTAFORE, INC.: COMPANY SNAPSHOT
TABLE 158.VERTAFORE, INC.: PRODUCT PORTFOLIO
LIST OF FIGURES
FIGURE 01.INSURANCE ANALYTICS MARKET, BY SEGMENTATION, 2019–2027
FIGURE 02.INSURANCE ANALYTICS MARKET, BY REGION, 2019–2027
FIGURE 03.TOP IMPACTING FACTORS
FIGURE 04.TOP INVESTMENT POCKETS
FIGURE 05.MODERATE BARGAINING POWER OF SUPPLIERS
FIGURE 06.MODERATE-TO-HIGH BARGAINING POWER OF BUYER
FIGURE 07.MODERATE THREAT OF SUBSTITUTES
FIGURE 08.MODERATE THREAT OF NEW ENTRANTS
FIGURE 09.HIGH COMPETITIVE RIVALRY
FIGURE 10.DRIVERS, RESTRAINTS, AND OPPORTUNITIES
FIGURE 11.INSURANCE ANALYTICS MARKET REVENUE, BY COMPONENT, 2019–2027 ($MILLION)
FIGURE 12.COMPARATIVE SHARE ANALYSIS OF INSURANCE ANALYTICS MARKET FOR SOLUTION, BY COUNTRY, 2019 & 2027(%)
FIGURE 13.COMPARATIVE SHARE ANALYSIS OF INSURANCE ANALYTICS MARKET FOR SERVICE, BY COUNTRY, 2019 & 2027(%)
FIGURE 14.INSURANCE ANALYTICS MARKET REVENUE, BY DEPLOYMENT MODEL, 2019–2027 ($MILLION)
FIGURE 15.COMPARATIVE SHARE ANALYSIS OF INSURANCE ANALYTICS MARKET FOR ON-PREMISES, BY COUNTRY, 2019 & 2027(%)
FIGURE 16.COMPARATIVE SHARE ANALYSIS OF INSURANCE ANALYTICS MARKET FOR CLOUD, BY COUNTRY, 2019 & 2027(%)
FIGURE 17.INSURANCE ANALYTICS MARKET, BY ENTERPRISE SIZE, 2019–2027
FIGURE 18.COMPARATIVE SHARE ANALYSIS OF INSURANCE ANALYTICS MARKET FOR LARGE ENTERPRISES, BY COUNTRY, 2019 & 2027 (%)
FIGURE 19.COMPARATIVE SHARE ANALYSIS OF INSURANCE ANALYTICS MARKET FOR SMALL & MEDIUM ENTERPRISES (SMES), BY COUNTRY, 2019 & 2027 (%)
FIGURE 20.INSURANCE ANALYTICS MARKET REVENUE, BY APPLICATION, 2019–2027 ($MILLION)
FIGURE 21.COMPARATIVE SHARE ANALYSIS OF INSURANCE ANALYTICS MARKET FOR CLAIMS MANAGEMENT, BY COUNTRY, 2019 & 2027(%)
FIGURE 22.COMPARATIVE SHARE ANALYSIS OF INSURANCE ANALYTICS MARKET FOR RISK MANAGEMENT, BY COUNTRY, 2019 & 2027(%)
FIGURE 23.COMPARATIVE SHARE ANALYSIS OF INSURANCE ANALYTICS MARKET FOR CUSTOMER MANAGEMENT, BY COUNTRY, 2019 & 2027(%)
FIGURE 24.COMPARATIVE SHARE ANALYSIS OF INSURANCE ANALYTICS MARKET FOR SALES & MARKETING, BY COUNTRY, 2019 & 2027(%)
FIGURE 25.COMPARATIVE SHARE ANALYSIS OF INSURANCE ANALYTICS MARKET FOR OTHERS, BY COUNTRY, 2019 & 2027(%)
FIGURE 26.INSURANCE ANALYTICS MARKET REVENUE, BY END USER, 2019–2027 ($MILLION)
FIGURE 27.COMPARATIVE SHARE ANALYSIS OF INSURANCE ANALYTICS MARKET FOR INSURANCE COMPANIES, BY COUNTRY, 2019 & 2027(%)
FIGURE 28.COMPARATIVE SHARE ANALYSIS OF INSURANCE ANALYTICS MARKET FOR GOVERNMENT AGENCIES, BY COUNTRY, 2019 & 2027(%)
FIGURE 29.COMPARATIVE SHARE ANALYSIS OF INSURANCE ANALYTICS MARKET FOR THIRD-PARTY ADMINISTRATORS, BROKERS & CONSULTANCIES, BY COUNTRY, 2019 & 2027(%)
FIGURE 30.U.S. INSURANCE ANALYTICS MARKET REVENUE, 2019–2027 ($MILLION)
FIGURE 31.CANADA INSURANCE ANALYTICS MARKET REVENUE, 2019–2027 ($MILLION)
FIGURE 32.UK INSURANCE ANALYTICS MARKET REVENUE, 2019–2027 ($MILLION)
FIGURE 33.GERMANY INSURANCE ANALYTICS MARKET REVENUE, 2019–2027 ($MILLION)
FIGURE 34.FRANCE INSURANCE ANALYTICS MARKET REVENUE, 2019–2027 ($MILLION)
FIGURE 35.ITALY INSURANCE ANALYTICS MARKET REVENUE, 2019–2027 ($MILLION)
FIGURE 36.SPAIN INSURANCE ANALYTICS MARKET REVENUE, 2019–2027 ($MILLION)
FIGURE 37.NETHERLANDS INSURANCE ANALYTICS MARKET REVENUE, 2019–2027 ($MILLION)
FIGURE 38.REST OF EUROPE INSURANCE ANALYTICS MARKET REVENUE, 2019–2027 ($MILLION)
FIGURE 39.CHINA INSURANCE ANALYTICS MARKET REVENUE, 2019–2027 ($MILLION)
FIGURE 40.INDIA INSURANCE ANALYTICS MARKET REVENUE, 2019–2027 ($MILLION)
FIGURE 41.JAPAN INSURANCE ANALYTICS MARKET REVENUE, 2019–2027 ($MILLION)
FIGURE 42.SOUTH KOREA INSURANCE ANALYTICS MARKET REVENUE, 2019–2027 ($MILLION)
FIGURE 43.AUSTRALIA INSURANCE ANALYTICS MARKET REVENUE, 2019–2027 ($MILLION)
FIGURE 44.REST OF ASIA-PACIFIC INSURANCE ANALYTICS MARKET REVENUE, 2019–2027 ($MILLION)
FIGURE 45.LATIN AMERICA INSURANCE ANALYTICS MARKET REVENUE, 2019–2027 ($MILLION)
FIGURE 46.MIDDLE EAST INSURANCE ANALYTICS MARKET REVENUE, 2019–2027 ($MILLION)
FIGURE 47.AFRICA INSURANCE ANALYTICS MARKET REVENUE, 2019–2027 ($MILLION)
FIGURE 48.MARKET PLAYER POSITIONING, 2019
FIGURE 49.TOP WINNING STRATEGIES, BY YEAR, 2019–2021
FIGURE 50.TOP WINNING STRATEGIES, BY DEVELOPMENT, 2019–2021
FIGURE 51.TOP WINNING STRATEGIES, BY COMPANY, 2019–2021
FIGURE 52.INTERNATIONAL BUSINESS MACHINES CORPORATION: NET SALES, 2018–2020 ($MILLION)
FIGURE 53.INTERNATIONAL BUSINESS MACHINES CORPORATION: REVENUE SHARE, BY SEGMENT (2020)
FIGURE 54.INTERNATIONAL BUSINESS MACHINES CORPORATION: REVENUE SHARE, BY REGION (2020)
FIGURE 55.MICROSOFT: REVENUE, 2018–2020 ($MILLION)
FIGURE 56.MICROSOFT: REVENUE SHARE, BY SEGMENT, 2020 (%)
FIGURE 57.MICROSOFT: REVENUE SHARE, BY REGION, 2020 (%)
FIGURE 58.OPEN TEXT CORPORATION: REVENUE, 2018–2020 ($MILLION)
FIGURE 59.ORACLE: NET REVENUE, 2018–2020 ($MILLION)
FIGURE 60.ORACLE: REVENUE SHARE, BY SEGMENT, 2020 (%)
FIGURE 61.ORACLE: REVENUE SHARE, BY REGION, 2020 (%)
FIGURE 62.PEGASYSTEMS INC.: REVENUE, 2017–2019 ($MILLION)
FIGURE 63.SALESFORCE.COM INC.: REVENUE, 2018–2020 ($MILLION)
FIGURE 64.SALESFORCE.COM, INC.: REVENUE SHARE, BY REGION, 2020 (%)
FIGURE 65.SAP SE: REVENUE, 2018–2020 ($MILLION)
FIGURE 66.SAP SE: REVENUE SHARE, BY SEGMENT, 2020 (%)
FIGURE 67.SAP SE: REVENUE SHARE, BY REGION, 2020 (%)
$6169
$6930
$10665
HAVE A QUERY?
OUR CUSTOMER

SIMILAR REPORTS