LIST OF TABLES
TABLE 01.GLOBAL GREEN POWER MARKET, BY POWER SOURCE, 2019–2027 ($MILLION)
TABLE 02.GLOBAL GREEN POWER MARKET, BY POWER SOURCE, 2019–2027 (TERAWATT HOURS)
TABLE 03.GREEN POWER WIND MARKET, BY REGION, 2019–2027 ($MILLION)
TABLE 04.GREEN POWER WIND MARKET, BY REGION, 2019–2027 (TERAWATT HOURS)
TABLE 05.GREEN POWER SOLAR MARKET, BY REGION, 2019–2027 ($MILLION)
TABLE 06.GREEN POWER SOLAR MARKET, BY REGION, 2019–2027 (TERAWATT HOURS)
TABLE 07.GREEN POWER LOW IMPACT HYDRO MARKET, BY REGION, 2019–2027 ($MILLION)
TABLE 08.GREEN POWER LOW IMPACT HYDRO MARKET, BY REGION, 2019–2027 (TERAWATT HOURS)
TABLE 09.GREEN POWER BIOMASS MARKET, BY REGION, 2019–2027 ($MILLION)
TABLE 10.GREEN POWER BIOMASS MARKET, BY REGION, 2019–2027 (TERAWATT HOURS)
TABLE 11.GREEN POWER OTHERS MARKET, BY REGION, 2019–2027 ($MILLION)
TABLE 12.GREEN POWER OTHERS MARKET, BY REGION, 2019–2027 (TERAWATT HOURS)
TABLE 13.GLOBAL GREEN POWER MARKET, BY END-USE SECTOR, 2019–2027 ($MILLION)
TABLE 14.GLOBAL GREEN POWER MARKET, BY END-USE SECTOR, 2019–2027 (TERAWATT HOURS)
TABLE 15.GREEN POWER TRANSPORT MARKET, BY REGION, 2019–2027 ($MILLION)
TABLE 16.GREEN POWER TRANSPORT MARKET, BY REGION, 2019–2027 (TERAWATT HOURS)
TABLE 17.GREEN POWER INDUSTRIAL MARKET, BY REGION, 2019–2027 ($MILLION)
TABLE 18.GREEN POWER INDUSTRIAL MARKET, BY REGION, 2019–2027 (TERAWATT HOURS)
TABLE 19.GREEN POWER NON-COMBUSTED MARKET, BY REGION, 2019–2027 ($MILLION)
TABLE 20.GREEN POWER NON-COMBUSTED MARKET, BY REGION, 2019–2027 (TERAWATT HOURS)
TABLE 21.GREEN POWER BUILDINGS MARKET, BY REGION, 2019–2027 ($MILLION)
TABLE 22.GREEN POWER BUILDINGS MARKET, BY REGION, 2019–2027 (TERAWATT HOURS)
TABLE 23.GREEN POWER OTHERS MARKET, BY REGION, 2019–2027 ($MILLION)
TABLE 24.GREEN POWER OTHERS MARKET, BY REGION, 2019–2027 (TERAWATT HOURS)
TABLE 25.GREEN POWER MARKET, BY REGION, 2019-2027 ($MILLION)
TABLE 26.GREEN POWER MARKET, BY REGION, 2019-2027 (TW)
TABLE 27.NORTH AMERICA GREEN POWER MARKET, BY POWER SOURCE, 2019–2027 ($MILLION)
TABLE 28.NORTH AMERICA GREEN POWER MARKET, BY POWER SOURCE, 2019–2027 (TW)
TABLE 29.NORTH AMERICA GREEN POWER MARKET, BY DISEASE, 2019–2027 ($MILLION)
TABLE 30.NORTH AMERICA GREEN POWER MARKET, BY END-USE SECTOR, 2019–2027 (TW)
TABLE 31.NORTH AMERICA GREEN POWER MARKET, BY COUNTRY, 2019–2027 ($MILLION)
TABLE 32.NORTH AMERICA GREEN POWER MARKET, BY COUNTRY, 2019–2027 (TW)
TABLE 33.U.S. GREEN POWER MARKET, BY POWER SOURCE, 2019–2027 ($MILLION)
TABLE 34.U.S. GREEN POWER MARKET, BY POWER SOURCE, 2019–2027 (TW)
TABLE 35.U.S. GREEN POWER MARKET, BY END-USE SECTOR, 2019–2027 ($MILLION)
TABLE 36.U.S. GREEN POWER MARKET, BY END-USE SECTOR, 2019–2027 (TW)
TABLE 37.CANADA GREEN POWER MARKET, BY POWER SOURCE, 2019–2027 ($MILLION)
TABLE 38.CANADA GREEN POWER MARKET, BY POWER SOURCE, 2019–2027 (TW)
TABLE 39.CANADA GREEN POWER MARKET, BY END-USE SECTOR, 2019–2027 ($MILLION)
TABLE 40.CANADA GREEN POWER MARKET, BY END-USE SECTOR, 2019–2027 (TW)
TABLE 41.MEXICO GREEN POWER MARKET, BY POWER SOURCE, 2019–2027 ($MILLION)
TABLE 42.MEXICO GREEN POWER MARKET, BY POWER SOURCE, 2019–2027 (TW)
TABLE 43.MEXICO GREEN POWER MARKET, BY END-USE SECTOR, 2019–2027 ($MILLION)
TABLE 44.MEXICO GREEN POWER MARKET, BY END-USE SECTOR, 2019–2027 (TW)
TABLE 45.EUROPE GREEN POWER MARKET, BY POWER SOURCE, 2019–2027 ($MILLION)
TABLE 46.EUROPE GREEN POWER MARKET, BY POWER SOURCE, 2019–2027 (TW)
TABLE 47.EUROPE GREEN POWER MARKET, BY DISEASE, 2019–2027 ($MILLION)
TABLE 48.EUROPE GREEN POWER MARKET, BY END-USE SECTOR, 2019–2027 (TW)
TABLE 49.EUROPE GREEN POWER MARKET, BY COUNTRY, 2019–2027 ($MILLION)
TABLE 50.EUROPE GREEN POWER MARKET, BY COUNTRY, 2019–2027 (TW)
TABLE 51.GERMANY GREEN POWER MARKET, BY POWER SOURCE, 2019–2027 ($MILLION)
TABLE 52.GERMANY GREEN POWER MARKET, BY POWER SOURCE, 2019–2027 (TW)
TABLE 53.GERMANY GREEN POWER MARKET, BY END-USE SECTOR, 2019–2027 ($MILLION)
TABLE 54.GERMANY GREEN POWER MARKET, BY END-USE SECTOR, 2019–2027 (TW)
TABLE 55.FRANCE GREEN POWER MARKET, BY POWER SOURCE, 2019–2027 ($MILLION)
TABLE 56.FRANCE GREEN POWER MARKET, BY POWER SOURCE, 2019–2027 (TW)
TABLE 57.FRANCE GREEN POWER MARKET, BY END-USE SECTOR, 2019–2027 ($MILLION)
TABLE 58.FRANCE GREEN POWER MARKET, BY END-USE SECTOR, 2019–2027 (TW)
TABLE 59.UK GREEN POWER MARKET, BY POWER SOURCE, 2019–2027 ($MILLION)
TABLE 60.UK GREEN POWER MARKET, BY POWER SOURCE, 2019–2027 (TW)
TABLE 61.UK GREEN POWER MARKET, BY END-USE SECTOR, 2019–2027 ($MILLION)
TABLE 62.UK GREEN POWER MARKET, BY END-USE SECTOR, 2019–2027 (TW)
TABLE 63.ITALY GREEN POWER MARKET, BY POWER SOURCE, 2019–2027 ($MILLION)
TABLE 64.ITALY GREEN POWER MARKET, BY POWER SOURCE, 2019–2027 (TW)
TABLE 65.ITALY GREEN POWER MARKET, BY END-USE SECTOR, 2019–2027 ($MILLION)
TABLE 66.ITALY GREEN POWER MARKET, BY END-USE SECTOR, 2019–2027 (TW)
TABLE 67.SPAIN GREEN POWER MARKET, BY POWER SOURCE, 2019–2027 ($MILLION)
TABLE 68.SPAIN GREEN POWER MARKET, BY POWER SOURCE, 2019–2027 (TW)
TABLE 69.SPAIN GREEN POWER MARKET, BY END-USE SECTOR, 2019–2027 ($MILLION)
TABLE 70.SPAIN GREEN POWER MARKET, BY END-USE SECTOR, 2019–2027 (TW)
TABLE 71.SWEDEN GREEN POWER MARKET, BY POWER SOURCE, 2019–2027 ($MILLION)
TABLE 72.SWEDEN GREEN POWER MARKET, BY POWER SOURCE, 2019–2027 (TW)
TABLE 73.SWEDEN GREEN POWER MARKET, BY END-USE SECTOR, 2019–2027 ($MILLION)
TABLE 74.SWEDEN GREEN POWER MARKET, BY END-USE SECTOR, 2019–2027 (TW)
TABLE 75.REST OF EUROPE GREEN POWER MARKET, BY POWER SOURCE, 2019–2027 ($MILLION)
TABLE 76.REST OF EUROPE GREEN POWER MARKET, BY POWER SOURCE, 2019–2027 (TW)
TABLE 77.REST OF EUROPE GREEN POWER MARKET, BY END-USE SECTOR, 2019–2027 ($MILLION)
TABLE 78.REST OF EUROPE GREEN POWER MARKET, BY END-USE SECTOR, 2019–2027 (TW)
TABLE 79.ASIA-PACIFIC GREEN POWER MARKET, BY POWER SOURCE, 2019–2027 ($MILLION)
TABLE 80.ASIA-PACIFIC GREEN POWER MARKET, BY POWER SOURCE, 2019–2027 (TW)
TABLE 81.ASIA-PACIFIC GREEN POWER MARKET, BY DISEASE, 2019–2027 ($MILLION)
TABLE 82.ASIA-PACIFIC GREEN POWER MARKET, BY END-USE SECTOR, 2019–2027 (TW)
TABLE 83.ASIA-PACIFIC GREEN POWER MARKET, BY COUNTRY, 2019–2027 ($MILLION)
TABLE 84.ASIA-PACIFIC GREEN POWER MARKET, BY COUNTRY, 2019–2027 (TW)
TABLE 85.CHINA GREEN POWER MARKET, BY POWER SOURCE, 2019–2027 ($MILLION)
TABLE 86.CHINA GREEN POWER MARKET, BY POWER SOURCE, 2019–2027 (TW)
TABLE 87.CHINA GREEN POWER MARKET, BY END-USE SECTOR, 2019–2027 ($MILLION)
TABLE 88.CHINA GREEN POWER MARKET, BY END-USE SECTOR, 2019–2027 (TW)
TABLE 89.JAPAN GREEN POWER MARKET, BY POWER SOURCE, 2019–2027 ($MILLION)
TABLE 90.JAPAN GREEN POWER MARKET, BY POWER SOURCE, 2019–2027 (TW)
TABLE 91.JAPAN GREEN POWER MARKET, BY END-USE SECTOR, 2019–2027 ($MILLION)
TABLE 92.JAPAN GREEN POWER MARKET, BY END-USE SECTOR, 2019–2027 (TW)
TABLE 93.INDIA GREEN POWER MARKET, BY POWER SOURCE, 2019–2027 ($MILLION)
TABLE 94.INDIA GREEN POWER MARKET, BY POWER SOURCE, 2019–2027 (TW)
TABLE 95.INDIA GREEN POWER MARKET, BY END-USE SECTOR, 2019–2027 ($MILLION)
TABLE 96.INDIA GREEN POWER MARKET, BY END-USE SECTOR, 2019–2027 (TW)
TABLE 97.SOUTH KOREA GREEN POWER MARKET, BY POWER SOURCE, 2019–2027 ($MILLION)
TABLE 98.SOUTH KOREA GREEN POWER MARKET, BY POWER SOURCE, 2019–2027 (TW)
TABLE 99.SOUTH KOREA GREEN POWER MARKET, BY END-USE SECTOR, 2019–2027 ($MILLION)
TABLE 100.SOUTH KOREA GREEN POWER MARKET, BY END-USE SECTOR, 2019–2027 (TW)
TABLE 101.AUSTRALIA GREEN POWER MARKET, BY POWER SOURCE, 2019–2027 ($MILLION)
TABLE 102.AUSTRALIA GREEN POWER MARKET, BY POWER SOURCE, 2019–2027 (TW)
TABLE 103.AUSTRALIA GREEN POWER MARKET, BY END-USE SECTOR, 2019–2027 ($MILLION)
TABLE 104.AUSTRALIA GREEN POWER MARKET, BY END-USE SECTOR, 2019–2027 (TW)
TABLE 105.REST OF ASIA-PACIFIC GREEN POWER MARKET, BY POWER SOURCE, 2019–2027 ($MILLION)
TABLE 106.REST OF ASIA-PACIFIC GREEN POWER MARKET, BY POWER SOURCE, 2019–2027 (TW)
TABLE 107.REST OF ASIA-PACIFIC GREEN POWER MARKET, BY END-USE SECTOR, 2019–2027 ($MILLION)
TABLE 108.REST OF ASIA-PACIFIC GREEN POWER MARKET, BY END-USE SECTOR, 2019–2027 (TW)
TABLE 109.LAMEA GREEN POWER MARKET, BY POWER SOURCE, 2019–2027 ($MILLION)
TABLE 110.LAMEA GREEN POWER MARKET, BY POWER SOURCE, 2019–2027 (TW)
TABLE 111.LAMEA GREEN POWER MARKET, BY DISEASE, 2019–2027 ($MILLION)
TABLE 112.LAMEA GREEN POWER MARKET, BY END-USE SECTOR, 2019–2027 (TW)
TABLE 113.LAMEA GREEN POWER MARKET, BY COUNTRY, 2019–2027 ($MILLION)
TABLE 114.LAMEA GREEN POWER MARKET, BY COUNTRY, 2019–2027 (TW)
TABLE 115.BRAZIL GREEN POWER MARKET, BY POWER SOURCE, 2019–2027 ($MILLION)
TABLE 116.BRAZIL GREEN POWER MARKET, BY POWER SOURCE, 2019–2027 (TW)
TABLE 117.BRAZIL GREEN POWER MARKET, BY END-USE SECTOR, 2019–2027 ($MILLION)
TABLE 118.BRAZIL GREEN POWER MARKET, BY END-USE SECTOR, 2019–2027 (TW)
TABLE 119.ISRAEL GREEN POWER MARKET, BY POWER SOURCE, 2019–2027 ($MILLION)
TABLE 120.ISRAEL GREEN POWER MARKET, BY POWER SOURCE, 2019–2027 (TW)
TABLE 121.ISRAEL GREEN POWER MARKET, BY END-USE SECTOR, 2019–2027 ($MILLION)
TABLE 122.ISRAEL GREEN POWER MARKET, BY END-USE SECTOR, 2019–2027 (TW)
TABLE 123.SOUTH AFRICA GREEN POWER MARKET, BY POWER SOURCE, 2019–2027 ($MILLION)
TABLE 124.SOUTH AFRICA GREEN POWER MARKET, BY POWER SOURCE, 2019–2027 (TW)
TABLE 125.SOUTH AFRICA GREEN POWER MARKET, BY END-USE SECTOR, 2019–2027 ($MILLION)
TABLE 126.SOUTH AFRICA GREEN POWER MARKET, BY END-USE SECTOR, 2019–2027 (TW)
TABLE 127.MOROCCO GREEN POWER MARKET, BY POWER SOURCE, 2019–2027 ($MILLION)
TABLE 128.MOROCCO GREEN POWER MARKET, BY POWER SOURCE, 2019–2027 (TW)
TABLE 129.MOROCCO GREEN POWER MARKET, BY END-USE SECTOR, 2019–2027 ($MILLION)
TABLE 130.MOROCCO GREEN POWER MARKET, BY END-USE SECTOR, 2019–2027 (TW)
TABLE 131.REST OF LAMEA GREEN POWER MARKET, BY POWER SOURCE, 2019–2027 ($MILLION)
TABLE 132.REST OF LAMEA GREEN POWER MARKET, BY POWER SOURCE, 2019–2027 (TW)
TABLE 133.REST OF LAMEA GREEN POWER MARKET, BY END-USE SECTOR, 2019–2027 ($MILLION)
TABLE 134.REST OF LAMEA GREEN POWER MARKET, BY END-USE SECTOR, 2019–2027 (TW)
TABLE 135.KEY BUSINESS EXPANSION (2015-2020)
TABLE 136.KEY ACQUISITION (2015-2020)
TABLE 137.AGEL: COMPANY SNAPSHOT
TABLE 138.AGEL: PROJECT PORTFOLIO
TABLE 139.OVERALL FINANCIAL STATUS ($MILLION)
TABLE 140.AGEL: KEY DEVELOPMENTAL STRATEGIES
TABLE 141.GE: COMPANY SNAPSHOT
TABLE 142.GE: OPERTAING SEGMENTS
TABLE 143.GE: PROJECT PORTFOLIO
TABLE 144.OVERALL FINANCIAL STATUS ($MILLION)
TABLE 145.GE: KEY DEVELOPMENTAL STRATEGIES
TABLE 146.IBERDROLA: COMPANY SNAPSHOT
TABLE 147.IBERDROLA: PROJECT PORTFOLIO
TABLE 148.OVERALL FINANCIAL STATUS (MILLION)
TABLE 149.IBERDROLA: PROJECT PORTFOLIO
TABLE 150.JINKOSOLAR: COMPANY SNAPSHOT
TABLE 151.JINKOSOLAR: OPERATING SEGMENTS
TABLE 152.JINKOSOLAR: PROJECT PORTFOLIO
TABLE 153.OVERALL FINANCIAL STATUS (MILLION)
TABLE 154.NEXTERA ENERGY, INC.: COMPANY SNAPSHOT
TABLE 155.NEXTERA ENERGY, INC.: OPERATING SEGMENTS
TABLE 156.NEXTERA ENERGY, INC.: PROJECT PORTFOLIO
TABLE 157.OVERALL FINANCIAL STATUS (MILLION)
TABLE 158.ORSTED: COMPANY SNAPSHOT
TABLE 159.ORSTED: OPERATING SEGMENTS
TABLE 160.ORSTED: PROJECT PORTFOLIO
TABLE 161.OVERALL FINANCIAL STATUS (MILLION)
TABLE 162.SIEMENS GAMESA: COMPANY SNAPSHOT
TABLE 163.SIEMENS GAMESA: PROJECT PORTFOLIO
TABLE 164.SUZLON: COMPANY SNAPSHOT
TABLE 165.SUZLON: PROJECT PORTFOLIO
TABLE 166.OVERALL FINANCIAL STATUS (MILLION)
TABLE 167.TATA POWER: COMPANY SNAPSHOT
TABLE 168.TATA POWER: PROJECT PORTFOLIO
TABLE 169.OVERALL FINANCIAL STATUS (MILLION) LIST OF FIGURES
FIGURE 01.KEY MARKET SEGMENTS
FIGURE 02.GLOBAL GREEN POWER MARKET SNAPSHOT, BY SEGMENT
FIGURE 03.GREEN POWER MARKET SNAPSHOT, BY COUNTRY
FIGURE 04.TOP INVESTMENT POCKETS
FIGURE 05.HIGH BARGAINING POWER OF SUPPLIERS
FIGURE 06.HIGH THREAT OF NEW ENTRANTS
FIGURE 07.LOW THREAT OF SUBSTITUTES
FIGURE 08.HIGH INTENSITY OF RIVALRY
FIGURE 09.HIGH BARGAINING POWER OF BUYERS
FIGURE 10.PATENT ANALYSIS FOR GREEN POWER
FIGURE 11.VALUE CHAIN ANALYSIS FOR GREEN POWER MARKET
FIGURE 12.PARENT PEER MARKET ANALYSIS FOR GREEN POWER
FIGURE 13.GREEN POWER MARKET DYNAMICS
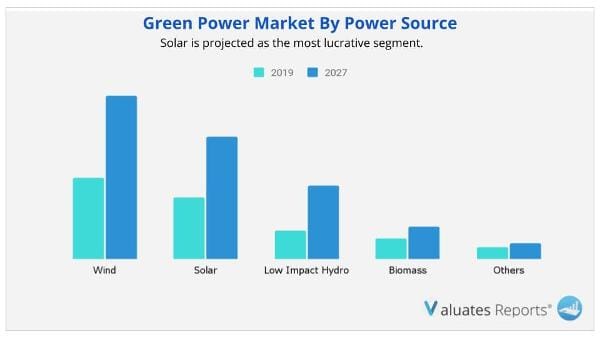
FIGURE 14.GLOBAL GREEN POWER MARKET, BY POWER SOURCE, 2019–2027 ($MILILION)
FIGURE 15.COMPARATIVE ANALYSIS OF GREEN POWER TABLET MARKET, BY COUNTRY, 2019 & 2027 ($MILLION)
FIGURE 16.COMPARATIVE ANALYSIS OF GREEN POWER SOLAR MARKET, BY COUNTRY, 2019 & 2027 ($MILLION)
FIGURE 17.COMPARATIVE ANALYSIS OF GREEN POWER LOW IMPACT HYDRO MARKET, BY COUNTRY, 2019 & 2027 ($MILLION)
FIGURE 18.COMPARATIVE ANALYSIS OF GREEN POWER BIOMASS MARKET, BY COUNTRY, 2019 & 2027 ($MILLION)
FIGURE 19.COMPARATIVE ANALYSIS OF GREEN POWER OTHERS MARKET, BY COUNTRY, 2019 & 2027 ($MILLION)
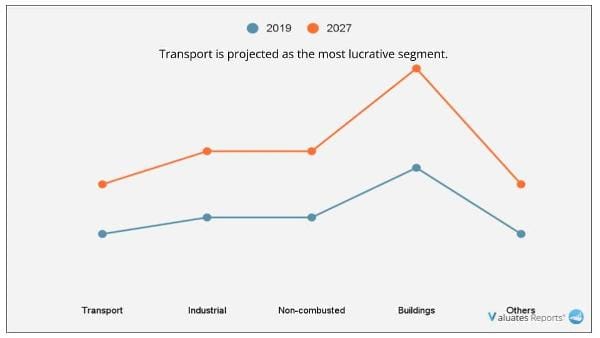
FIGURE 20.GLOBAL GREEN POWER MARKET, BY END-USE SECTOR, 2019–2027 ($MILILION)
FIGURE 21.COMPARATIVE ANALYSIS OF GREEN POWER TRANSPORT MARKET, BY COUNTRY, 2019 & 2027 ($MILLION)
FIGURE 22.COMPARATIVE ANALYSIS OF GREEN POWER INDUSTRIAL MARKET, BY COUNTRY, 2019 & 2027 ($MILLION)
FIGURE 23.COMPARATIVE ANALYSIS OF GREEN POWER NON-COMBUSTED MARKET, BY COUNTRY, 2019 & 2027 ($MILLION)
FIGURE 24.COMPARATIVE ANALYSIS OF GREEN POWER BUILDINGS MARKET, BY COUNTRY, 2019 & 2027 ($MILLION)
FIGURE 25.COMPARATIVE ANALYSIS OF GREEN POWER OTHERS MARKET, BY COUNTRY, 2019 & 2027 ($MILLION)
FIGURE 26.U.S. GREEN POWER MARKET REVENUE, 2019–2027 (MILLION)
FIGURE 27.CANADA GREEN POWER MARKET REVENUE, 2019–2027 (MILLION)
FIGURE 28.MEXICO GREEN POWER MARKET REVENUE, 2019–2027 (MILLION)
FIGURE 29.GERMANY GREEN POWER MARKET REVENUE, 2019–2027 (MILLION)
FIGURE 30.FRANCE GREEN POWER MARKET REVENUE, 2019–2027 (MILLION)
FIGURE 31.UK GREEN POWER MARKET REVENUE, 2019–2027 (MILLION)
FIGURE 32.ITALY GREEN POWER MARKET REVENUE, 2019–2027 (MILLION)
FIGURE 33.SPAIN GREEN POWER MARKET REVENUE, 2019–2027 (MILLION)
FIGURE 34.SWEDEN GREEN POWER MARKET REVENUE, 2019–2027 (MILLION)
FIGURE 35.REST OF EUROPE GREEN POWER MARKET REVENUE, 2019–2027 (MILLION)
FIGURE 36.CHINA GREEN POWER MARKET REVENUE, 2019–2027 (MILLION)
FIGURE 37.JAPAN GREEN POWER MARKET REVENUE, 2019–2027 (MILLION)
FIGURE 38.INDIA GREEN POWER MARKET REVENUE, 2019–2027 (MILLION)
FIGURE 39.SOUTH KOREA GREEN POWER MARKET REVENUE, 2019–2027 (MILLION)
FIGURE 40.AUSTRALIA GREEN POWER MARKET REVENUE, 2019–2027 (MILLION)
FIGURE 41.REST OF ASIA-PACIFIC GREEN POWER MARKET REVENUE, 2019–2027 (MILLION)
FIGURE 42.BRAZIL GREEN POWER MARKET REVENUE, 2019–2027 (MILLION)
FIGURE 43.ISRAEL GREEN POWER MARKET REVENUE, 2019–2027 (MILLION)
FIGURE 44.SOUTH AFRICA GREEN POWER MARKET REVENUE, 2019–2027 (MILLION)
FIGURE 45.MOROCCO GREEN POWER MARKET REVENUE, 2019–2027 (MILLION)
FIGURE 46.REST OF LAMEA GREEN POWER MARKET REVENUE, 2019–2027 (MILLION)
FIGURE 47.MARKET PLAYER POSITIONING, 2019
FIGURE 48.TOP WINNING STRATEGIES, BY YEAR
FIGURE 49.TOP WINNING STRATEGIES, BY STRATEGIES
FIGURE 50.TOP WINNING STRATEGIES, BY COMPANY
FIGURE 51.AGEL: NET SALES, 2017–2019 ($MILLION)
FIGURE 52.AGEL: REVENUE SHARE BY SECTOR IN TERMS OF TERAWATT HOURS, 2019 (%)
FIGURE 53.GE: NET SALES, 2017–2019 (MILLION)
FIGURE 54.GE: REVENUE SHARE BY SEGMENT, 2019 (%)
FIGURE 55.GE: REVENUE SHARE BY REGION, 2019 (%)
FIGURE 56.IBERDROLA: NET SALES, 2017–2019 (MILLION)
FIGURE 57.IBERDROLA: REVENUE SHARE BY SEGMENT, 2019 (%)
FIGURE 58.IBERDROLA: REVENUE SHARE BY REGION, 2019 (%)
FIGURE 59.JINKOSOLAR: NET SALES, 2017–2019 (MILLION)
FIGURE 60.JINKOSOLAR: REVENUE SHARE BY SEGMENT, 2019 (%)
FIGURE 61.JINKOSOLAR: REVENUE SHARE BY REGION, 2019 (%)
FIGURE 62.JINKOSOLAR: REVENUE SHARE BY DIVISION, 2019 (%)
FIGURE 63.NEXTERA ENERGY, INC.: NET SALES, 2017–2019 (MILLION)
FIGURE 64.NEXTERA ENERGY, INC.: REVENUE SHARE BY SEGMENT, 2019 (%)
FIGURE 65.NEXTERA ENERGY, INC.: REVENUE SHARE BY REGION, 2019 (%)
FIGURE 66.ORSTED: NET SALES, 2017–2019 (MILLION)
FIGURE 67.ORSTED: REVENUE SHARE BY SEGMENT, 2019 (%)
FIGURE 68.ORSTED: REVENUE SHARE BY REGION, 2019 (%)
FIGURE 69.SUZLON: NET SALES, 2017–2019 (MILLION)
FIGURE 70.SUZLON: REVENUE SHARE BY SEGMENT, 2019 (%)
FIGURE 71.TATA POWER: NET SALES, 2017–2019 (MILLION)
FIGURE 72.TATA POWER: REVENUE SHARE BY REGION, 2019 (%)