
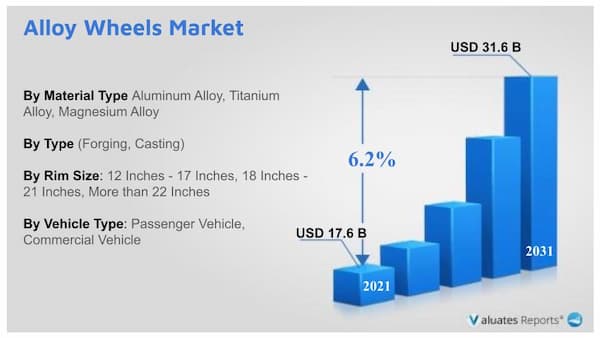
The global alloy wheels market size was valued at USD 17.6 Billion in 2021, and is projected to reach USD 31.6 Billion by 2031, growing at a CAGR of 6.2% from 2022 to 2031. Alloy wheels are lightweight wheels made of aluminum alloys that have a high weight-to-strength ratio. These alloy wheels are commonly found in automobiles, sports cars, and other light commercial vehicles. The aluminum wheel has good corrosion resistance, high-speed stability, and less wear at lower working speeds.
Alloy wheels are made of an alloy of aluminum, carbon epoxy, E-glass epoxy, titanium, and magnesium. Due to their lighter weight, alloy wheels are different from standard steel wheels. Lightweight wheels, such as alloy wheels, can significantly improve a car's control. The rising need for lightweight, fuel-efficient cars, the inclination of consumers for fashionable, customized cars, and the expansion of the automotive sector are some of the majors factors attributed to the significant growth of the global alloy wheels market.
Due to their high price, alloy wheels may not be the best choice for buyers on a tight budget who value affordability more than style and functionality. Furthermore, people wishing to enhance their vehicle may find the expense of alloy wheels to be prohibitive.
Car lovers favor alloy wheels since they not only improve the vehicle's appearance but also offer better performance, greater fuel economy, and lighter weight. Additionally, there is a considerable need for alloy wheels in emerging economies like China, India, and Brazil due to the expansion of the automotive sector in these countries. Additionally, the popularity of customizing automobiles has increased demand for alloy wheels.
The key players profiled in the automotive alloy wheel market report include Steel Strips Wheels Limited, Status Wheel, RONAL GROUP, CMWheels, MHT Luxury Wheels, Enkei International, Inc., BORBET GmbH, Maxion Wheels, UNIWHEELS Group, Superior Industries, and Others.
The alloy wheels market is segmented on the basis of material type, type, rim size, vehicle type, and region. By material type, the market is divided into aluminum alloy, titanium alloy, and magnesium alloy. As per type, the market has been categorized into forging, casting, and others. According to rim size, the market is classified into 12 Inches - 17 Inches, 18 Inches - 21 Inches, and More than 22 Inches. Depending on vehicle type, the market is divided into passenger vehicle and commercial vehicle. Region wise, the market is analyzed across North America, Europe, Asia-Pacific, and LAMEA.
The 18 inches -21 inches sub-segment dominated the global market in 2021 and is anticipated to continue its dominance over the forecast period. The 18 inches - 21 inches low-profile tires provides best experience to the drivers in handling the curves. This is because running around bends requires tighter steering that is more reliable due to the tire's lower flexibility and stickier tire compound. The sidewall of 18- to 21-inch tires is often thinner, which keeps a lot more stiffness on the road. Some vehicles' drivers may notice a minor improvement in cornering handling thanks to the enhanced rigidity. During the analysis timeframe, these factors are projected to accelerate the expansion of the 18 inches–21 inches sub-segment.
By vehicle type, the passenger vehicles sub-segment dominated the market in 2021 and is anticipated to continue its dominance over the forecast period. The growth is majorly attributed to the rapid growth in the sales of the passenger vehicle in the recent years.
By material type, the aluminum alloy sub-segment held the highest market share in 2021 and is anticipated to continue its dominance over the forecast period. Aluminum alloy wheel is the lightest alloy wheel among the types of alloy wheels. Aluminum alloy wheel weighs almost 20% lesser than the other alloy wheels which makes it more preferable for the customers and this is the main factor for the growth of the aluminum alloy wheels.
By type, the forging sub-segment dominated the global alloy wheels market share in 2021. These wheels are stronger, longer-lasting, and corrosion- and oxidation-resistant thanks to the forging process. In addition, the wheel's structural integrity is preserved. The performance and fuel economy of a vehicle are both improved with forged wheels. The ideal option when aluminum components need to exhibit maximum strength and performance while being lightweight is forged aluminum since it is strong. Forging improves chemical consistency and increases structural strength by reducing internal gaps and gas pockets that degrade metal components.
By region, North America dominated the global alloy wheels market in 2021. The Asia-Pacific alloy wheels market is rapidly growing during the projected period and is anticipated to lead the automobile wheel market. China and India are primarily responsible for this expansion. Due to the largest population density in the world, with two densely populated countries, China and India, the region will have the biggest worldwide demand for automobiles during the projected period, accounting for nearly 60% of the world's vehicles. People's income levels are rising extremely quickly in this region as well. The Asia-Pacific region has the maximum population of middle-class residents who are concerned about automobile fuel efficiency. The fuel economy is anticipated to increase as the vehicle's overall weight decreases.
| Report Metric | Details |
| Report Name | Alloy Wheels Market |
| Accounted market size in 2021 | US$ 17.6 Billion |
| Forecasted market size in 2031 | US$ 31.6 Billion |
| CAGR | 6.2% |
| Base Year | 2022 |
| Forecasted years | 2023 - 2031 |
| Segment by Type |
|
| Segment by Rim Size |
|
| Segment by Vehicle Type |
|
| Segment by Material Type |
|
| By Region |
|
| By Company | Stamford Sport Wheels, MAXION Wheels, Fuel Off-Road Wheels, CITIC Dicastal Wheel Manufacturing Co, Enkei Corporation, BORBET GmbH, Steel Strips Wheels Ltd (SSWL), TSW Alloy Wheels, Superior Industries International, Inc., RONAL GROUP, MHT Luxury Wheels |
| Forecast units | USD million in value |
| Report coverage | Revenue and volume forecast, company share, competitive landscape, growth factors and trends |
Chapter 1 : INTRODUCTION
1.1. Report description
1.2. Key market segments
1.3. Key benefits to the stakeholders
1.4. Research methodology
1.4.1. Primary research
1.4.2. Secondary research
1.4.3. Analyst tools and models
Chapter 2 : EXECUTIVE SUMMARY
2.1. CXO Perspective
Chapter 3 : MARKET OVERVIEW
3.1. Market definition and scope
3.2. Key findings
3.2.1. Top impacting factors
3.2.2. Top investment pockets
3.3. Porter’s five forces analysis
3.4. Market dynamics
3.4.1. Drivers
3.4.2. Restraints
3.4.3. Opportunities
3.5. Market Share Analysis
3.6. Value Chain Analysis
3.7. Regulatory Guidelines
3.8. Key Regulation Analysis
3.9. Patent Landscape
Chapter 4 : ALLOY WHEELS MARKET, BY MATERIAL TYPE
4.1. Overview
4.1.1. Market size and forecast
4.2. Aluminum Alloy
4.2.1. Key market trends, growth factors and opportunities
4.2.2. Market size and forecast, by region
4.2.3. Market share analysis by country
4.3. Titanium Alloy
4.3.1. Key market trends, growth factors and opportunities
4.3.2. Market size and forecast, by region
4.3.3. Market share analysis by country
4.4. Magnesium Alloy
4.4.1. Key market trends, growth factors and opportunities
4.4.2. Market size and forecast, by region
4.4.3. Market share analysis by country
Chapter 5 : ALLOY WHEELS MARKET, BY TYPE
5.1. Overview
5.1.1. Market size and forecast
5.2. Forging
5.2.1. Key market trends, growth factors and opportunities
5.2.2. Market size and forecast, by region
5.2.3. Market share analysis by country
5.3. Casting
5.3.1. Key market trends, growth factors and opportunities
5.3.2. Market size and forecast, by region
5.3.3. Market share analysis by country
5.4. Others
5.4.1. Key market trends, growth factors and opportunities
5.4.2. Market size and forecast, by region
5.4.3. Market share analysis by country
Chapter 6 : ALLOY WHEELS MARKET, BY RIM SIZE
6.1. Overview
6.1.1. Market size and forecast
6.2. 12 Inches - 17 Inches
6.2.1. Key market trends, growth factors and opportunities
6.2.2. Market size and forecast, by region
6.2.3. Market share analysis by country
6.3. 18 Inches - 21 Inches
6.3.1. Key market trends, growth factors and opportunities
6.3.2. Market size and forecast, by region
6.3.3. Market share analysis by country
6.4. More than 22 Inches
6.4.1. Key market trends, growth factors and opportunities
6.4.2. Market size and forecast, by region
6.4.3. Market share analysis by country
Chapter 7 : ALLOY WHEELS MARKET, BY VEHICLE TYPE
7.1. Overview
7.1.1. Market size and forecast
7.2. Passenger Vehicle
7.2.1. Key market trends, growth factors and opportunities
7.2.2. Market size and forecast, by region
7.2.3. Market share analysis by country
7.3. Commercial Vehicle
7.3.1. Key market trends, growth factors and opportunities
7.3.2. Market size and forecast, by region
7.3.3. Market share analysis by country
Chapter 8 : ALLOY WHEELS MARKET, BY REGION
8.1. Overview
8.1.1. Market size and forecast By Region
8.2. North America
8.2.1. Key market trends, growth factors and opportunities
8.2.2. Market size and forecast, by Material Type
8.2.3. Market size and forecast, by Type
8.2.4. Market size and forecast, by Rim Size
8.2.5. Market size and forecast, by Vehicle Type
8.2.6. Market size and forecast, by country
8.2.6.1. U.S.
8.2.6.1.1. Market size and forecast, by Material Type
8.2.6.1.2. Market size and forecast, by Type
8.2.6.1.3. Market size and forecast, by Rim Size
8.2.6.1.4. Market size and forecast, by Vehicle Type
8.2.6.2. Canada
8.2.6.2.1. Market size and forecast, by Material Type
8.2.6.2.2. Market size and forecast, by Type
8.2.6.2.3. Market size and forecast, by Rim Size
8.2.6.2.4. Market size and forecast, by Vehicle Type
8.2.6.3. Mexico
8.2.6.3.1. Market size and forecast, by Material Type
8.2.6.3.2. Market size and forecast, by Type
8.2.6.3.3. Market size and forecast, by Rim Size
8.2.6.3.4. Market size and forecast, by Vehicle Type
8.3. Europe
8.3.1. Key market trends, growth factors and opportunities
8.3.2. Market size and forecast, by Material Type
8.3.3. Market size and forecast, by Type
8.3.4. Market size and forecast, by Rim Size
8.3.5. Market size and forecast, by Vehicle Type
8.3.6. Market size and forecast, by country
8.3.6.1. Germany
8.3.6.1.1. Market size and forecast, by Material Type
8.3.6.1.2. Market size and forecast, by Type
8.3.6.1.3. Market size and forecast, by Rim Size
8.3.6.1.4. Market size and forecast, by Vehicle Type
8.3.6.2. UK
8.3.6.2.1. Market size and forecast, by Material Type
8.3.6.2.2. Market size and forecast, by Type
8.3.6.2.3. Market size and forecast, by Rim Size
8.3.6.2.4. Market size and forecast, by Vehicle Type
8.3.6.3. France
8.3.6.3.1. Market size and forecast, by Material Type
8.3.6.3.2. Market size and forecast, by Type
8.3.6.3.3. Market size and forecast, by Rim Size
8.3.6.3.4. Market size and forecast, by Vehicle Type
8.3.6.4. Spain
8.3.6.4.1. Market size and forecast, by Material Type
8.3.6.4.2. Market size and forecast, by Type
8.3.6.4.3. Market size and forecast, by Rim Size
8.3.6.4.4. Market size and forecast, by Vehicle Type
8.3.6.5. Italy
8.3.6.5.1. Market size and forecast, by Material Type
8.3.6.5.2. Market size and forecast, by Type
8.3.6.5.3. Market size and forecast, by Rim Size
8.3.6.5.4. Market size and forecast, by Vehicle Type
8.3.6.6. Rest of Europe
8.3.6.6.1. Market size and forecast, by Material Type
8.3.6.6.2. Market size and forecast, by Type
8.3.6.6.3. Market size and forecast, by Rim Size
8.3.6.6.4. Market size and forecast, by Vehicle Type
8.4. Asia-Pacific
8.4.1. Key market trends, growth factors and opportunities
8.4.2. Market size and forecast, by Material Type
8.4.3. Market size and forecast, by Type
8.4.4. Market size and forecast, by Rim Size
8.4.5. Market size and forecast, by Vehicle Type
8.4.6. Market size and forecast, by country
8.4.6.1. China
8.4.6.1.1. Market size and forecast, by Material Type
8.4.6.1.2. Market size and forecast, by Type
8.4.6.1.3. Market size and forecast, by Rim Size
8.4.6.1.4. Market size and forecast, by Vehicle Type
8.4.6.2. Japan
8.4.6.2.1. Market size and forecast, by Material Type
8.4.6.2.2. Market size and forecast, by Type
8.4.6.2.3. Market size and forecast, by Rim Size
8.4.6.2.4. Market size and forecast, by Vehicle Type
8.4.6.3. India
8.4.6.3.1. Market size and forecast, by Material Type
8.4.6.3.2. Market size and forecast, by Type
8.4.6.3.3. Market size and forecast, by Rim Size
8.4.6.3.4. Market size and forecast, by Vehicle Type
8.4.6.4. South Korea
8.4.6.4.1. Market size and forecast, by Material Type
8.4.6.4.2. Market size and forecast, by Type
8.4.6.4.3. Market size and forecast, by Rim Size
8.4.6.4.4. Market size and forecast, by Vehicle Type
8.4.6.5. Australia
8.4.6.5.1. Market size and forecast, by Material Type
8.4.6.5.2. Market size and forecast, by Type
8.4.6.5.3. Market size and forecast, by Rim Size
8.4.6.5.4. Market size and forecast, by Vehicle Type
8.4.6.6. Rest of Asia-Pacific
8.4.6.6.1. Market size and forecast, by Material Type
8.4.6.6.2. Market size and forecast, by Type
8.4.6.6.3. Market size and forecast, by Rim Size
8.4.6.6.4. Market size and forecast, by Vehicle Type
8.5. LAMEA
8.5.1. Key market trends, growth factors and opportunities
8.5.2. Market size and forecast, by Material Type
8.5.3. Market size and forecast, by Type
8.5.4. Market size and forecast, by Rim Size
8.5.5. Market size and forecast, by Vehicle Type
8.5.6. Market size and forecast, by country
8.5.6.1. Brazil
8.5.6.1.1. Market size and forecast, by Material Type
8.5.6.1.2. Market size and forecast, by Type
8.5.6.1.3. Market size and forecast, by Rim Size
8.5.6.1.4. Market size and forecast, by Vehicle Type
8.5.6.2. Saudi Arabia
8.5.6.2.1. Market size and forecast, by Material Type
8.5.6.2.2. Market size and forecast, by Type
8.5.6.2.3. Market size and forecast, by Rim Size
8.5.6.2.4. Market size and forecast, by Vehicle Type
8.5.6.3. United Arab Emirates
8.5.6.3.1. Market size and forecast, by Material Type
8.5.6.3.2. Market size and forecast, by Type
8.5.6.3.3. Market size and forecast, by Rim Size
8.5.6.3.4. Market size and forecast, by Vehicle Type
8.5.6.4. South Africa
8.5.6.4.1. Market size and forecast, by Material Type
8.5.6.4.2. Market size and forecast, by Type
8.5.6.4.3. Market size and forecast, by Rim Size
8.5.6.4.4. Market size and forecast, by Vehicle Type
8.5.6.5. Rest of LAMEA
8.5.6.5.1. Market size and forecast, by Material Type
8.5.6.5.2. Market size and forecast, by Type
8.5.6.5.3. Market size and forecast, by Rim Size
8.5.6.5.4. Market size and forecast, by Vehicle Type
Chapter 9 : COMPETITIVE LANDSCAPE
9.1. Introduction
9.2. Top winning strategies
9.3. Product mapping of top 10 player
9.4. Competitive dashboard
9.5. Competitive heatmap
9.6. Top player positioning, 2021
Chapter 10 : COMPANY PROFILES
10.1. MAXION Wheels
10.1.1. Company overview
10.1.2. Key executives
10.1.3. Company snapshot
10.2. BORBET GmbH
10.2.1. Company overview
10.2.2. Key executives
10.2.3. Company snapshot
10.3. Enkei Corporation
10.3.1. Company overview
10.3.2. Key executives
10.3.3. Company snapshot
10.4. MHT Luxury Wheels
10.4.1. Company overview
10.4.2. Key executives
10.4.3. Company snapshot
10.5. RONAL GROUP
10.5.1. Company overview
10.5.2. Key executives
10.5.3. Company snapshot
10.6. Stamford Sport Wheels
10.6.1. Company overview
10.6.2. Key executives
10.6.3. Company snapshot
10.7. Superior Industries International, Inc.
10.7.1. Company overview
10.7.2. Key executives
10.7.3. Company snapshot
10.8. TSW Alloy Wheels
10.8.1. Company overview
10.8.2. Key executives
10.8.3. Company snapshot
10.9. Fuel Off-Road Wheels
10.9.1. Company overview
10.9.2. Key executives
10.9.3. Company snapshot
10.10. CITIC Dicastal Wheel Manufacturing Co
10.10.1. Company overview
10.10.2. Key executives
10.10.3. Company snapshot
10.11. Steel Strips Wheels Ltd (SSWL)
10.11.1. Company overview
10.11.2. Key executives
10.11.3. Company snapshot
List of Tables
TABLE 01. GLOBAL ALLOY WHEELS MARKET, BY MATERIAL TYPE, 2021-2031 ($MILLION)
TABLE 02. ALLOY WHEELS MARKET FOR ALUMINUM ALLOY, BY REGION, 2021-2031 ($MILLION)
TABLE 03. ALLOY WHEELS MARKET FOR TITANIUM ALLOY, BY REGION, 2021-2031 ($MILLION)
TABLE 04. ALLOY WHEELS MARKET FOR MAGNESIUM ALLOY, BY REGION, 2021-2031 ($MILLION)
TABLE 05. GLOBAL ALLOY WHEELS MARKET, BY TYPE, 2021-2031 ($MILLION)
TABLE 06. ALLOY WHEELS MARKET FOR FORGING, BY REGION, 2021-2031 ($MILLION)
TABLE 07. ALLOY WHEELS MARKET FOR CASTING, BY REGION, 2021-2031 ($MILLION)
TABLE 08. ALLOY WHEELS MARKET FOR OTHERS, BY REGION, 2021-2031 ($MILLION)
TABLE 09. GLOBAL ALLOY WHEELS MARKET, BY RIM SIZE, 2021-2031 ($MILLION)
TABLE 10. ALLOY WHEELS MARKET FOR 12 INCHES - 17 INCHES, BY REGION, 2021-2031 ($MILLION)
TABLE 11. ALLOY WHEELS MARKET FOR 18 INCHES - 21 INCHES, BY REGION, 2021-2031 ($MILLION)
TABLE 12. ALLOY WHEELS MARKET FOR MORE THAN 22 INCHES, BY REGION, 2021-2031 ($MILLION)
TABLE 13. GLOBAL ALLOY WHEELS MARKET, BY VEHICLE TYPE, 2021-2031 ($MILLION)
TABLE 14. ALLOY WHEELS MARKET FOR PASSENGER VEHICLE, BY REGION, 2021-2031 ($MILLION)
TABLE 15. ALLOY WHEELS MARKET FOR COMMERCIAL VEHICLE, BY REGION, 2021-2031 ($MILLION)
TABLE 16. ALLOY WHEELS MARKET, BY REGION, 2021-2031 ($MILLION)
TABLE 17. NORTH AMERICA ALLOY WHEELS MARKET, BY MATERIAL TYPE, 2021-2031 ($MILLION)
TABLE 18. NORTH AMERICA ALLOY WHEELS MARKET, BY TYPE, 2021-2031 ($MILLION)
TABLE 19. NORTH AMERICA ALLOY WHEELS MARKET, BY RIM SIZE, 2021-2031 ($MILLION)
TABLE 20. NORTH AMERICA ALLOY WHEELS MARKET, BY VEHICLE TYPE, 2021-2031 ($MILLION)
TABLE 21. NORTH AMERICA ALLOY WHEELS MARKET, BY COUNTRY, 2021-2031 ($MILLION)
TABLE 22. U.S. ALLOY WHEELS MARKET, BY MATERIAL TYPE, 2021-2031 ($MILLION)
TABLE 23. U.S. ALLOY WHEELS MARKET, BY TYPE, 2021-2031 ($MILLION)
TABLE 24. U.S. ALLOY WHEELS MARKET, BY RIM SIZE, 2021-2031 ($MILLION)
TABLE 25. U.S. ALLOY WHEELS MARKET, BY VEHICLE TYPE, 2021-2031 ($MILLION)
TABLE 26. CANADA ALLOY WHEELS MARKET, BY MATERIAL TYPE, 2021-2031 ($MILLION)
TABLE 27. CANADA ALLOY WHEELS MARKET, BY TYPE, 2021-2031 ($MILLION)
TABLE 28. CANADA ALLOY WHEELS MARKET, BY RIM SIZE, 2021-2031 ($MILLION)
TABLE 29. CANADA ALLOY WHEELS MARKET, BY VEHICLE TYPE, 2021-2031 ($MILLION)
TABLE 30. MEXICO ALLOY WHEELS MARKET, BY MATERIAL TYPE, 2021-2031 ($MILLION)
TABLE 31. MEXICO ALLOY WHEELS MARKET, BY TYPE, 2021-2031 ($MILLION)
TABLE 32. MEXICO ALLOY WHEELS MARKET, BY RIM SIZE, 2021-2031 ($MILLION)
TABLE 33. MEXICO ALLOY WHEELS MARKET, BY VEHICLE TYPE, 2021-2031 ($MILLION)
TABLE 34. EUROPE ALLOY WHEELS MARKET, BY MATERIAL TYPE, 2021-2031 ($MILLION)
TABLE 35. EUROPE ALLOY WHEELS MARKET, BY TYPE, 2021-2031 ($MILLION)
TABLE 36. EUROPE ALLOY WHEELS MARKET, BY RIM SIZE, 2021-2031 ($MILLION)
TABLE 37. EUROPE ALLOY WHEELS MARKET, BY VEHICLE TYPE, 2021-2031 ($MILLION)
TABLE 38. EUROPE ALLOY WHEELS MARKET, BY COUNTRY, 2021-2031 ($MILLION)
TABLE 39. GERMANY ALLOY WHEELS MARKET, BY MATERIAL TYPE, 2021-2031 ($MILLION)
TABLE 40. GERMANY ALLOY WHEELS MARKET, BY TYPE, 2021-2031 ($MILLION)
TABLE 41. GERMANY ALLOY WHEELS MARKET, BY RIM SIZE, 2021-2031 ($MILLION)
TABLE 42. GERMANY ALLOY WHEELS MARKET, BY VEHICLE TYPE, 2021-2031 ($MILLION)
TABLE 43. UK ALLOY WHEELS MARKET, BY MATERIAL TYPE, 2021-2031 ($MILLION)
TABLE 44. UK ALLOY WHEELS MARKET, BY TYPE, 2021-2031 ($MILLION)
TABLE 45. UK ALLOY WHEELS MARKET, BY RIM SIZE, 2021-2031 ($MILLION)
TABLE 46. UK ALLOY WHEELS MARKET, BY VEHICLE TYPE, 2021-2031 ($MILLION)
TABLE 47. FRANCE ALLOY WHEELS MARKET, BY MATERIAL TYPE, 2021-2031 ($MILLION)
TABLE 48. FRANCE ALLOY WHEELS MARKET, BY TYPE, 2021-2031 ($MILLION)
TABLE 49. FRANCE ALLOY WHEELS MARKET, BY RIM SIZE, 2021-2031 ($MILLION)
TABLE 50. FRANCE ALLOY WHEELS MARKET, BY VEHICLE TYPE, 2021-2031 ($MILLION)
TABLE 51. SPAIN ALLOY WHEELS MARKET, BY MATERIAL TYPE, 2021-2031 ($MILLION)
TABLE 52. SPAIN ALLOY WHEELS MARKET, BY TYPE, 2021-2031 ($MILLION)
TABLE 53. SPAIN ALLOY WHEELS MARKET, BY RIM SIZE, 2021-2031 ($MILLION)
TABLE 54. SPAIN ALLOY WHEELS MARKET, BY VEHICLE TYPE, 2021-2031 ($MILLION)
TABLE 55. ITALY ALLOY WHEELS MARKET, BY MATERIAL TYPE, 2021-2031 ($MILLION)
TABLE 56. ITALY ALLOY WHEELS MARKET, BY TYPE, 2021-2031 ($MILLION)
TABLE 57. ITALY ALLOY WHEELS MARKET, BY RIM SIZE, 2021-2031 ($MILLION)
TABLE 58. ITALY ALLOY WHEELS MARKET, BY VEHICLE TYPE, 2021-2031 ($MILLION)
TABLE 59. REST OF EUROPE ALLOY WHEELS MARKET, BY MATERIAL TYPE, 2021-2031 ($MILLION)
TABLE 60. REST OF EUROPE ALLOY WHEELS MARKET, BY TYPE, 2021-2031 ($MILLION)
TABLE 61. REST OF EUROPE ALLOY WHEELS MARKET, BY RIM SIZE, 2021-2031 ($MILLION)
TABLE 62. REST OF EUROPE ALLOY WHEELS MARKET, BY VEHICLE TYPE, 2021-2031 ($MILLION)
TABLE 63. ASIA-PACIFIC ALLOY WHEELS MARKET, BY MATERIAL TYPE, 2021-2031 ($MILLION)
TABLE 64. ASIA-PACIFIC ALLOY WHEELS MARKET, BY TYPE, 2021-2031 ($MILLION)
TABLE 65. ASIA-PACIFIC ALLOY WHEELS MARKET, BY RIM SIZE, 2021-2031 ($MILLION)
TABLE 66. ASIA-PACIFIC ALLOY WHEELS MARKET, BY VEHICLE TYPE, 2021-2031 ($MILLION)
TABLE 67. ASIA-PACIFIC ALLOY WHEELS MARKET, BY COUNTRY, 2021-2031 ($MILLION)
TABLE 68. CHINA ALLOY WHEELS MARKET, BY MATERIAL TYPE, 2021-2031 ($MILLION)
TABLE 69. CHINA ALLOY WHEELS MARKET, BY TYPE, 2021-2031 ($MILLION)
TABLE 70. CHINA ALLOY WHEELS MARKET, BY RIM SIZE, 2021-2031 ($MILLION)
TABLE 71. CHINA ALLOY WHEELS MARKET, BY VEHICLE TYPE, 2021-2031 ($MILLION)
TABLE 72. JAPAN ALLOY WHEELS MARKET, BY MATERIAL TYPE, 2021-2031 ($MILLION)
TABLE 73. JAPAN ALLOY WHEELS MARKET, BY TYPE, 2021-2031 ($MILLION)
TABLE 74. JAPAN ALLOY WHEELS MARKET, BY RIM SIZE, 2021-2031 ($MILLION)
TABLE 75. JAPAN ALLOY WHEELS MARKET, BY VEHICLE TYPE, 2021-2031 ($MILLION)
TABLE 76. INDIA ALLOY WHEELS MARKET, BY MATERIAL TYPE, 2021-2031 ($MILLION)
TABLE 77. INDIA ALLOY WHEELS MARKET, BY TYPE, 2021-2031 ($MILLION)
TABLE 78. INDIA ALLOY WHEELS MARKET, BY RIM SIZE, 2021-2031 ($MILLION)
TABLE 79. INDIA ALLOY WHEELS MARKET, BY VEHICLE TYPE, 2021-2031 ($MILLION)
TABLE 80. SOUTH KOREA ALLOY WHEELS MARKET, BY MATERIAL TYPE, 2021-2031 ($MILLION)
TABLE 81. SOUTH KOREA ALLOY WHEELS MARKET, BY TYPE, 2021-2031 ($MILLION)
TABLE 82. SOUTH KOREA ALLOY WHEELS MARKET, BY RIM SIZE, 2021-2031 ($MILLION)
TABLE 83. SOUTH KOREA ALLOY WHEELS MARKET, BY VEHICLE TYPE, 2021-2031 ($MILLION)
TABLE 84. AUSTRALIA ALLOY WHEELS MARKET, BY MATERIAL TYPE, 2021-2031 ($MILLION)
TABLE 85. AUSTRALIA ALLOY WHEELS MARKET, BY TYPE, 2021-2031 ($MILLION)
TABLE 86. AUSTRALIA ALLOY WHEELS MARKET, BY RIM SIZE, 2021-2031 ($MILLION)
TABLE 87. AUSTRALIA ALLOY WHEELS MARKET, BY VEHICLE TYPE, 2021-2031 ($MILLION)
TABLE 88. REST OF ASIA-PACIFIC ALLOY WHEELS MARKET, BY MATERIAL TYPE, 2021-2031 ($MILLION)
TABLE 89. REST OF ASIA-PACIFIC ALLOY WHEELS MARKET, BY TYPE, 2021-2031 ($MILLION)
TABLE 90. REST OF ASIA-PACIFIC ALLOY WHEELS MARKET, BY RIM SIZE, 2021-2031 ($MILLION)
TABLE 91. REST OF ASIA-PACIFIC ALLOY WHEELS MARKET, BY VEHICLE TYPE, 2021-2031 ($MILLION)
TABLE 92. LAMEA ALLOY WHEELS MARKET, BY MATERIAL TYPE, 2021-2031 ($MILLION)
TABLE 93. LAMEA ALLOY WHEELS MARKET, BY TYPE, 2021-2031 ($MILLION)
TABLE 94. LAMEA ALLOY WHEELS MARKET, BY RIM SIZE, 2021-2031 ($MILLION)
TABLE 95. LAMEA ALLOY WHEELS MARKET, BY VEHICLE TYPE, 2021-2031 ($MILLION)
TABLE 96. LAMEA ALLOY WHEELS MARKET, BY COUNTRY, 2021-2031 ($MILLION)
TABLE 97. BRAZIL ALLOY WHEELS MARKET, BY MATERIAL TYPE, 2021-2031 ($MILLION)
TABLE 98. BRAZIL ALLOY WHEELS MARKET, BY TYPE, 2021-2031 ($MILLION)
TABLE 99. BRAZIL ALLOY WHEELS MARKET, BY RIM SIZE, 2021-2031 ($MILLION)
TABLE 100. BRAZIL ALLOY WHEELS MARKET, BY VEHICLE TYPE, 2021-2031 ($MILLION)
TABLE 101. SAUDI ARABIA ALLOY WHEELS MARKET, BY MATERIAL TYPE, 2021-2031 ($MILLION)
TABLE 102. SAUDI ARABIA ALLOY WHEELS MARKET, BY TYPE, 2021-2031 ($MILLION)
TABLE 103. SAUDI ARABIA ALLOY WHEELS MARKET, BY RIM SIZE, 2021-2031 ($MILLION)
TABLE 104. SAUDI ARABIA ALLOY WHEELS MARKET, BY VEHICLE TYPE, 2021-2031 ($MILLION)
TABLE 105. UNITED ARAB EMIRATES ALLOY WHEELS MARKET, BY MATERIAL TYPE, 2021-2031 ($MILLION)
TABLE 106. UNITED ARAB EMIRATES ALLOY WHEELS MARKET, BY TYPE, 2021-2031 ($MILLION)
TABLE 107. UNITED ARAB EMIRATES ALLOY WHEELS MARKET, BY RIM SIZE, 2021-2031 ($MILLION)
TABLE 108. UNITED ARAB EMIRATES ALLOY WHEELS MARKET, BY VEHICLE TYPE, 2021-2031 ($MILLION)
TABLE 109. SOUTH AFRICA ALLOY WHEELS MARKET, BY MATERIAL TYPE, 2021-2031 ($MILLION)
TABLE 110. SOUTH AFRICA ALLOY WHEELS MARKET, BY TYPE, 2021-2031 ($MILLION)
TABLE 111. SOUTH AFRICA ALLOY WHEELS MARKET, BY RIM SIZE, 2021-2031 ($MILLION)
TABLE 112. SOUTH AFRICA ALLOY WHEELS MARKET, BY VEHICLE TYPE, 2021-2031 ($MILLION)
TABLE 113. REST OF LAMEA ALLOY WHEELS MARKET, BY MATERIAL TYPE, 2021-2031 ($MILLION)
TABLE 114. REST OF LAMEA ALLOY WHEELS MARKET, BY TYPE, 2021-2031 ($MILLION)
TABLE 115. REST OF LAMEA ALLOY WHEELS MARKET, BY RIM SIZE, 2021-2031 ($MILLION)
TABLE 116. REST OF LAMEA ALLOY WHEELS MARKET, BY VEHICLE TYPE, 2021-2031 ($MILLION)
TABLE 117. MAXION WHEELS: KEY EXECUTIVES
TABLE 118. MAXION WHEELS: COMPANY SNAPSHOT
TABLE 119. BORBET GMBH: KEY EXECUTIVES
TABLE 120. BORBET GMBH: COMPANY SNAPSHOT
TABLE 121. ENKEI CORPORATION: KEY EXECUTIVES
TABLE 122. ENKEI CORPORATION: COMPANY SNAPSHOT
TABLE 123. MHT LUXURY WHEELS: KEY EXECUTIVES
TABLE 124. MHT LUXURY WHEELS: COMPANY SNAPSHOT
TABLE 125. RONAL GROUP: KEY EXECUTIVES
TABLE 126. RONAL GROUP: COMPANY SNAPSHOT
TABLE 127. STAMFORD SPORT WHEELS: KEY EXECUTIVES
TABLE 128. STAMFORD SPORT WHEELS: COMPANY SNAPSHOT
TABLE 129. SUPERIOR INDUSTRIES INTERNATIONAL, INC.: KEY EXECUTIVES
TABLE 130. SUPERIOR INDUSTRIES INTERNATIONAL, INC.: COMPANY SNAPSHOT
TABLE 131. TSW ALLOY WHEELS: KEY EXECUTIVES
TABLE 132. TSW ALLOY WHEELS: COMPANY SNAPSHOT
TABLE 133. FUEL OFF-ROAD WHEELS: KEY EXECUTIVES
TABLE 134. FUEL OFF-ROAD WHEELS: COMPANY SNAPSHOT
TABLE 135. CITIC DICASTAL WHEEL MANUFACTURING CO: KEY EXECUTIVES
TABLE 136. CITIC DICASTAL WHEEL MANUFACTURING CO: COMPANY SNAPSHOT
TABLE 137. STEEL STRIPS WHEELS LTD (SSWL): KEY EXECUTIVES
TABLE 138. STEEL STRIPS WHEELS LTD (SSWL): COMPANY SNAPSHOT
List of Figures
FIGURE 01. ALLOY WHEELS MARKET, 2021-2031
FIGURE 02. SEGMENTATION OF ALLOY WHEELS MARKET, 2021-2031
FIGURE 03. TOP INVESTMENT POCKETS IN ALLOY WHEELS MARKET (2022-2031)
FIGURE 04. PORTER FIVE-1
FIGURE 05. PORTER FIVE-2
FIGURE 06. PORTER FIVE-3
FIGURE 07. PORTER FIVE-4
FIGURE 08. PORTER FIVE-5
FIGURE 09. DRIVERS, RESTRAINTS AND OPPORTUNITIES: GLOBALALLOY WHEELS MARKET
FIGURE 10. IMPACT OF KEY REGULATION: ALLOY WHEELS MARKET
FIGURE 11. MARKET SHARE ANALYSIS: ALLOY WHEELS MARKET
FIGURE 12. PATENT ANALYSIS BY COMPANY
FIGURE 13. PATENT ANALYSIS BY COUNTRY
FIGURE 14. REGULATORY GUIDELINES: ALLOY WHEELS MARKET
FIGURE 15. VALUE CHAIN ANALYSIS: ALLOY WHEELS MARKET
FIGURE 16. ALLOY WHEELS MARKET, BY MATERIAL TYPE, 2021(%)
FIGURE 17. COMPARATIVE SHARE ANALYSIS OF ALLOY WHEELS MARKET FOR ALUMINUM ALLOY, BY COUNTRY 2021-2031(%)
FIGURE 18. COMPARATIVE SHARE ANALYSIS OF ALLOY WHEELS MARKET FOR TITANIUM ALLOY, BY COUNTRY 2021-2031(%)
FIGURE 19. COMPARATIVE SHARE ANALYSIS OF ALLOY WHEELS MARKET FOR MAGNESIUM ALLOY, BY COUNTRY 2021-2031(%)
FIGURE 20. ALLOY WHEELS MARKET, BY TYPE, 2021(%)
FIGURE 21. COMPARATIVE SHARE ANALYSIS OF ALLOY WHEELS MARKET FOR FORGING, BY COUNTRY 2021-2031(%)
FIGURE 22. COMPARATIVE SHARE ANALYSIS OF ALLOY WHEELS MARKET FOR CASTING, BY COUNTRY 2021-2031(%)
FIGURE 23. COMPARATIVE SHARE ANALYSIS OF ALLOY WHEELS MARKET FOR OTHERS, BY COUNTRY 2021-2031(%)
FIGURE 24. ALLOY WHEELS MARKET, BY RIM SIZE, 2021(%)
FIGURE 25. COMPARATIVE SHARE ANALYSIS OF ALLOY WHEELS MARKET FOR 12 INCHES - 17 INCHES, BY COUNTRY 2021-2031(%)
FIGURE 26. COMPARATIVE SHARE ANALYSIS OF ALLOY WHEELS MARKET FOR 18 INCHES - 21 INCHES, BY COUNTRY 2021-2031(%)
FIGURE 27. COMPARATIVE SHARE ANALYSIS OF ALLOY WHEELS MARKET FOR MORE THAN 22 INCHES, BY COUNTRY 2021-2031(%)
FIGURE 28. ALLOY WHEELS MARKET, BY VEHICLE TYPE, 2021(%)
FIGURE 29. COMPARATIVE SHARE ANALYSIS OF ALLOY WHEELS MARKET FOR PASSENGER VEHICLE, BY COUNTRY 2021-2031(%)
FIGURE 30. COMPARATIVE SHARE ANALYSIS OF ALLOY WHEELS MARKET FOR COMMERCIAL VEHICLE, BY COUNTRY 2021-2031(%)
FIGURE 31. ALLOY WHEELS MARKET BY REGION, 2021
FIGURE 32. U.S. ALLOY WHEELS MARKET, 2021-2031 ($MILLION)
FIGURE 33. CANADA ALLOY WHEELS MARKET, 2021-2031 ($MILLION)
FIGURE 34. MEXICO ALLOY WHEELS MARKET, 2021-2031 ($MILLION)
FIGURE 35. GERMANY ALLOY WHEELS MARKET, 2021-2031 ($MILLION)
FIGURE 36. UK ALLOY WHEELS MARKET, 2021-2031 ($MILLION)
FIGURE 37. FRANCE ALLOY WHEELS MARKET, 2021-2031 ($MILLION)
FIGURE 38. SPAIN ALLOY WHEELS MARKET, 2021-2031 ($MILLION)
FIGURE 39. ITALY ALLOY WHEELS MARKET, 2021-2031 ($MILLION)
FIGURE 40. REST OF EUROPE ALLOY WHEELS MARKET, 2021-2031 ($MILLION)
FIGURE 41. CHINA ALLOY WHEELS MARKET, 2021-2031 ($MILLION)
FIGURE 42. JAPAN ALLOY WHEELS MARKET, 2021-2031 ($MILLION)
FIGURE 43. INDIA ALLOY WHEELS MARKET, 2021-2031 ($MILLION)
FIGURE 44. SOUTH KOREA ALLOY WHEELS MARKET, 2021-2031 ($MILLION)
FIGURE 45. AUSTRALIA ALLOY WHEELS MARKET, 2021-2031 ($MILLION)
FIGURE 46. REST OF ASIA-PACIFIC ALLOY WHEELS MARKET, 2021-2031 ($MILLION)
FIGURE 47. BRAZIL ALLOY WHEELS MARKET, 2021-2031 ($MILLION)
FIGURE 48. SAUDI ARABIA ALLOY WHEELS MARKET, 2021-2031 ($MILLION)
FIGURE 49. UNITED ARAB EMIRATES ALLOY WHEELS MARKET, 2021-2031 ($MILLION)
FIGURE 50. SOUTH AFRICA ALLOY WHEELS MARKET, 2021-2031 ($MILLION)
FIGURE 51. REST OF LAMEA ALLOY WHEELS MARKET, 2021-2031 ($MILLION)
FIGURE 52. TOP WINNING STRATEGIES, BY YEAR
FIGURE 53. TOP WINNING STRATEGIES, BY DEVELOPMENT
FIGURE 54. TOP WINNING STRATEGIES, BY COMPANY
FIGURE 55. PRODUCT MAPPING OF TOP 10 PLAYERS
FIGURE 56. COMPETITIVE DASHBOARD
FIGURE 57. COMPETITIVE HEATMAP: ALLOY WHEELS MARKET
FIGURE 58. TOP PLAYER POSITIONING, 2021
$5730
HAVE A QUERY?
OUR CUSTOMER
