List of Tables
Table 1. Global Foundry Sand Market Size Growth Rate by Mesh Number, 2020 VS 2024 VS 2031 (US$ Million)
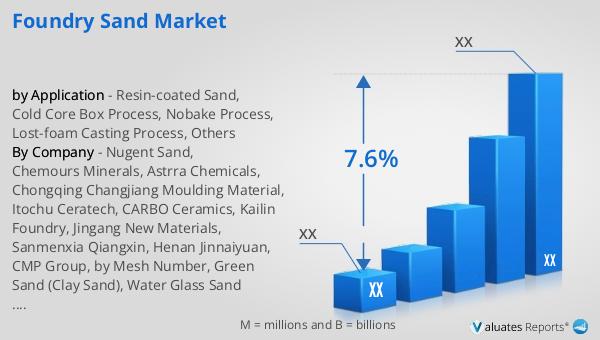
Table 2. Global Foundry Sand Market Size Growth Rate by Application, 2020 VS 2024 VS 2031 (US$ Million)
Table 3. Global Foundry Sand Revenue Grow Rate (CAGR) by Region: 2020 VS 2024 VS 2031 (US$ Million)
Table 4. Global Foundry Sand Revenue by Region (2020-2025) & (US$ Million)
Table 5. Global Foundry Sand Revenue by Region (2026-2031) & (US$ Million)
Table 6. Global Foundry Sand Sales Grow Rate (CAGR) by Region: 2020 VS 2024 VS 2031 (Tons)
Table 7. Global Foundry Sand Sales by Region (2020-2025) & (Tons)
Table 8. Global Foundry Sand Sales by Region (2026-2031) & (Tons)
Table 9. Emerging Market Revenue Grow Rate (CAGR) by Country (2020 VS 2024 VS 2031) (US$ Million)
Table 10. Global Foundry Sand Production Growth Rate (CAGR) by Region: 2020 VS 2024 VS 2031 (Tons)
Table 11. Global Foundry Sand Production by Region (2020-2025) & (Tons)
Table 12. Global Foundry Sand Production by Region (2026-2031) & (Tons)
Table 13. Global Foundry Sand Sales by Manufacturers (2020-2025) & (Tons)
Table 14. Global Foundry Sand Sales Share by Manufacturers (2020-2025)
Table 15. Global Foundry Sand Revenue by Manufacturers (2020-2025) & (US$ Million)
Table 16. Global Foundry Sand Revenue Market Share by Manufacturers (2020-2025)
Table 17. Global Key Manufacturers’Ranking Shift (2023 vs. 2024) (Based on Revenue)
Table 18. Global Foundry Sand by Manufacturer Tier (Tier 1, Tier 2, and Tier 3) & (based on the Revenue in Foundry Sand as of 2024)
Table 19. Global Foundry Sand Average Gross Margin (%) by Manufacturer (2020 VS 2024)
Table 20. Global Foundry Sand Average Selling Price (ASP) by Manufacturers (2020-2025) & (US$/Ton)
Table 21. Key Manufacturers Foundry Sand Manufacturing Base and Headquarters
Table 22. Global Foundry Sand Market Concentration Ratio (CR5 and HHI)
Table 23. Key Market Entrant/Exit (2020-2024) – Drivers & Impact Analysis
Table 24. Key Mergers & Acquisitions, Expansion Plans, R&D Investment
Table 25. Global Foundry Sand Sales by Mesh Number (2020-2025) & (Tons)
Table 26. Global Foundry Sand Sales by Mesh Number (2026-2031) & (Tons)
Table 27. Global Foundry Sand Revenue by Mesh Number (2020-2025) & (US$ Million)
Table 28. Global Foundry Sand Revenue by Mesh Number (2026-2031) & (US$ Million)
Table 29. Global Foundry Sand ASP by Mesh Number (2020-2031) & (US$/Ton)
Table 30. Technical Specifications by Key Product Type
Table 31. Global Foundry Sand Sales by Application (2020-2025) & (Tons)
Table 32. Global Foundry Sand Sales by Application (2026-2031) & (Tons)
Table 33. Foundry Sand High-Growth Sectors Demand CAGR (2024-2031)
Table 34. Global Foundry Sand Revenue by Application (2020-2025) & (US$ Million)
Table 35. Global Foundry Sand Revenue by Application (2026-2031) & (US$ Million)
Table 36. Global Foundry Sand ASP by Application (2020-2031) & (US$/Ton)
Table 37. Top Customers by Region
Table 38. Top Customers by Application
Table 39. North America Foundry Sand Growth Accelerators and Market Barriers
Table 40. North America Foundry Sand Revenue Grow Rate (CAGR) by Country (2020 VS 2024 VS 2031) (US$ Million)
Table 41. North America Foundry Sand Sales (Tons) by Country (2020 VS 2024 VS 2031)
Table 42. Europe Foundry Sand Growth Accelerators and Market Barriers
Table 43. Europe Foundry Sand Revenue Grow Rate (CAGR) by Country: 2020 VS 2024 VS 2031 (US$ Million)
Table 44. Europe Foundry Sand Sales (Tons) by Country (2020 VS 2024 VS 2031)
Table 45. Asia-Pacific Foundry Sand Revenue Grow Rate (CAGR) by Region: 2020 VS 2024 VS 2031 (US$ Million)
Table 46. Asia-Pacific Foundry Sand Sales (Tons) by Country (2020 VS 2024 VS 2031)
Table 47. Asia-Pacific Foundry Sand Growth Accelerators and Market Barriers
Table 48. Southeast Asia Foundry Sand Revenue Grow Rate (CAGR) by Region: 2020 VS 2024 VS 2031 (US$ Million)
Table 49. Central and South America Foundry Sand Investment Opportunities and Key Challenges
Table 50. Central and South America Foundry Sand Revenue Grow Rate (CAGR) by Country (2020 VS 2024 VS 2031) (US$ Million)
Table 51. Middle East and Africa Foundry Sand Investment Opportunities and Key Challenges
Table 52. Middle East and Africa Foundry Sand Revenue Grow Rate (CAGR) by Country (2020 VS 2024 VS 2031) (US$ Million)
Table 53. Nugent Sand Corporation Information
Table 54. Nugent Sand Description and Major Businesses
Table 55. Nugent Sand Product Models, Descriptions and Specifications
Table 56. Nugent Sand Capacity, Sales (Tons), Revenue (US$ Million), Price (US$/Ton) and Gross Margin (2020-2025)
Table 57. Nugent Sand Sales Value Proportion by Product in 2024
Table 58. Nugent Sand Sales Value Proportion by Application in 2024
Table 59. Nugent Sand Sales Value Proportion by Geographic Area in 2024
Table 60. Nugent Sand Foundry Sand SWOT Analysis
Table 61. Nugent Sand Recent Developments
Table 62. Chemours Minerals Corporation Information
Table 63. Chemours Minerals Description and Major Businesses
Table 64. Chemours Minerals Product Models, Descriptions and Specifications
Table 65. Chemours Minerals Capacity, Sales (Tons), Revenue (US$ Million), Price (US$/Ton) and Gross Margin (2020-2025)
Table 66. Chemours Minerals Sales Value Proportion by Product in 2024
Table 67. Chemours Minerals Sales Value Proportion by Application in 2024
Table 68. Chemours Minerals Sales Value Proportion by Geographic Area in 2024
Table 69. Chemours Minerals Foundry Sand SWOT Analysis
Table 70. Chemours Minerals Recent Developments
Table 71. Astrra Chemicals Corporation Information
Table 72. Astrra Chemicals Description and Major Businesses
Table 73. Astrra Chemicals Product Models, Descriptions and Specifications
Table 74. Astrra Chemicals Capacity, Sales (Tons), Revenue (US$ Million), Price (US$/Ton) and Gross Margin (2020-2025)
Table 75. Astrra Chemicals Sales Value Proportion by Product in 2024
Table 76. Astrra Chemicals Sales Value Proportion by Application in 2024
Table 77. Astrra Chemicals Sales Value Proportion by Geographic Area in 2024
Table 78. Astrra Chemicals Foundry Sand SWOT Analysis
Table 79. Astrra Chemicals Recent Developments
Table 80. Chongqing Changjiang Moulding Material Corporation Information
Table 81. Chongqing Changjiang Moulding Material Description and Major Businesses
Table 82. Chongqing Changjiang Moulding Material Product Models, Descriptions and Specifications
Table 83. Chongqing Changjiang Moulding Material Capacity, Sales (Tons), Revenue (US$ Million), Price (US$/Ton) and Gross Margin (2020-2025)
Table 84. Chongqing Changjiang Moulding Material Sales Value Proportion by Product in 2024
Table 85. Chongqing Changjiang Moulding Material Sales Value Proportion by Application in 2024
Table 86. Chongqing Changjiang Moulding Material Sales Value Proportion by Geographic Area in 2024
Table 87. Chongqing Changjiang Moulding Material Foundry Sand SWOT Analysis
Table 88. Chongqing Changjiang Moulding Material Recent Developments
Table 89. Itochu Ceratech Corporation Information
Table 90. Itochu Ceratech Description and Major Businesses
Table 91. Itochu Ceratech Product Models, Descriptions and Specifications
Table 92. Itochu Ceratech Capacity, Sales (Tons), Revenue (US$ Million), Price (US$/Ton) and Gross Margin (2020-2025)
Table 93. Itochu Ceratech Sales Value Proportion by Product in 2024
Table 94. Itochu Ceratech Sales Value Proportion by Application in 2024
Table 95. Itochu Ceratech Sales Value Proportion by Geographic Area in 2024
Table 96. Itochu Ceratech Foundry Sand SWOT Analysis
Table 97. Itochu Ceratech Recent Developments
Table 98. CARBO Ceramics Corporation Information
Table 99. CARBO Ceramics Description and Major Businesses
Table 100. CARBO Ceramics Product Models, Descriptions and Specifications
Table 101. CARBO Ceramics Capacity, Sales (Tons), Revenue (US$ Million), Price (US$/Ton) and Gross Margin (2020-2025)
Table 102. CARBO Ceramics Recent Developments
Table 103. Itochu Ceratech Corporation Information
Table 104. Itochu Ceratech Description and Major Businesses
Table 105. Itochu Ceratech Product Models, Descriptions and Specifications
Table 106. Itochu Ceratech Capacity, Sales (Tons), Revenue (US$ Million), Price (US$/Ton) and Gross Margin (2020-2025)
Table 107. Itochu Ceratech Recent Developments
Table 108. Kailin Foundry Corporation Information
Table 109. Kailin Foundry Description and Major Businesses
Table 110. Kailin Foundry Product Models, Descriptions and Specifications
Table 111. Kailin Foundry Capacity, Sales (Tons), Revenue (US$ Million), Price (US$/Ton) and Gross Margin (2020-2025)
Table 112. Kailin Foundry Recent Developments
Table 113. Jingang New Materials Corporation Information
Table 114. Jingang New Materials Description and Major Businesses
Table 115. Jingang New Materials Product Models, Descriptions and Specifications
Table 116. Jingang New Materials Capacity, Sales (Tons), Revenue (US$ Million), Price (US$/Ton) and Gross Margin (2020-2025)
Table 117. Jingang New Materials Recent Developments
Table 118. Sanmenxia Qiangxin Corporation Information
Table 119. Sanmenxia Qiangxin Description and Major Businesses
Table 120. Sanmenxia Qiangxin Product Models, Descriptions and Specifications
Table 121. Sanmenxia Qiangxin Capacity, Sales (Tons), Revenue (US$ Million), Price (US$/Ton) and Gross Margin (2020-2025)
Table 122. Sanmenxia Qiangxin Recent Developments
Table 123. Henan Jinnaiyuan Corporation Information
Table 124. Henan Jinnaiyuan Description and Major Businesses
Table 125. Henan Jinnaiyuan Product Models, Descriptions and Specifications
Table 126. Henan Jinnaiyuan Capacity, Sales (Tons), Revenue (US$ Million), Price (US$/Ton) and Gross Margin (2020-2025)
Table 127. Henan Jinnaiyuan Recent Developments
Table 128. CMP Group Corporation Information
Table 129. CMP Group Description and Major Businesses
Table 130. CMP Group Product Models, Descriptions and Specifications
Table 131. CMP Group Capacity, Sales (Tons), Revenue (US$ Million), Price (US$/Ton) and Gross Margin (2020-2025)
Table 132. CMP Group Recent Developments
Table 133. Key Raw Materials Distribution
Table 134. Raw Materials Key Suppliers
Table 135. Critical Raw Material Supplier Concentration (2024) & Risk Index
Table 136. Milestones in Production Technology Evolution
Table 137. Distributors List
Table 138. Market Trends and Market Evolution
Table 139. Market Drivers and Opportunities
Table 140. Market Challenges, Risks, and Restraints
Table 141. Research Programs/Design for This Report
Table 142. Key Data Information from Secondary Sources
Table 143. Key Data Information from Primary Sources
List of Figures
Figure 1. Foundry Sand Product Picture
Figure 2. Global Foundry Sand Market Size Growth Rate by Mesh Number, 2020 VS 2024 VS 2031 (US$ Million)
Figure 3. Green Sand (Clay Sand) Product Picture
Figure 4. Water Glass Sand (Sodium Silicate Sand) Product Picture
Figure 5. Resin Sand (Phenolic, Furan) Product Picture
Figure 6. Global Foundry Sand Market Size Growth Rate by Application, 2020 VS 2024 VS 2031 (US$ Million)
Figure 7. Resin-coated Sand
Figure 8. Cold Core Box Process
Figure 9. Nobake Process
Figure 10. Lost-foam Casting Process
Figure 11. Others
Figure 12. Foundry Sand Report Years Considered
Figure 13. Global Foundry Sand Revenue, (US$ Million), 2020 VS 2024 VS 2031
Figure 14. Global Foundry Sand Revenue (2020-2031) & (US$ Million)
Figure 15. Global Foundry Sand Revenue (CAGR) by Region: 2020 VS 2024 VS 2031 (US$ Million)
Figure 16. Global Foundry Sand Revenue Market Share by Region (2020-2031)
Figure 17. Global Foundry Sand Sales (2020-2031) & (Tons)
Figure 18. Global Foundry Sand Sales (CAGR) by Region (2020-2031) (Tons)
Figure 19. Global Foundry Sand Sales Market Share by Region (2020-2031)
Figure 20. Global Foundry Sand Capacity, Production and Utilization (2020-2031) & (Tons)
Figure 21. Global Foundry Sand Production Trend by Region (2020-2031) (Tons)
Figure 22. Global Foundry Sand Production Market Share by Region (2020-2031)
Figure 23. Production Capacity Enablers & Constraints
Figure 24. Foundry Sand Production Growth Rate in North America (2020-2031) & (Tons)
Figure 25. Foundry Sand Production Growth Rate in China (2020-2031) & (Tons)
Figure 26. Foundry Sand Production Growth Rate in Japan (2020-2031) & (Tons)
Figure 27. Top 5 and Top 10 Manufacturers Foundry Sand Sales Volume Market Share in 2024
Figure 28. Global Foundry Sand Revenue Market Share Ranking (2024)
Figure 29. Tier Distribution by Revenue Contribution (2020 VS 2024)
Figure 30. Green Sand (Clay Sand) Revenue Market Share by Manufacturer in 2024
Figure 31. Water Glass Sand (Sodium Silicate Sand) Revenue Market Share by Manufacturer in 2024
Figure 32. Resin Sand (Phenolic, Furan) Revenue Market Share by Manufacturer in 2024
Figure 33. Type Eight Revenue Market Share by Manufacturer in 2024
Figure 34. Type Nine Revenue Market Share by Manufacturer in 2024
Figure 35. Global Foundry Sand Sales Market Share by Mesh Number (2020-2031)
Figure 36. Global Foundry Sand Revenue Market Share by Mesh Number (2020-2031)
Figure 37. Global Foundry Sand Sales Market Share by Application (2020-2031)
Figure 38. Global Foundry Sand Revenue Market Share by Application (2020-2031)
Figure 39. North America Foundry Sand Sales YoY (2020-2031) & (Tons)
Figure 40. North America Foundry Sand Revenue YoY (2020-2031) & (US$ Million)
Figure 41. North America Top 5 Manufacturers Foundry Sand Sales Revenue (US$ Million) in 2024
Figure 42. North America Foundry Sand Sales Volume (Tons) by Mesh Number (2020- 2031)
Figure 43. North America Foundry Sand Sales Revenue (US$ Million) by Mesh Number (2020 - 2031)
Figure 44. North America Foundry Sand Sales Volume (Tons) by Application (2020-2031)
Figure 45. North America Foundry Sand Sales Revenue (US$ Million) by Application (2020-2031)
Figure 46. US Foundry Sand Revenue (2020-2031) & (US$ Million)
Figure 47. Canada Foundry Sand Revenue (2020-2031) & (US$ Million)
Figure 48. Mexico Foundry Sand Revenue (2020-2031) & (US$ Million)
Figure 49. Europe Foundry Sand Sales YoY (2020-2031) & (Tons)
Figure 50. Europe Foundry Sand Revenue YoY (2020-2031) & (US$ Million)
Figure 51. Europe Top 5 Manufacturers Foundry Sand Sales Revenue (US$ Million) in 2024
Figure 52. Europe Foundry Sand Sales Volume (Tons) by Mesh Number (2020-2031)
Figure 53. Europe Foundry Sand Sales Revenue (US$ Million) by Mesh Number (2020-2031)
Figure 54. Europe Foundry Sand Sales Volume (Tons) by Application (2020-2031)
Figure 55. Europe Foundry Sand Sales Revenue (US$ Million) by Application (2020-2031)
Figure 56. Germany Foundry Sand Revenue (2020-2031) & (US$ Million)
Figure 57. France Foundry Sand Revenue (2020-2031) & (US$ Million)
Figure 58. U.K. Foundry Sand Revenue (2020-2031) & (US$ Million)
Figure 59. Italy Foundry Sand Revenue (2020-2031) & (US$ Million)
Figure 60. Russia Foundry Sand Revenue (2020-2031) & (US$ Million)
Figure 61. Asia-Pacific Foundry Sand Sales YoY (2020-2031) & (Tons)
Figure 62. Asia-Pacific Foundry Sand Revenue YoY (2020-2031) & (US$ Million)
Figure 63. Asia-Pacific Top 8 Manufacturers Foundry Sand Sales Revenue (US$ Million) in 2024
Figure 64. Asia-Pacific Foundry Sand Sales Volume (Tons) by Mesh Number (2020- 2031)
Figure 65. Asia-Pacific Foundry Sand Sales Revenue (US$ Million) by Mesh Number (2020- 2031)
Figure 66. Asia-Pacific Foundry Sand Sales Volume (Tons) by Application (2020-2031)
Figure 67. Asia-Pacific Foundry Sand Sales Revenue (US$ Million) by Application (2020-2031)
Figure 68. Indonesia Foundry Sand Revenue (2020-2031) & (US$ Million)
Figure 69. Japan Foundry Sand Revenue (2020-2031) & (US$ Million)
Figure 70. South Korea Foundry Sand Revenue (2020-2031) & (US$ Million)
Figure 71. China Taiwan Foundry Sand Revenue (2020-2031) & (US$ Million)
Figure 72. India Foundry Sand Revenue (2020-2031) & (US$ Million)
Figure 73. Central and South America Foundry Sand Sales YoY (2020-2031) & (Tons)
Figure 74. Central and South America Foundry Sand Revenue YoY (2020-2031) & (US$ Million)
Figure 75. Central and South America Top 5 Manufacturers Foundry Sand Sales Revenue (US$ Million) in 2024
Figure 76. Central and South America Foundry Sand Sales Volume (Tons) by Mesh Number (2021-2031)
Figure 77. Central and South America Foundry Sand Sales Revenue (US$ Million) by Mesh Number (2020-2031)
Figure 78. Central and South America Foundry Sand Sales Volume (Tons) by Application (2020-2031)
Figure 79. Central and South America Foundry Sand Sales Revenue (US$ Million) by Application (2020-2031)
Figure 80. Brazil Foundry Sand Revenue (2020-2025) & (US$ Million)
Figure 81. Argentina Foundry Sand Revenue (2020-2025) & (US$ Million)
Figure 82. Middle East, and Africa Foundry Sand Sales YoY (2020-2031) & (Tons)
Figure 83. Middle East and Africa Foundry Sand Revenue YoY (2020-2031) & (US$ Million)
Figure 84. Middle East and Africa Top 5 Manufacturers Foundry Sand Sales Revenue (US$ Million) in 2024
Figure 85. Middle East and Africa Foundry Sand Sales Volume (Tons) by Mesh Number (2021-2031)
Figure 86. South America Foundry Sand Sales Revenue (US$ Million) by Mesh Number (2020-2031)
Figure 87. Middle East and Africa Foundry Sand Sales Volume (Tons) by Application (2020-2031)
Figure 88. Middle East and Africa Foundry Sand Sales Revenue (US$ Million) by Application (2020-2031)
Figure 89. GCC Countries Foundry Sand Revenue (2020-2025) & (US$ Million)
Figure 90. Turkey Foundry Sand Revenue (2020-2025) & (US$ Million)
Figure 91. Egypt Foundry Sand Revenue (2020-2025) & (US$ Million)
Figure 92. South Africa Foundry Sand Revenue (2020-2025) & (US$ Million)
Figure 93. Foundry Sand Industry Chain Mapping
Figure 94. Regional Foundry Sand Manufacturing Base Distribution (%)
Figure 95. Foundry Sand Production Process
Figure 96. Regional Foundry Sand Production Cost Structure
Figure 97. Channels of Distribution (Direct Vs Distribution)
Figure 98. Bottom-up and Top-down Approaches for This Report
Figure 99. Data Triangulation
Figure 100. Key Executives Interviewed