List of Tables
Table 1. Global Latent Tuberculosis Infection (LTBI) Testing Market Size Growth Rate by Type (US$ Million): 2021 vs 2025 vs 2032
Table 2. Key Players of Tuberculin Skin Test (TST)
Table 3. Key Players of Interferon Gamma Released Assay (IGRA)
Table 4. Global Latent Tuberculosis Infection (LTBI) Testing Market Size Growth by Application (US$ Million): 2021 vs 2025 vs 2032
Table 5. Global Latent Tuberculosis Infection (LTBI) Testing Market Size by Region (US$ Million): 2021 vs 2025 vs 2032
Table 6. Global Latent Tuberculosis Infection (LTBI) Testing Market Size by Region (US$ Million), 2021–2026
Table 7. Global Latent Tuberculosis Infection (LTBI) Testing Market Share by Region (2021–2026)
Table 8. Global Latent Tuberculosis Infection (LTBI) Testing Forecasted Market Size by Region (US$ Million), 2027–2032
Table 9. Global Latent Tuberculosis Infection (LTBI) Testing Market Share by Region (2027–2032)
Table 10. Latent Tuberculosis Infection (LTBI) Testing Market Trends
Table 11. Latent Tuberculosis Infection (LTBI) Testing Market Drivers
Table 12. Latent Tuberculosis Infection (LTBI) Testing Market Challenges
Table 13. Latent Tuberculosis Infection (LTBI) Testing Market Restraints
Table 14. Global Latent Tuberculosis Infection (LTBI) Testing Revenue by Players (US$ Million), 2021–2026
Table 15. Global Latent Tuberculosis Infection (LTBI) Testing Market Share by Players (2021–2026)
Table 16. Global Top Latent Tuberculosis Infection (LTBI) Testing Players by Tier (Tier 1, Tier 2, and Tier 3), based on Latent Tuberculosis Infection (LTBI) Testing Revenue, 2025
Table 17. Ranking of Global Top Latent Tuberculosis Infection (LTBI) Testing Companies by Revenue (US$ Million) in 2025
Table 18. Global 5 Largest Players Market Share by Latent Tuberculosis Infection (LTBI) Testing Revenue (CR5 and HHI), 2021–2026
Table 19. Global Key Players of Latent Tuberculosis Infection (LTBI) Testing, Headquarters and Area Served
Table 20. Global Key Players of Latent Tuberculosis Infection (LTBI) Testing, Products and Applications
Table 21. Global Key Players of Latent Tuberculosis Infection (LTBI) Testing, Date of General Availability (GA)
Table 22. Mergers and Acquisitions, Expansion Plans
Table 23. Global Latent Tuberculosis Infection (LTBI) Testing Market Size by Type (US$ Million), 2021–2026
Table 24. Global Latent Tuberculosis Infection (LTBI) Testing Revenue Market Share by Type (2021–2026)
Table 25. Global Latent Tuberculosis Infection (LTBI) Testing Forecasted Market Size by Type (US$ Million), 2027–2032
Table 26. Global Latent Tuberculosis Infection (LTBI) Testing Revenue Market Share by Type (2027–2032)
Table 27. Global Latent Tuberculosis Infection (LTBI) Testing Market Size by Application (US$ Million), 2021–2026
Table 28. Global Latent Tuberculosis Infection (LTBI) Testing Revenue Market Share by Application (2021–2026)
Table 29. Global Latent Tuberculosis Infection (LTBI) Testing Forecasted Market Size by Application (US$ Million), 2027–2032
Table 30. Global Latent Tuberculosis Infection (LTBI) Testing Revenue Market Share by Application (2027–2032)
Table 31. North America Latent Tuberculosis Infection (LTBI) Testing Market Size Growth Rate by Country (US$ Million): 2021 vs 2025 vs 2032
Table 32. North America Latent Tuberculosis Infection (LTBI) Testing Market Size by Country (US$ Million), 2021–2026
Table 33. North America Latent Tuberculosis Infection (LTBI) Testing Market Size by Country (US$ Million), 2027–2032
Table 34. Europe Latent Tuberculosis Infection (LTBI) Testing Market Size Growth Rate by Country (US$ Million): 2021 vs 2025 vs 2032
Table 35. Europe Latent Tuberculosis Infection (LTBI) Testing Market Size by Country (US$ Million), 2021–2026
Table 36. Europe Latent Tuberculosis Infection (LTBI) Testing Market Size by Country (US$ Million), 2027–2032
Table 37. Asia-Pacific Latent Tuberculosis Infection (LTBI) Testing Market Size Growth Rate by Region (US$ Million): 2021 vs 2025 vs 2032
Table 38. Asia-Pacific Latent Tuberculosis Infection (LTBI) Testing Market Size by Region (US$ Million), 2021–2026
Table 39. Asia-Pacific Latent Tuberculosis Infection (LTBI) Testing Market Size by Region (US$ Million), 2027–2032
Table 40. Latin America Latent Tuberculosis Infection (LTBI) Testing Market Size Growth Rate by Country (US$ Million): 2021 vs 2025 vs 2032
Table 41. Latin America Latent Tuberculosis Infection (LTBI) Testing Market Size by Country (US$ Million), 2021–2026
Table 42. Latin America Latent Tuberculosis Infection (LTBI) Testing Market Size by Country (US$ Million), 2027–2032
Table 43. Middle East & Africa Latent Tuberculosis Infection (LTBI) Testing Market Size Growth Rate by Country (US$ Million): 2021 vs 2025 vs 2032
Table 44. Middle East & Africa Latent Tuberculosis Infection (LTBI) Testing Market Size by Country (US$ Million), 2021–2026
Table 45. Middle East & Africa Latent Tuberculosis Infection (LTBI) Testing Market Size by Country (US$ Million), 2027–2032
Table 46. Qiagen Company Details
Table 47. Qiagen Business Overview
Table 48. Qiagen Latent Tuberculosis Infection (LTBI) Testing Product
Table 49. Qiagen Revenue in Latent Tuberculosis Infection (LTBI) Testing Business (US$ Million), 2021–2026
Table 50. Qiagen Recent Development
Table 51. Sanofi Company Details
Table 52. Sanofi Business Overview
Table 53. Sanofi Latent Tuberculosis Infection (LTBI) Testing Product
Table 54. Sanofi Revenue in Latent Tuberculosis Infection (LTBI) Testing Business (US$ Million), 2021–2026
Table 55. Sanofi Recent Development
Table 56. Oxford Immunotec Company Details
Table 57. Oxford Immunotec Business Overview
Table 58. Oxford Immunotec Latent Tuberculosis Infection (LTBI) Testing Product
Table 59. Oxford Immunotec Revenue in Latent Tuberculosis Infection (LTBI) Testing Business (US$ Million), 2021–2026
Table 60. Oxford Immunotec Recent Development
Table 61. Thermo Fisher Scientific Company Details
Table 62. Thermo Fisher Scientific Business Overview
Table 63. Thermo Fisher Scientific Latent Tuberculosis Infection (LTBI) Testing Product
Table 64. Thermo Fisher Scientific Revenue in Latent Tuberculosis Infection (LTBI) Testing Business (US$ Million), 2021–2026
Table 65. Thermo Fisher Scientific Recent Development
Table 66. Par Sterile Company Details
Table 67. Par Sterile Business Overview
Table 68. Par Sterile Latent Tuberculosis Infection (LTBI) Testing Product
Table 69. Par Sterile Revenue in Latent Tuberculosis Infection (LTBI) Testing Business (US$ Million), 2021–2026
Table 70. Par Sterile Recent Development
Table 71. Bio-Rad Laboratories Company Details
Table 72. Bio-Rad Laboratories Business Overview
Table 73. Bio-Rad Laboratories Latent Tuberculosis Infection (LTBI) Testing Product
Table 74. Bio-Rad Laboratories Revenue in Latent Tuberculosis Infection (LTBI) Testing Business (US$ Million), 2021–2026
Table 75. Bio-Rad Laboratories Recent Development
Table 76. Research Programs/Design for This Report
Table 77. Key Data Information from Secondary Sources
Table 78. Key Data Information from Primary Sources
Table 79. Authors List of This Report
List of Figures
Figure 1. Latent Tuberculosis Infection (LTBI) Testing Picture
Figure 2. Global Latent Tuberculosis Infection (LTBI) Testing Market Size Comparison by Type (US$ Million), 2021–2032
Figure 3. Global Latent Tuberculosis Infection (LTBI) Testing Market Share by Type: 2025 vs 2032
Figure 4. Tuberculin Skin Test (TST) Features
Figure 5. Interferon Gamma Released Assay (IGRA) Features
Figure 6. Global Latent Tuberculosis Infection (LTBI) Testing Market Size by Application (US$ Million), 2021–2032
Figure 7. Global Latent Tuberculosis Infection (LTBI) Testing Market Share by Application: 2025 vs 2032
Figure 8. Hospitals and Clinics Case Studies
Figure 9. Diagnostic Laboratories Case Studies
Figure 10. Others Case Studies
Figure 11. Latent Tuberculosis Infection (LTBI) Testing Report Years Considered
Figure 12. Global Latent Tuberculosis Infection (LTBI) Testing Market Size (US$ Million), Year-over-Year: 2021–2032
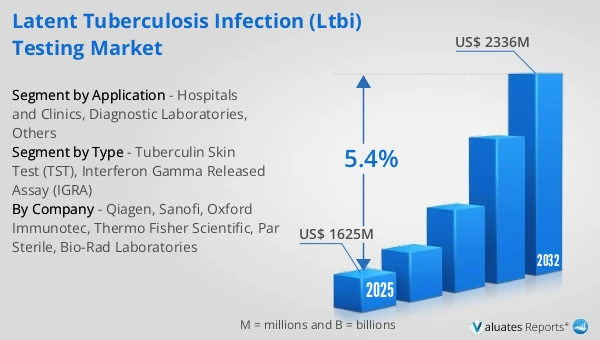
Figure 13. Global Latent Tuberculosis Infection (LTBI) Testing Market Size, (US$ Million), 2021 vs 2025 vs 2032
Figure 14. Global Latent Tuberculosis Infection (LTBI) Testing Market Share by Region: 2025 vs 2032
Figure 15. Global Latent Tuberculosis Infection (LTBI) Testing Market Share by Players in 2025
Figure 16. Global Latent Tuberculosis Infection (LTBI) Testing Market Share by Company Type (Tier 1, Tier 2, and Tier 3)
Figure 17. The Top 10 and 5 Players Market Share by Latent Tuberculosis Infection (LTBI) Testing Revenue in 2025
Figure 18. North America Latent Tuberculosis Infection (LTBI) Testing Market Size YoY Growth (US$ Million), 2021–2032
Figure 19. North America Latent Tuberculosis Infection (LTBI) Testing Market Share by Country (2021–2032)
Figure 20. United States Latent Tuberculosis Infection (LTBI) Testing Market Size YoY Growth (US$ Million), 2021–2032
Figure 21. Canada Latent Tuberculosis Infection (LTBI) Testing Market Size YoY Growth (US$ Million), 2021–2032
Figure 22. Europe Latent Tuberculosis Infection (LTBI) Testing Market Size YoY Growth (US$ Million), 2021–2032
Figure 23. Europe Latent Tuberculosis Infection (LTBI) Testing Market Share by Country (2021–2032)
Figure 24. Germany Latent Tuberculosis Infection (LTBI) Testing Market Size YoY Growth (US$ Million), 2021–2032
Figure 25. France Latent Tuberculosis Infection (LTBI) Testing Market Size YoY Growth (US$ Million), 2021–2032
Figure 26. U.K. Latent Tuberculosis Infection (LTBI) Testing Market Size YoY Growth (US$ Million), 2021–2032
Figure 27. Italy Latent Tuberculosis Infection (LTBI) Testing Market Size YoY Growth (US$ Million), 2021–2032
Figure 28. Russia Latent Tuberculosis Infection (LTBI) Testing Market Size YoY Growth (US$ Million), 2021–2032
Figure 29. Ireland Latent Tuberculosis Infection (LTBI) Testing Market Size YoY Growth (US$ Million), 2021–2032
Figure 30. Asia-Pacific Latent Tuberculosis Infection (LTBI) Testing Market Size YoY Growth (US$ Million), 2021–2032
Figure 31. Asia-Pacific Latent Tuberculosis Infection (LTBI) Testing Market Share by Region (2021–2032)
Figure 32. China Latent Tuberculosis Infection (LTBI) Testing Market Size YoY Growth (US$ Million), 2021–2032
Figure 33. Japan Latent Tuberculosis Infection (LTBI) Testing Market Size YoY Growth (US$ Million), 2021–2032
Figure 34. South Korea Latent Tuberculosis Infection (LTBI) Testing Market Size YoY Growth (US$ Million), 2021–2032
Figure 35. Southeast Asia Latent Tuberculosis Infection (LTBI) Testing Market Size YoY Growth (US$ Million), 2021–2032
Figure 36. India Latent Tuberculosis Infection (LTBI) Testing Market Size YoY Growth (US$ Million), 2021–2032
Figure 37. Australia & New Zealand Latent Tuberculosis Infection (LTBI) Testing Market Size YoY Growth (US$ Million), 2021–2032
Figure 38. Latin America Latent Tuberculosis Infection (LTBI) Testing Market Size YoY Growth (US$ Million), 2021–2032
Figure 39. Latin America Latent Tuberculosis Infection (LTBI) Testing Market Share by Country (2021–2032)
Figure 40. Mexico Latent Tuberculosis Infection (LTBI) Testing Market Size YoY Growth (US$ Million), 2021–2032
Figure 41. Brazil Latent Tuberculosis Infection (LTBI) Testing Market Size YoY Growth (US$ Million), 2021–2032
Figure 42. Middle East & Africa Latent Tuberculosis Infection (LTBI) Testing Market Size YoY Growth (US$ Million), 2021–2032
Figure 43. Middle East & Africa Latent Tuberculosis Infection (LTBI) Testing Market Share by Country (2021–2032)
Figure 44. Israel Latent Tuberculosis Infection (LTBI) Testing Market Size YoY Growth (US$ Million), 2021–2032
Figure 45. Saudi Arabia Latent Tuberculosis Infection (LTBI) Testing Market Size YoY Growth (US$ Million), 2021–2032
Figure 46. UAE Latent Tuberculosis Infection (LTBI) Testing Market Size YoY Growth (US$ Million), 2021–2032
Figure 47. Qiagen Revenue Growth Rate in Latent Tuberculosis Infection (LTBI) Testing Business (2021–2026)
Figure 48. Sanofi Revenue Growth Rate in Latent Tuberculosis Infection (LTBI) Testing Business (2021–2026)
Figure 49. Oxford Immunotec Revenue Growth Rate in Latent Tuberculosis Infection (LTBI) Testing Business (2021–2026)
Figure 50. Thermo Fisher Scientific Revenue Growth Rate in Latent Tuberculosis Infection (LTBI) Testing Business (2021–2026)
Figure 51. Par Sterile Revenue Growth Rate in Latent Tuberculosis Infection (LTBI) Testing Business (2021–2026)
Figure 52. Bio-Rad Laboratories Revenue Growth Rate in Latent Tuberculosis Infection (LTBI) Testing Business (2021–2026)
Figure 53. Bottom-up and Top-down Approaches for This Report
Figure 54. Data Triangulation
Figure 55. Key Executives Interviewed