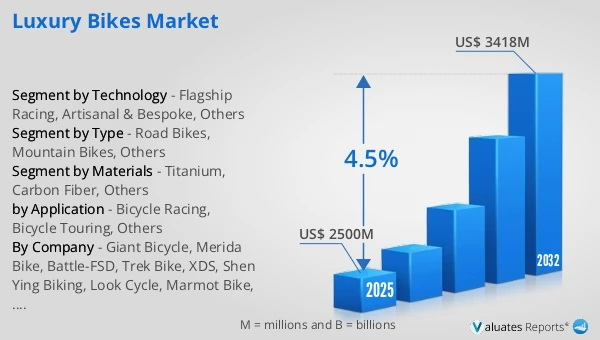
The global Luxury Bikes market was valued at US$ 2500 million in 2025 and is anticipated to reach US$ 3418 million by 2032, at a CAGR of 4.5% from 2026 to 2032.
Luxury Bikes Market
The 2025 U.S. tariff policies introduce profound uncertainty into the global economic landscape. This report critically examines the implications of recent tariff adjustments and international strategic countermeasures on Luxury Bikes competitive dynamics, regional economic interdependencies, and supply chain reconfigurations.
A luxury bike transcends the primary function of transportation, positioning itself as a high-end lifestyle statement characterized by exceptional craftsmanship, cutting-edge technology, and exclusive brand heritage. Unlike standard performance bicycles, luxury bikes often feature frames made from aerospace-grade titanium, ultra-lightweight carbon fiber, or hand-polished precious metals. They are frequently produced in limited editions, sometimes through collaborations between elite cycling manufacturers and luxury automotive or fashion houses (e.g., Ferrari, Colnago, or Hermès). Beyond technical specs like electronic shifting and integrated aerodynamics, the "luxury" status is defined by bespoke customization, white-glove service, and a price point that reflects prestige rather than just utility.In 2025, global luxury bike production reached approximately 500 K units .
Luxury bikes refer to high-end bicycles that significantly exceed mainstream products in terms of materials, manufacturing processes, brand positioning, and pricing. This category includes premium road bikes, mountain bikes, gravel bikes, high-end electric-assisted bikes, and limited-edition or custom-built models. The luxury bike segment is not only part of the broader bicycle industry but also intersects with luxury consumption, professional sports equipment, and lifestyle markets, characterized by strong brand premiums and niche consumer communities.
From a demand perspective, the core consumers of luxury bikes are high-income individuals, professional cycling enthusiasts, competitive athletes, and lifestyle-driven riders who view cycling as a symbol of identity and personal taste. In regions such as Europe, North America, Japan, and emerging markets like China’s tier-one cities and the Middle East, cycling is increasingly regarded as a premium lifestyle activity rather than merely a mode of transportation or exercise. Consumers are shifting their focus from basic performance to attributes such as lightweight design, speed, exclusivity, and brand heritage, driving the adoption of advanced carbon fiber frames, aerodynamic designs, electronic shifting systems, and custom geometries.
From a product and technology standpoint, luxury bikes evolve at a faster pace than mass-market bicycles. High-end models typically feature high-modulus carbon fiber, titanium, or premium aluminum alloy frames that optimize weight, stiffness, and comfort. Electronic drivetrains, hydraulic disc brakes, high-performance wheelsets, and fully integrated cockpit designs have become standard features in the luxury segment. In addition, brands increasingly leverage data analytics, ergonomic modeling, and wind tunnel testing to deliver specialized solutions for climbing, sprinting, or endurance riding.
In terms of market structure, the luxury bike market exhibits a dual pattern of concentration among established global brands and the coexistence of niche boutique manufacturers. Leading brands benefit from long-standing technical expertise, professional race sponsorships, and strong brand heritage, while smaller boutique brands differentiate themselves through handcrafted production, limited volumes, and high levels of customization. These niche players often emphasize craftsmanship, origin stories, and exclusivity to justify premium pricing.
From a pricing and business model perspective, luxury bikes are positioned far above the mass market, with flagship or custom models sometimes priced on par with entry-level automobiles. Beyond complete bike sales, revenue streams increasingly include premium component upgrades, personalized customization services, branded accessories, and exclusive cycling community experiences. This integrated model of “product + service + community” positions luxury bike brands closer to luxury goods companies than traditional durable goods manufacturers.
Looking ahead, the luxury bike market is expected to maintain steady growth. Rising health awareness, environmental consciousness, and demand for premium leisure sports experiences will continue to support market expansion. Meanwhile, the rapid development of luxury e-bikes represents a significant new growth opportunity. Overall, luxury bikes are evolving into high-value lifestyle products that combine advanced technology, refined design, and social identity, offering strong long-term potential for both market growth and brand premium expansion.
This report delivers a comprehensive overview of the global Luxury Bikes market, with both quantitative and qualitative analyses, to help readers develop growth strategies, assess the competitive landscape, evaluate their position in the current market, and make informed business decisions regarding Luxury Bikes. The Luxury Bikes market size, estimates, and forecasts are provided in terms of sales volume (K Units) and revenue (US$ millions), with 2025 as the base year and historical and forecast data for 2021–2032.
The report segments the global Luxury Bikes market comprehensively. Regional market sizes by Type, by Application, by Materials, and by company are also provided. For deeper insight, the report profiles the competitive landscape, key competitors, and their respective market rankings, and discusses technological trends and new product developments.
This report will assist Luxury Bikes manufacturers, new entrants, and companies across the industry value chain with information on revenues, sales volume, and average prices for the overall market and its sub-segments, by company, by Type, by Application, and by region.
Market Segmentation
Scope of Luxury Bikes Market Report
| Report Metric |
Details |
| Report Name |
Luxury Bikes Market |
| Accounted market size in 2025 |
US$ 2500 million |
| Forecasted market size in 2032 |
US$ 3418 million |
| CAGR |
4.5% |
| Base Year |
2025 |
| Forecasted years |
2026 - 2032 |
| Segment by Type |
- Road Bikes
- Mountain Bikes
- Others
|
| Segment by Materials |
- Titanium
- Carbon Fiber
- Others
|
| Segment by Technology |
- Flagship Racing
- Artisanal & Bespoke
- Others
|
| by Application |
- Bicycle Racing
- Bicycle Touring
- Others
|
| Consumption by Region |
- North America (United States, Canada)
- Europe (Germany, France, UK, Italy, Russia)
- Asia-Pacific (China, Japan, South Korea, Taiwan)
- Southeast Asia (India)
- Latin America (Mexico, Brazil)
|
| By Company |
Giant Bicycle, Merida Bike, Battle-FSD, Trek Bike, XDS, Shen Ying Biking, Look Cycle, Marmot Bike, Cube Bike, Colnago, SOLOMO, Kestrel Bicycles, Storck Bicycle, Tyrell Bicycle, De Rosa, DAHON, Pinarello, Canyon, Felt Cycles, Ellsworth Bike |
| Forecast units |
USD million in value |
| Report coverage |
Revenue and volume forecast, company share, competitive landscape, growth factors and trends |
Chapter Outline
- Chapter 1: Defines the scope of the report and presents an executive summary of market segments (by Type, by Application, by Materials, etc.), including the size of each segment and its future growth potential. It offers a high-level view of the current market and its likely evolution in the short, medium, and long term.
- Chapter 2: Provides a detailed analysis of the competitive landscape for Luxury Bikes manufacturers, covering pricing, sales and revenue shares, latest development plans, and mergers and acquisitions.
- Chapter 3: Examines Luxury Bikes sales and revenue at the regional and country levels. It quantifies market size and growth potential for each region and its key countries, and outlines market development, outlook, addressable space, and national market size.
- Chapter 4: Analyzes segments by Type, detailing the size and growth potential of each segment to help readers identify “blue ocean” opportunities.
- Chapter 5: Analyzes market segments by Application, covering the size and growth potential of each segment to help readers identify “blue ocean” opportunities in downstream markets.
- Chapter 6: Profiles key players, presenting core information on leading companies, including product sales, revenue, pricing, gross margin, product portfolio/introductions, and recent developments.
- Chapter 7: Reviews the industry value chain, including upstream and downstream segments.
- Chapter 8: Discusses market dynamics and recent developments, including drivers, restraints, challenges and risks for manufacturers, U.S. Tariffs and relevant policy analysis.
- Chapter 9: Summarizes the key findings and conclusions of the report.
Ans: The Luxury Bikes Market witnessing a CAGR of 4.5% during the forecast period 2026-2032.
Ans: The Luxury Bikes Market size in 2032 will be US$ 3418 million.
Ans: The main players in the Luxury Bikes Market are Giant Bicycle, Merida Bike, Battle-FSD, Trek Bike, XDS, Shen Ying Biking, Look Cycle, Marmot Bike, Cube Bike, Colnago, SOLOMO, Kestrel Bicycles, Storck Bicycle, Tyrell Bicycle, De Rosa, DAHON, Pinarello, Canyon, Felt Cycles, Ellsworth Bike
Ans: The Applications covered in the Luxury Bikes Market report are Bicycle Racing, Bicycle Touring, Others
Ans: The Types covered in the Luxury Bikes Market report are Road Bikes, Mountain Bikes, Others