1 Market Overview
1.1 Experimental Cynomolgus Monkey Product Introduction
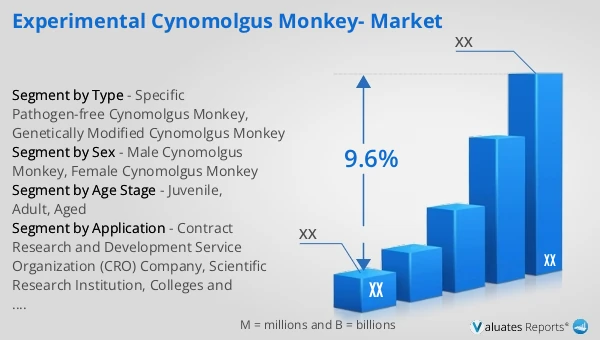
1.2 Global Experimental Cynomolgus Monkey Market Size Forecast
1.2.1 Global Experimental Cynomolgus Monkey Sales Value (2021–2032)
1.2.2 Global Experimental Cynomolgus Monkey Sales Volume (2021–2032)
1.2.3 Global Experimental Cynomolgus Monkey Sales Price (2021–2032)
1.3 Experimental Cynomolgus Monkey Market Trends & Drivers
1.3.1 Experimental Cynomolgus Monkey Industry Trends
1.3.2 Experimental Cynomolgus Monkey Market Drivers & Opportunities
1.3.3 Experimental Cynomolgus Monkey Market Challenges
1.3.4 Experimental Cynomolgus Monkey Market Restraints
1.3.5 Impact of U.S. Tariffs
1.4 Assumptions and Limitations
1.5 Study Objectives
1.6 Years Considered
2 Competitive Analysis by Company
2.1 Global Experimental Cynomolgus Monkey Players Revenue Ranking (2025)
2.2 Global Experimental Cynomolgus Monkey Revenue by Company (2021–2026)
2.3 Global Experimental Cynomolgus Monkey Sales Volume Ranking of Players (2025)
2.4 Global Experimental Cynomolgus Monkey Sales Volume by Company (2021–2026)
2.5 Global Experimental Cynomolgus Monkey Average Price by Company (2021–2026)
2.6 Key Manufacturers Experimental Cynomolgus Monkey Manufacturing Base and Headquarters
2.7 Key Manufacturers Experimental Cynomolgus Monkey Product Offerings
2.8 Key Manufacturers Start of Mass Production of Experimental Cynomolgus Monkey
2.9 Experimental Cynomolgus Monkey Market Competitive Analysis
2.9.1 Experimental Cynomolgus Monkey Market Concentration Rate (2021–2026)
2.9.2 Global 5 and 10 Largest Manufacturers by Experimental Cynomolgus Monkey Revenue in 2025
2.9.3 Global Companies by Tier (Tier 1, Tier 2, Tier 3), based on Experimental Cynomolgus Monkey revenue, 2025
2.10 Mergers & Acquisitions and Expansion
3 Segmentation Experimental Cynomolgus Monkey Market Classification
3.1 Introduction by Type
3.1.1 Specific Pathogen-free Cynomolgus Monkey
3.1.2 Genetically Modified Cynomolgus Monkey
3.1.3 Global Experimental Cynomolgus Monkey Sales Value by Type
3.1.3.1 Global Experimental Cynomolgus Monkey Sales Value by Type (2021 vs 2025 vs 2032)
3.1.3.2 Global Experimental Cynomolgus Monkey Sales Value, by Type (2021–2032)
3.1.3.3 Global Experimental Cynomolgus Monkey Sales Value, by Type (%), 2021–2032
3.1.4 Global Experimental Cynomolgus Monkey Sales Volume by Type
3.1.4.1 Global Experimental Cynomolgus Monkey Sales Volume by Type (2021 vs 2025 vs 2032)
3.1.4.2 Global Experimental Cynomolgus Monkey Sales Volume, by Type (2021–2032)
3.1.4.3 Global Experimental Cynomolgus Monkey Sales Volume, by Type (%), 2021–2032
3.1.5 Global Experimental Cynomolgus Monkey Average Price by Type (2021–2032)
3.2 Introduction by Sex
3.2.1 Male Cynomolgus Monkey
3.2.2 Female Cynomolgus Monkey
3.2.3 Global Experimental Cynomolgus Monkey Sales Value by Sex
3.2.3.1 Global Experimental Cynomolgus Monkey Sales Value by Sex (2021 vs 2025 vs 2032)
3.2.3.2 Global Experimental Cynomolgus Monkey Sales Value, by Sex (2021–2032)
3.2.3.3 Global Experimental Cynomolgus Monkey Sales Value, by Sex (%), 2021–2032
3.2.4 Global Experimental Cynomolgus Monkey Sales Volume by Sex
3.2.4.1 Global Experimental Cynomolgus Monkey Sales Volume by Sex (2021 vs 2025 vs 2032)
3.2.4.2 Global Experimental Cynomolgus Monkey Sales Volume, by Sex (2021–2032)
3.2.4.3 Global Experimental Cynomolgus Monkey Sales Volume, by Sex (%), 2021–2032
3.2.5 Global Experimental Cynomolgus Monkey Average Price by Sex (2021–2032)
3.3 Introduction by Age Stage
3.3.1 Juvenile
3.3.2 Adult
3.3.3 Aged
3.3.4 Global Experimental Cynomolgus Monkey Sales Value by Age Stage
3.3.4.1 Global Experimental Cynomolgus Monkey Sales Value by Age Stage (2021 vs 2025 vs 2032)
3.3.4.2 Global Experimental Cynomolgus Monkey Sales Value, by Age Stage (2021–2032)
3.3.4.3 Global Experimental Cynomolgus Monkey Sales Value, by Age Stage (%), 2021–2032
3.3.5 Global Experimental Cynomolgus Monkey Sales Volume by Age Stage
3.3.5.1 Global Experimental Cynomolgus Monkey Sales Volume by Age Stage (2021 vs 2025 vs 2032)
3.3.5.2 Global Experimental Cynomolgus Monkey Sales Volume, by Age Stage (2021–2032)
3.3.5.3 Global Experimental Cynomolgus Monkey Sales Volume, by Age Stage (%), 2021–2032
3.3.6 Global Experimental Cynomolgus Monkey Average Price by Age Stage (2021–2032)
4 Segmentation by Application
4.1 Introduction by Application
4.1.1 Contract Research and Development Service Organization (CRO) Company
4.1.2 Scientific Research Institution
4.1.3 Colleges and Universities
4.1.4 Other
4.2 Global Experimental Cynomolgus Monkey Sales Value by Application
4.2.1 Global Experimental Cynomolgus Monkey Sales Value by Application (2021 vs 2025 vs 2032)
4.2.2 Global Experimental Cynomolgus Monkey Sales Value, by Application (2021–2032)
4.2.3 Global Experimental Cynomolgus Monkey Sales Value, by Application (%), 2021–2032
4.3 Global Experimental Cynomolgus Monkey Sales Volume by Application
4.3.1 Global Experimental Cynomolgus Monkey Sales Volume by Application (2021 vs 2025 vs 2032)
4.3.2 Global Experimental Cynomolgus Monkey Sales Volume, by Application (2021–2032)
4.3.3 Global Experimental Cynomolgus Monkey Sales Volume, by Application (%), 2021–2032
4.4 Global Experimental Cynomolgus Monkey Average Price by Application (2021–2032)
5 Segmentation by Region
5.1 Global Experimental Cynomolgus Monkey Sales Value by Region
5.1.1 Global Experimental Cynomolgus Monkey Sales Value by Region: 2021 vs 2025 vs 2032
5.1.2 Global Experimental Cynomolgus Monkey Sales Value by Region (2021–2026)
5.1.3 Global Experimental Cynomolgus Monkey Sales Value by Region (2027–2032)
5.1.4 Global Experimental Cynomolgus Monkey Sales Value by Region (%), 2021–2032
5.2 Global Experimental Cynomolgus Monkey Sales Volume by Region
5.2.1 Global Experimental Cynomolgus Monkey Sales Volume by Region: 2021 vs 2025 vs 2032
5.2.2 Global Experimental Cynomolgus Monkey Sales Volume by Region (2021–2026)
5.2.3 Global Experimental Cynomolgus Monkey Sales Volume by Region (2027–2032)
5.2.4 Global Experimental Cynomolgus Monkey Sales Volume by Region (%), 2021–2032
5.3 Global Experimental Cynomolgus Monkey Average Price by Region (2021–2032)
5.4 North America
5.4.1 North America Experimental Cynomolgus Monkey Sales Value, 2021–2032
5.4.2 North America Experimental Cynomolgus Monkey Sales Value by Country (%), 2025 vs 2032
5.5 Europe
5.5.1 Europe Experimental Cynomolgus Monkey Sales Value, 2021–2032
5.5.2 Europe Experimental Cynomolgus Monkey Sales Value by Country (%), 2025 vs 2032
5.6 Asia Pacific
5.6.1 Asia Pacific Experimental Cynomolgus Monkey Sales Value, 2021–2032
5.6.2 Asia Pacific Experimental Cynomolgus Monkey Sales Value by Region (%), 2025 vs 2032
5.7 South America
5.7.1 South America Experimental Cynomolgus Monkey Sales Value, 2021–2032
5.7.2 South America Experimental Cynomolgus Monkey Sales Value by Country (%), 2025 vs 2032
5.8 Middle East & Africa
5.8.1 Middle East & Africa Experimental Cynomolgus Monkey Sales Value, 2021–2032
5.8.2 Middle East & Africa Experimental Cynomolgus Monkey Sales Value by Country (%), 2025 vs 2032
6 Segmentation by Key Countries/Regions
6.1 Key Countries/Regions Experimental Cynomolgus Monkey Sales Value Growth Trends, 2021 vs 2025 vs 2032
6.2 Key Countries/Regions Experimental Cynomolgus Monkey Sales Value and Sales Volume
6.2.1 Key Countries/Regions Experimental Cynomolgus Monkey Sales Value, 2021–2032
6.2.2 Key Countries/Regions Experimental Cynomolgus Monkey Sales Volume, 2021–2032
6.3 United States
6.3.1 United States Experimental Cynomolgus Monkey Sales Value, 2021–2032
6.3.2 United States Experimental Cynomolgus Monkey Sales Value by Type (%), 2025 vs 2032
6.3.3 United States Experimental Cynomolgus Monkey Sales Value by Application, 2025 vs 2032
6.4 Europe
6.4.1 Europe Experimental Cynomolgus Monkey Sales Value, 2021–2032
6.4.2 Europe Experimental Cynomolgus Monkey Sales Value by Type (%), 2025 vs 2032
6.4.3 Europe Experimental Cynomolgus Monkey Sales Value by Application, 2025 vs 2032
6.5 China
6.5.1 China Experimental Cynomolgus Monkey Sales Value, 2021–2032
6.5.2 China Experimental Cynomolgus Monkey Sales Value by Type (%), 2025 vs 2032
6.5.3 China Experimental Cynomolgus Monkey Sales Value by Application, 2025 vs 2032
6.6 Japan
6.6.1 Japan Experimental Cynomolgus Monkey Sales Value, 2021–2032
6.6.2 Japan Experimental Cynomolgus Monkey Sales Value by Type (%), 2025 vs 2032
6.6.3 Japan Experimental Cynomolgus Monkey Sales Value by Application, 2025 vs 2032
6.7 South Korea
6.7.1 South Korea Experimental Cynomolgus Monkey Sales Value, 2021–2032
6.7.2 South Korea Experimental Cynomolgus Monkey Sales Value by Type (%), 2025 vs 2032
6.7.3 South Korea Experimental Cynomolgus Monkey Sales Value by Application, 2025 vs 2032
6.8 Southeast Asia
6.8.1 Southeast Asia Experimental Cynomolgus Monkey Sales Value, 2021–2032
6.8.2 Southeast Asia Experimental Cynomolgus Monkey Sales Value by Type (%), 2025 vs 2032
6.8.3 Southeast Asia Experimental Cynomolgus Monkey Sales Value by Application, 2025 vs 2032
6.9 India
6.9.1 India Experimental Cynomolgus Monkey Sales Value, 2021–2032
6.9.2 India Experimental Cynomolgus Monkey Sales Value by Type (%), 2025 vs 2032
6.9.3 India Experimental Cynomolgus Monkey Sales Value by Application, 2025 vs 2032
7 Company Profiles
7.1 Vanny Bio Research
7.1.1 Vanny Bio Research Company Information
7.1.2 Vanny Bio Research Introduction and Business Overview
7.1.3 Vanny Bio Research Experimental Cynomolgus Monkey Sales, Revenue, Price and Gross Margin (2021–2026)
7.1.4 Vanny Bio Research Experimental Cynomolgus Monkey Product Offerings
7.1.5 Vanny Bio Research Recent Developments
7.2 HZ-Bio
7.2.1 HZ-Bio Company Information
7.2.2 HZ-Bio Introduction and Business Overview
7.2.3 HZ-Bio Experimental Cynomolgus Monkey Sales, Revenue, Price and Gross Margin (2021–2026)
7.2.4 HZ-Bio Experimental Cynomolgus Monkey Product Offerings
7.2.5 HZ-Bio Recent Developments
7.3 Envigo (Inotiv)
7.3.1 Envigo (Inotiv) Company Information
7.3.2 Envigo (Inotiv) Introduction and Business Overview
7.3.3 Envigo (Inotiv) Experimental Cynomolgus Monkey Sales, Revenue, Price and Gross Margin (2021–2026)
7.3.4 Envigo (Inotiv) Experimental Cynomolgus Monkey Product Offerings
7.3.5 Envigo (Inotiv) Recent Developments
7.4 JOINN LABORATORIES
7.4.1 JOINN LABORATORIES Company Information
7.4.2 JOINN LABORATORIES Introduction and Business Overview
7.4.3 JOINN LABORATORIES Experimental Cynomolgus Monkey Sales, Revenue, Price and Gross Margin (2021–2026)
7.4.4 JOINN LABORATORIES Experimental Cynomolgus Monkey Product Offerings
7.4.5 JOINN LABORATORIES Recent Developments
7.5 WuXi AppTec
7.5.1 WuXi AppTec Company Information
7.5.2 WuXi AppTec Introduction and Business Overview
7.5.3 WuXi AppTec Experimental Cynomolgus Monkey Sales, Revenue, Price and Gross Margin (2021–2026)
7.5.4 WuXi AppTec Experimental Cynomolgus Monkey Product Offerings
7.5.5 WuXi AppTec Recent Developments
7.6 Jingang Biotech
7.6.1 Jingang Biotech Company Information
7.6.2 Jingang Biotech Introduction and Business Overview
7.6.3 Jingang Biotech Experimental Cynomolgus Monkey Sales, Revenue, Price and Gross Margin (2021–2026)
7.6.4 Jingang Biotech Experimental Cynomolgus Monkey Product Offerings
7.6.5 Jingang Biotech Recent Developments
7.7 Pharmaron
7.7.1 Pharmaron Company Information
7.7.2 Pharmaron Introduction and Business Overview
7.7.3 Pharmaron Experimental Cynomolgus Monkey Sales, Revenue, Price and Gross Margin (2021–2026)
7.7.4 Pharmaron Experimental Cynomolgus Monkey Product Offerings
7.7.5 Pharmaron Recent Developments
7.8 Xishan Zhongke
7.8.1 Xishan Zhongke Company Information
7.8.2 Xishan Zhongke Introduction and Business Overview
7.8.3 Xishan Zhongke Experimental Cynomolgus Monkey Sales, Revenue, Price and Gross Margin (2021–2026)
7.8.4 Xishan Zhongke Experimental Cynomolgus Monkey Product Offerings
7.8.5 Xishan Zhongke Recent Developments
7.9 ONPRC (Oregon National Primate Research Center)
7.9.1 ONPRC (Oregon National Primate Research Center) Company Information
7.9.2 ONPRC (Oregon National Primate Research Center) Introduction and Business Overview
7.9.3 ONPRC (Oregon National Primate Research Center) Experimental Cynomolgus Monkey Sales, Revenue, Price and Gross Margin (2021–2026)
7.9.4 ONPRC (Oregon National Primate Research Center) Experimental Cynomolgus Monkey Product Offerings
7.9.5 ONPRC (Oregon National Primate Research Center) Recent Developments
7.10 Sichuan Hengshu Bio-Technolog
7.10.1 Sichuan Hengshu Bio-Technolog Company Information
7.10.2 Sichuan Hengshu Bio-Technolog Introduction and Business Overview
7.10.3 Sichuan Hengshu Bio-Technolog Experimental Cynomolgus Monkey Sales, Revenue, Price and Gross Margin (2021–2026)
7.10.4 Sichuan Hengshu Bio-Technolog Experimental Cynomolgus Monkey Product Offerings
7.10.5 Sichuan Hengshu Bio-Technolog Recent Developments
7.11 Topgene Biotechnology
7.11.1 Topgene Biotechnology Company Information
7.11.2 Topgene Biotechnology Introduction and Business Overview
7.11.3 Topgene Biotechnology Experimental Cynomolgus Monkey Sales, Revenue, Price and Gross Margin (2021–2026)
7.11.4 Topgene Biotechnology Experimental Cynomolgus Monkey Product Offerings
7.11.5 Topgene Biotechnology Recent Developments
7.12 Primate Products, Inc. (PPI)
7.12.1 Primate Products, Inc. (PPI) Company Information
7.12.2 Primate Products, Inc. (PPI) Introduction and Business Overview
7.12.3 Primate Products, Inc. (PPI) Experimental Cynomolgus Monkey Sales, Revenue, Price and Gross Margin (2021–2026)
7.12.4 Primate Products, Inc. (PPI) Experimental Cynomolgus Monkey Product Offerings
7.12.5 Primate Products, Inc. (PPI) Recent Developments
7.13 Sichuan Green-House Biotech
7.13.1 Sichuan Green-House Biotech Company Information
7.13.2 Sichuan Green-House Biotech Introduction and Business Overview
7.13.3 Sichuan Green-House Biotech Experimental Cynomolgus Monkey Sales, Revenue, Price and Gross Margin (2021–2026)
7.13.4 Sichuan Green-House Biotech Experimental Cynomolgus Monkey Product Offerings
7.13.5 Sichuan Green-House Biotech Recent Developments
7.14 Bioculture Group
7.14.1 Bioculture Group Company Information
7.14.2 Bioculture Group Introduction and Business Overview
7.14.3 Bioculture Group Experimental Cynomolgus Monkey Sales, Revenue, Price and Gross Margin (2021–2026)
7.14.4 Bioculture Group Experimental Cynomolgus Monkey Product Offerings
7.14.5 Bioculture Group Recent Developments
7.15 Beijing Institute of Xieerxin Biology Resource
7.15.1 Beijing Institute of Xieerxin Biology Resource Company Information
7.15.2 Beijing Institute of Xieerxin Biology Resource Introduction and Business Overview
7.15.3 Beijing Institute of Xieerxin Biology Resource Experimental Cynomolgus Monkey Sales, Revenue, Price and Gross Margin (2021–2026)
7.15.4 Beijing Institute of Xieerxin Biology Resource Experimental Cynomolgus Monkey Product Offerings
7.15.5 Beijing Institute of Xieerxin Biology Resource Recent Developments
8 Industry Chain Analysis
8.1 Experimental Cynomolgus Monkey Industrial Chain
8.2 Experimental Cynomolgus Monkey Upstream Analysis
8.2.1 Key Raw Materials
8.2.2 Key Suppliers of Raw Materials
8.2.3 Manufacturing Cost Structure
8.3 Midstream Analysis
8.4 Downstream Analysis (Customer Analysis)
8.5 Sales Model and Sales Channelss
8.5.1 Experimental Cynomolgus Monkey Sales Model
8.5.2 Sales Channels
8.5.3 Experimental Cynomolgus Monkey Distributors
9 Research Findings and Conclusion
10 Appendix
10.1 Research Methodology
10.1.1 Methodology/Research Approach
10.1.1.1 Research Programs/Design
10.1.1.2 Market Size Estimation
10.1.1.3 Market Breakdown and Data Triangulation
10.1.2 Data Source
10.1.2.1 Secondary Sources
10.1.2.2 Primary Sources
10.2 Author Details
10.3 Disclaimer