List of Tables
Table 1. Global Custom Metal Forging Services Market Size Growth Rate by Type (US$ Million): 2021 vs 2025 vs 2032
Table 2. Key Players of Hot Forging
Table 3. Key Players of Cold Forging
Table 4. Key Players of Warm Forging
Table 5. Key Players of Isothermal Forging
Table 6. Key Players of Multi-Directional Forging
Table 7. Key Players of Others
Table 8. Global Custom Metal Forging Services Market Size Growth Rate by Forming Method (US$ Million): 2021 vs 2025 vs 2032
Table 9. Key Players of Free Forging
Table 10. Key Players of Open Die Forging
Table 11. Key Players of Closed Die Forging
Table 12. Key Players of Ring Rolling Forging
Table 13. Key Players of Roll Forging
Table 14. Global Custom Metal Forging Services Market Size Growth Rate by Precision (US$ Million): 2021 vs 2025 vs 2032
Table 15. Key Players of ±0.5-2mm
Table 16. Key Players of ±0.1-0.5mm
Table 17. Key Players of ±0.01-0.1mm
Table 18. Key Players of Others
Table 19. Global Custom Metal Forging Services Market Size Growth Rate by Raw Materials (US$ Million): 2021 vs 2025 vs 2032
Table 20. Key Players of Carbon Steel
Table 21. Key Players of Alloy Steel
Table 22. Key Players of Stainless Steel
Table 23. Key Players of Aluminum Alloy
Table 24. Key Players of Magnesium Alloy
Table 25. Key Players of Titanium Alloy
Table 26. Key Players of Copper/Copper Alloy
Table 27. Global Custom Metal Forging Services Market Size Growth by Application (US$ Million): 2021 vs 2025 vs 2032
Table 28. Global Custom Metal Forging Services Market Size by Region (US$ Million): 2021 vs 2025 vs 2032
Table 29. Global Custom Metal Forging Services Market Size by Region (US$ Million), 2021–2026
Table 30. Global Custom Metal Forging Services Market Share by Region (2021–2026)
Table 31. Global Custom Metal Forging Services Forecasted Market Size by Region (US$ Million), 2027–2032
Table 32. Global Custom Metal Forging Services Market Share by Region (2027–2032)
Table 33. Custom Metal Forging Services Market Trends
Table 34. Custom Metal Forging Services Market Drivers
Table 35. Custom Metal Forging Services Market Challenges
Table 36. Custom Metal Forging Services Market Restraints
Table 37. Global Custom Metal Forging Services Revenue by Players (US$ Million), 2021–2026
Table 38. Global Custom Metal Forging Services Market Share by Players (2021–2026)
Table 39. Global Top Custom Metal Forging Services Players by Tier (Tier 1, Tier 2, and Tier 3), based on Custom Metal Forging Services Revenue, 2025
Table 40. Ranking of Global Top Custom Metal Forging Services Companies by Revenue (US$ Million) in 2025
Table 41. Global 5 Largest Players Market Share by Custom Metal Forging Services Revenue (CR5 and HHI), 2021–2026
Table 42. Global Key Players of Custom Metal Forging Services, Headquarters and Area Served
Table 43. Global Key Players of Custom Metal Forging Services, Products and Applications
Table 44. Global Key Players of Custom Metal Forging Services, Date of General Availability (GA)
Table 45. Mergers and Acquisitions, Expansion Plans
Table 46. Global Custom Metal Forging Services Market Size by Type (US$ Million), 2021–2026
Table 47. Global Custom Metal Forging Services Revenue Market Share by Type (2021–2026)
Table 48. Global Custom Metal Forging Services Forecasted Market Size by Type (US$ Million), 2027–2032
Table 49. Global Custom Metal Forging Services Revenue Market Share by Type (2027–2032)
Table 50. Global Custom Metal Forging Services Market Size by Application (US$ Million), 2021–2026
Table 51. Global Custom Metal Forging Services Revenue Market Share by Application (2021–2026)
Table 52. Global Custom Metal Forging Services Forecasted Market Size by Application (US$ Million), 2027–2032
Table 53. Global Custom Metal Forging Services Revenue Market Share by Application (2027–2032)
Table 54. North America Custom Metal Forging Services Market Size Growth Rate by Country (US$ Million): 2021 vs 2025 vs 2032
Table 55. North America Custom Metal Forging Services Market Size by Country (US$ Million), 2021–2026
Table 56. North America Custom Metal Forging Services Market Size by Country (US$ Million), 2027–2032
Table 57. Europe Custom Metal Forging Services Market Size Growth Rate by Country (US$ Million): 2021 vs 2025 vs 2032
Table 58. Europe Custom Metal Forging Services Market Size by Country (US$ Million), 2021–2026
Table 59. Europe Custom Metal Forging Services Market Size by Country (US$ Million), 2027–2032
Table 60. Asia-Pacific Custom Metal Forging Services Market Size Growth Rate by Region (US$ Million): 2021 vs 2025 vs 2032
Table 61. Asia-Pacific Custom Metal Forging Services Market Size by Region (US$ Million), 2021–2026
Table 62. Asia-Pacific Custom Metal Forging Services Market Size by Region (US$ Million), 2027–2032
Table 63. Latin America Custom Metal Forging Services Market Size Growth Rate by Country (US$ Million): 2021 vs 2025 vs 2032
Table 64. Latin America Custom Metal Forging Services Market Size by Country (US$ Million), 2021–2026
Table 65. Latin America Custom Metal Forging Services Market Size by Country (US$ Million), 2027–2032
Table 66. Middle East & Africa Custom Metal Forging Services Market Size Growth Rate by Country (US$ Million): 2021 vs 2025 vs 2032
Table 67. Middle East & Africa Custom Metal Forging Services Market Size by Country (US$ Million), 2021–2026
Table 68. Middle East & Africa Custom Metal Forging Services Market Size by Country (US$ Million), 2027–2032
Table 69. Precision Castparts Corp Company Details
Table 70. Precision Castparts Corp Business Overview
Table 71. Precision Castparts Corp Custom Metal Forging Services Product
Table 72. Precision Castparts Corp Revenue in Custom Metal Forging Services Business (US$ Million), 2021–2026
Table 73. Precision Castparts Corp Recent Development
Table 74. Howmet Aerospace Inc. Company Details
Table 75. Howmet Aerospace Inc. Business Overview
Table 76. Howmet Aerospace Inc. Custom Metal Forging Services Product
Table 77. Howmet Aerospace Inc. Revenue in Custom Metal Forging Services Business (US$ Million), 2021–2026
Table 78. Howmet Aerospace Inc. Recent Development
Table 79. Allegheny Technologies Incorporated (ATI) Company Details
Table 80. Allegheny Technologies Incorporated (ATI) Business Overview
Table 81. Allegheny Technologies Incorporated (ATI) Custom Metal Forging Services Product
Table 82. Allegheny Technologies Incorporated (ATI) Revenue in Custom Metal Forging Services Business (US$ Million), 2021–2026
Table 83. Allegheny Technologies Incorporated (ATI) Recent Development
Table 84. ThyssenKrupp Company Details
Table 85. ThyssenKrupp Business Overview
Table 86. ThyssenKrupp Custom Metal Forging Services Product
Table 87. ThyssenKrupp Revenue in Custom Metal Forging Services Business (US$ Million), 2021–2026
Table 88. ThyssenKrupp Recent Development
Table 89. Bharat Forge Company Details
Table 90. Bharat Forge Business Overview
Table 91. Bharat Forge Custom Metal Forging Services Product
Table 92. Bharat Forge Revenue in Custom Metal Forging Services Business (US$ Million), 2021–2026
Table 93. Bharat Forge Recent Development
Table 94. American Axle & Manufacturing (AAM) Company Details
Table 95. American Axle & Manufacturing (AAM) Business Overview
Table 96. American Axle & Manufacturing (AAM) Custom Metal Forging Services Product
Table 97. American Axle & Manufacturing (AAM) Revenue in Custom Metal Forging Services Business (US$ Million), 2021–2026
Table 98. American Axle & Manufacturing (AAM) Recent Development
Table 99. VSMPO‑AVISMA Corporation Company Details
Table 100. VSMPO‑AVISMA Corporation Business Overview
Table 101. VSMPO‑AVISMA Corporation Custom Metal Forging Services Product
Table 102. VSMPO‑AVISMA Corporation Revenue in Custom Metal Forging Services Business (US$ Million), 2021–2026
Table 103. VSMPO‑AVISMA Corporation Recent Development
Table 104. Aichi Steel Corporation Company Details
Table 105. Aichi Steel Corporation Business Overview
Table 106. Aichi Steel Corporation Custom Metal Forging Services Product
Table 107. Aichi Steel Corporation Revenue in Custom Metal Forging Services Business (US$ Million), 2021–2026
Table 108. Aichi Steel Corporation Recent Development
Table 109. Aubert & Duval Company Details
Table 110. Aubert & Duval Business Overview
Table 111. Aubert & Duval Custom Metal Forging Services Product
Table 112. Aubert & Duval Revenue in Custom Metal Forging Services Business (US$ Million), 2021–2026
Table 113. Aubert & Duval Recent Development
Table 114. Scot Forge Company Details
Table 115. Scot Forge Business Overview
Table 116. Scot Forge Custom Metal Forging Services Product
Table 117. Scot Forge Revenue in Custom Metal Forging Services Business (US$ Million), 2021–2026
Table 118. Scot Forge Recent Development
Table 119. FRISA Company Details
Table 120. FRISA Business Overview
Table 121. FRISA Custom Metal Forging Services Product
Table 122. FRISA Revenue in Custom Metal Forging Services Business (US$ Million), 2021–2026
Table 123. FRISA Recent Development
Table 124. Farinia Group Company Details
Table 125. Farinia Group Business Overview
Table 126. Farinia Group Custom Metal Forging Services Product
Table 127. Farinia Group Revenue in Custom Metal Forging Services Business (US$ Million), 2021–2026
Table 128. Farinia Group Recent Development
Table 129. Wanxiang Qianchao Company Details
Table 130. Wanxiang Qianchao Business Overview
Table 131. Wanxiang Qianchao Custom Metal Forging Services Product
Table 132. Wanxiang Qianchao Revenue in Custom Metal Forging Services Business (US$ Million), 2021–2026
Table 133. Wanxiang Qianchao Recent Development
Table 134. Pacific Precision Forging Company Details
Table 135. Pacific Precision Forging Business Overview
Table 136. Pacific Precision Forging Custom Metal Forging Services Product
Table 137. Pacific Precision Forging Revenue in Custom Metal Forging Services Business (US$ Million), 2021–2026
Table 138. Pacific Precision Forging Recent Development
Table 139. Jinma Industrial Group Company Details
Table 140. Jinma Industrial Group Business Overview
Table 141. Jinma Industrial Group Custom Metal Forging Services Product
Table 142. Jinma Industrial Group Revenue in Custom Metal Forging Services Business (US$ Million), 2021–2026
Table 143. Jinma Industrial Group Recent Development
Table 144. Mahindra Forgings Company Details
Table 145. Mahindra Forgings Business Overview
Table 146. Mahindra Forgings Custom Metal Forging Services Product
Table 147. Mahindra Forgings Revenue in Custom Metal Forging Services Business (US$ Million), 2021–2026
Table 148. Mahindra Forgings Recent Development
Table 149. CITIC Heavy Industries Company Details
Table 150. CITIC Heavy Industries Business Overview
Table 151. CITIC Heavy Industries Custom Metal Forging Services Product
Table 152. CITIC Heavy Industries Revenue in Custom Metal Forging Services Business (US$ Million), 2021–2026
Table 153. CITIC Heavy Industries Recent Development
Table 154. Dongfeng Forging Company Details
Table 155. Dongfeng Forging Business Overview
Table 156. Dongfeng Forging Custom Metal Forging Services Product
Table 157. Dongfeng Forging Revenue in Custom Metal Forging Services Business (US$ Million), 2021–2026
Table 158. Dongfeng Forging Recent Development
Table 159. Wuxi Paike New Material Technology Company Details
Table 160. Wuxi Paike New Material Technology Business Overview
Table 161. Wuxi Paike New Material Technology Custom Metal Forging Services Product
Table 162. Wuxi Paike New Material Technology Revenue in Custom Metal Forging Services Business (US$ Million), 2021–2026
Table 163. Wuxi Paike New Material Technology Recent Development
Table 164. Brück GmbH Company Details
Table 165. Brück GmbH Business Overview
Table 166. Brück GmbH Custom Metal Forging Services Product
Table 167. Brück GmbH Revenue in Custom Metal Forging Services Business (US$ Million), 2021–2026
Table 168. Brück GmbH Recent Development
Table 169. SIFCO Industries Company Details
Table 170. SIFCO Industries Business Overview
Table 171. SIFCO Industries Custom Metal Forging Services Product
Table 172. SIFCO Industries Revenue in Custom Metal Forging Services Business (US$ Million), 2021–2026
Table 173. SIFCO Industries Recent Development
Table 174. Ramkrishna Forgings Company Details
Table 175. Ramkrishna Forgings Business Overview
Table 176. Ramkrishna Forgings Custom Metal Forging Services Product
Table 177. Ramkrishna Forgings Revenue in Custom Metal Forging Services Business (US$ Million), 2021–2026
Table 178. Ramkrishna Forgings Recent Development
Table 179. ISGEC Heavy Engineering Company Details
Table 180. ISGEC Heavy Engineering Business Overview
Table 181. ISGEC Heavy Engineering Custom Metal Forging Services Product
Table 182. ISGEC Heavy Engineering Revenue in Custom Metal Forging Services Business (US$ Million), 2021–2026
Table 183. ISGEC Heavy Engineering Recent Development
Table 184. Kalyani Group Company Details
Table 185. Kalyani Group Business Overview
Table 186. Kalyani Group Custom Metal Forging Services Product
Table 187. Kalyani Group Revenue in Custom Metal Forging Services Business (US$ Million), 2021–2026
Table 188. Kalyani Group Recent Development
Table 189. Research Programs/Design for This Report
Table 190. Key Data Information from Secondary Sources
Table 191. Key Data Information from Primary Sources
Table 192. Authors List of This Report
List of Figures
Figure 1. Custom Metal Forging Services Picture
Figure 2. Global Custom Metal Forging Services Market Size Comparison by Type (US$ Million), 2021–2032
Figure 3. Global Custom Metal Forging Services Market Share by Type: 2025 vs 2032
Figure 4. Hot Forging Features
Figure 5. Cold Forging Features
Figure 6. Warm Forging Features
Figure 7. Isothermal Forging Features
Figure 8. Multi-Directional Forging Features
Figure 9. Others Features
Figure 10. Global Custom Metal Forging Services Market Size Comparison by Forming Method (US$ Million), 2021–2032
Figure 11. Free Forging Features
Figure 12. Open Die Forging Features
Figure 13. Closed Die Forging Features
Figure 14. Ring Rolling Forging Features
Figure 15. Roll Forging Features
Figure 16. Global Custom Metal Forging Services Market Size Comparison by Precision (US$ Million), 2021–2032
Figure 17. ±0.5-2mm Features
Figure 18. ±0.1-0.5mm Features
Figure 19. ±0.01-0.1mm Features
Figure 20. Others Features
Figure 21. Global Custom Metal Forging Services Market Size Comparison by Raw Materials (US$ Million), 2021–2032
Figure 22. Carbon Steel Features
Figure 23. Alloy Steel Features
Figure 24. Stainless Steel Features
Figure 25. Aluminum Alloy Features
Figure 26. Magnesium Alloy Features
Figure 27. Titanium Alloy Features
Figure 28. Copper/Copper Alloy Features
Figure 29. Others Features
Figure 30. Global Custom Metal Forging Services Market Size by Application (US$ Million), 2021–2032
Figure 31. Global Custom Metal Forging Services Market Share by Application: 2025 vs 2032
Figure 32. Aerospace Case Studies
Figure 33. Automotive Manufacturing Case Studies
Figure 34. Energy Equipment Case Studies
Figure 35. Construction Machinery Case Studies
Figure 36. Others Case Studies
Figure 37. Custom Metal Forging Services Report Years Considered
Figure 38. Global Custom Metal Forging Services Market Size (US$ Million), Year-over-Year: 2021–2032
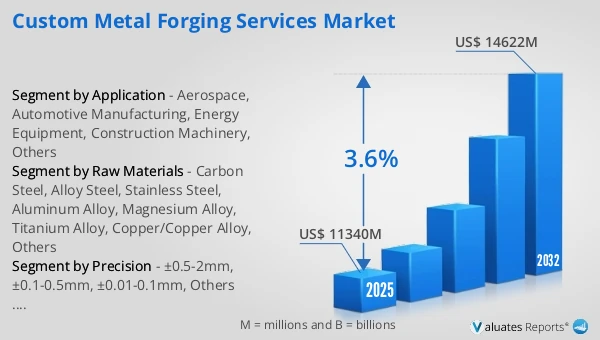
Figure 39. Global Custom Metal Forging Services Market Size, (US$ Million), 2021 vs 2025 vs 2032
Figure 40. Global Custom Metal Forging Services Market Share by Region: 2025 vs 2032
Figure 41. Global Custom Metal Forging Services Market Share by Players in 2025
Figure 42. Global Custom Metal Forging Services Market Share by Company Type (Tier 1, Tier 2, and Tier 3)
Figure 43. The Top 10 and 5 Players Market Share by Custom Metal Forging Services Revenue in 2025
Figure 44. North America Custom Metal Forging Services Market Size YoY Growth (US$ Million), 2021–2032
Figure 45. North America Custom Metal Forging Services Market Share by Country (2021–2032)
Figure 46. United States Custom Metal Forging Services Market Size YoY Growth (US$ Million), 2021–2032
Figure 47. Canada Custom Metal Forging Services Market Size YoY Growth (US$ Million), 2021–2032
Figure 48. Europe Custom Metal Forging Services Market Size YoY Growth (US$ Million), 2021–2032
Figure 49. Europe Custom Metal Forging Services Market Share by Country (2021–2032)
Figure 50. Germany Custom Metal Forging Services Market Size YoY Growth (US$ Million), 2021–2032
Figure 51. France Custom Metal Forging Services Market Size YoY Growth (US$ Million), 2021–2032
Figure 52. U.K. Custom Metal Forging Services Market Size YoY Growth (US$ Million), 2021–2032
Figure 53. Italy Custom Metal Forging Services Market Size YoY Growth (US$ Million), 2021–2032
Figure 54. Russia Custom Metal Forging Services Market Size YoY Growth (US$ Million), 2021–2032
Figure 55. Ireland Custom Metal Forging Services Market Size YoY Growth (US$ Million), 2021–2032
Figure 56. Asia-Pacific Custom Metal Forging Services Market Size YoY Growth (US$ Million), 2021–2032
Figure 57. Asia-Pacific Custom Metal Forging Services Market Share by Region (2021–2032)
Figure 58. China Custom Metal Forging Services Market Size YoY Growth (US$ Million), 2021–2032
Figure 59. Japan Custom Metal Forging Services Market Size YoY Growth (US$ Million), 2021–2032
Figure 60. South Korea Custom Metal Forging Services Market Size YoY Growth (US$ Million), 2021–2032
Figure 61. Southeast Asia Custom Metal Forging Services Market Size YoY Growth (US$ Million), 2021–2032
Figure 62. India Custom Metal Forging Services Market Size YoY Growth (US$ Million), 2021–2032
Figure 63. Australia & New Zealand Custom Metal Forging Services Market Size YoY Growth (US$ Million), 2021–2032
Figure 64. Latin America Custom Metal Forging Services Market Size YoY Growth (US$ Million), 2021–2032
Figure 65. Latin America Custom Metal Forging Services Market Share by Country (2021–2032)
Figure 66. Mexico Custom Metal Forging Services Market Size YoY Growth (US$ Million), 2021–2032
Figure 67. Brazil Custom Metal Forging Services Market Size YoY Growth (US$ Million), 2021–2032
Figure 68. Middle East & Africa Custom Metal Forging Services Market Size YoY Growth (US$ Million), 2021–2032
Figure 69. Middle East & Africa Custom Metal Forging Services Market Share by Country (2021–2032)
Figure 70. Israel Custom Metal Forging Services Market Size YoY Growth (US$ Million), 2021–2032
Figure 71. Saudi Arabia Custom Metal Forging Services Market Size YoY Growth (US$ Million), 2021–2032
Figure 72. UAE Custom Metal Forging Services Market Size YoY Growth (US$ Million), 2021–2032
Figure 73. Precision Castparts Corp Revenue Growth Rate in Custom Metal Forging Services Business (2021–2026)
Figure 74. Howmet Aerospace Inc. Revenue Growth Rate in Custom Metal Forging Services Business (2021–2026)
Figure 75. Allegheny Technologies Incorporated (ATI) Revenue Growth Rate in Custom Metal Forging Services Business (2021–2026)
Figure 76. ThyssenKrupp Revenue Growth Rate in Custom Metal Forging Services Business (2021–2026)
Figure 77. Bharat Forge Revenue Growth Rate in Custom Metal Forging Services Business (2021–2026)
Figure 78. American Axle & Manufacturing (AAM) Revenue Growth Rate in Custom Metal Forging Services Business (2021–2026)
Figure 79. VSMPO‑AVISMA Corporation Revenue Growth Rate in Custom Metal Forging Services Business (2021–2026)
Figure 80. Aichi Steel Corporation Revenue Growth Rate in Custom Metal Forging Services Business (2021–2026)
Figure 81. Aubert & Duval Revenue Growth Rate in Custom Metal Forging Services Business (2021–2026)
Figure 82. Scot Forge Revenue Growth Rate in Custom Metal Forging Services Business (2021–2026)
Figure 83. FRISA Revenue Growth Rate in Custom Metal Forging Services Business (2021–2026)
Figure 84. Farinia Group Revenue Growth Rate in Custom Metal Forging Services Business (2021–2026)
Figure 85. Wanxiang Qianchao Revenue Growth Rate in Custom Metal Forging Services Business (2021–2026)
Figure 86. Pacific Precision Forging Revenue Growth Rate in Custom Metal Forging Services Business (2021–2026)
Figure 87. Jinma Industrial Group Revenue Growth Rate in Custom Metal Forging Services Business (2021–2026)
Figure 88. Mahindra Forgings Revenue Growth Rate in Custom Metal Forging Services Business (2021–2026)
Figure 89. CITIC Heavy Industries Revenue Growth Rate in Custom Metal Forging Services Business (2021–2026)
Figure 90. Dongfeng Forging Revenue Growth Rate in Custom Metal Forging Services Business (2021–2026)
Figure 91. Wuxi Paike New Material Technology Revenue Growth Rate in Custom Metal Forging Services Business (2021–2026)
Figure 92. Brück GmbH Revenue Growth Rate in Custom Metal Forging Services Business (2021–2026)
Figure 93. SIFCO Industries Revenue Growth Rate in Custom Metal Forging Services Business (2021–2026)
Figure 94. Ramkrishna Forgings Revenue Growth Rate in Custom Metal Forging Services Business (2021–2026)
Figure 95. ISGEC Heavy Engineering Revenue Growth Rate in Custom Metal Forging Services Business (2021–2026)
Figure 96. Kalyani Group Revenue Growth Rate in Custom Metal Forging Services Business (2021–2026)
Figure 97. Bottom-up and Top-down Approaches for This Report
Figure 98. Data Triangulation
Figure 99. Key Executives Interviewed