List of Tables
Table 1. Global Children Products Testing and Certification Market Size Growth Rate by Type (US$ Million): 2020 VS 2024 VS 2031
Table 2. Key Players of Mechanical & Physical Testing
Table 3. Key Players of Flammability Testing
Table 4. Key Players of Chemical Testing
Table 5. Key Players of Electrical Safety Testing
Table 6. Key Players of Age Grading & Labeling
Table 7. Key Players of Durability & Drop Testing
Table 8. Key Players of Hygiene & Microbial Testing
Table 9. Global Children Products Testing and Certification Market Size Growth by Application (US$ Million): 2020 VS 2024 VS 2031
Table 10. Global Children Products Testing and Certification Market Size by Region (US$ Million): 2020 VS 2024 VS 2031
Table 11. Global Children Products Testing and Certification Market Size by Region (2020-2025) & (US$ Million)
Table 12. Global Children Products Testing and Certification Market Share by Region (2020-2025)
Table 13. Global Children Products Testing and Certification Forecasted Market Size by Region (2026-2031) & (US$ Million)
Table 14. Global Children Products Testing and Certification Market Share by Region (2026-2031)
Table 15. Children Products Testing and Certification Market Trends
Table 16. Children Products Testing and Certification Market Drivers
Table 17. Children Products Testing and Certification Market Challenges
Table 18. Children Products Testing and Certification Market Restraints
Table 19. Global Children Products Testing and Certification Revenue by Players (2020-2025) & (US$ Million)
Table 20. Global Children Products Testing and Certification Market Share by Players (2020-2025)
Table 21. Global Top Children Products Testing and Certification Players by Company Type (Tier 1, Tier 2, and Tier 3) & (based on the Revenue in Children Products Testing and Certification as of 2024)
Table 22. Ranking of Global Top Children Products Testing and Certification Companies by Revenue (US$ Million) in 2024
Table 23. Global 5 Largest Players Market Share by Children Products Testing and Certification Revenue (CR5 and HHI) & (2020-2025)
Table 24. Global Key Players of Children Products Testing and Certification, Headquarters and Area Served
Table 25. Global Key Players of Children Products Testing and Certification, Product and Application
Table 26. Global Key Players of Children Products Testing and Certification, Date of Enter into This Industry
Table 27. Mergers & Acquisitions, Expansion Plans
Table 28. Global Children Products Testing and Certification Market Size by Type (2020-2025) & (US$ Million)
Table 29. Global Children Products Testing and Certification Revenue Market Share by Type (2020-2025)
Table 30. Global Children Products Testing and Certification Forecasted Market Size by Type (2026-2031) & (US$ Million)
Table 31. Global Children Products Testing and Certification Revenue Market Share by Type (2026-2031)
Table 32. Global Children Products Testing and Certification Market Size by Application (2020-2025) & (US$ Million)
Table 33. Global Children Products Testing and Certification Revenue Market Share by Application (2020-2025)
Table 34. Global Children Products Testing and Certification Forecasted Market Size by Application (2026-2031) & (US$ Million)
Table 35. Global Children Products Testing and Certification Revenue Market Share by Application (2026-2031)
Table 36. North America Children Products Testing and Certification Market Size Growth Rate by Country (US$ Million): 2020 VS 2024 VS 2031
Table 37. North America Children Products Testing and Certification Market Size by Country (2020-2025) & (US$ Million)
Table 38. North America Children Products Testing and Certification Market Size by Country (2026-2031) & (US$ Million)
Table 39. Europe Children Products Testing and Certification Market Size Growth Rate by Country (US$ Million): 2020 VS 2024 VS 2031
Table 40. Europe Children Products Testing and Certification Market Size by Country (2020-2025) & (US$ Million)
Table 41. Europe Children Products Testing and Certification Market Size by Country (2026-2031) & (US$ Million)
Table 42. Asia-Pacific Children Products Testing and Certification Market Size Growth Rate by Region (US$ Million): 2020 VS 2024 VS 2031
Table 43. Asia-Pacific Children Products Testing and Certification Market Size by Region (2020-2025) & (US$ Million)
Table 44. Asia-Pacific Children Products Testing and Certification Market Size by Region (2026-2031) & (US$ Million)
Table 45. Latin America Children Products Testing and Certification Market Size Growth Rate by Country (US$ Million): 2020 VS 2024 VS 2031
Table 46. Latin America Children Products Testing and Certification Market Size by Country (2020-2025) & (US$ Million)
Table 47. Latin America Children Products Testing and Certification Market Size by Country (2026-2031) & (US$ Million)
Table 48. Middle East & Africa Children Products Testing and Certification Market Size Growth Rate by Country (US$ Million): 2020 VS 2024 VS 2031
Table 49. Middle East & Africa Children Products Testing and Certification Market Size by Country (2020-2025) & (US$ Million)
Table 50. Middle East & Africa Children Products Testing and Certification Market Size by Country (2026-2031) & (US$ Million)
Table 51. TÜV SÜD Company Details
Table 52. TÜV SÜD Business Overview
Table 53. TÜV SÜD Children Products Testing and Certification Product
Table 54. TÜV SÜD Revenue in Children Products Testing and Certification Business (2020-2025) & (US$ Million)
Table 55. TÜV SÜD Recent Development
Table 56. Materials Analytical Services Company Details
Table 57. Materials Analytical Services Business Overview
Table 58. Materials Analytical Services Children Products Testing and Certification Product
Table 59. Materials Analytical Services Revenue in Children Products Testing and Certification Business (2020-2025) & (US$ Million)
Table 60. Materials Analytical Services Recent Development
Table 61. Worldwide Quality Control Company Details
Table 62. Worldwide Quality Control Business Overview
Table 63. Worldwide Quality Control Children Products Testing and Certification Product
Table 64. Worldwide Quality Control Revenue in Children Products Testing and Certification Business (2020-2025) & (US$ Million)
Table 65. Worldwide Quality Control Recent Development
Table 66. UL Solutions Company Details
Table 67. UL Solutions Business Overview
Table 68. UL Solutions Children Products Testing and Certification Product
Table 69. UL Solutions Revenue in Children Products Testing and Certification Business (2020-2025) & (US$ Million)
Table 70. UL Solutions Recent Development
Table 71. Intertek Company Details
Table 72. Intertek Business Overview
Table 73. Intertek Children Products Testing and Certification Product
Table 74. Intertek Revenue in Children Products Testing and Certification Business (2020-2025) & (US$ Million)
Table 75. Intertek Recent Development
Table 76. AM Testing and Services Company Details
Table 77. AM Testing and Services Business Overview
Table 78. AM Testing and Services Children Products Testing and Certification Product
Table 79. AM Testing and Services Revenue in Children Products Testing and Certification Business (2020-2025) & (US$ Million)
Table 80. AM Testing and Services Recent Development
Table 81. STC Group Company Details
Table 82. STC Group Business Overview
Table 83. STC Group Children Products Testing and Certification Product
Table 84. STC Group Revenue in Children Products Testing and Certification Business (2020-2025) & (US$ Million)
Table 85. STC Group Recent Development
Table 86. SGS Institut Fresenius Company Details
Table 87. SGS Institut Fresenius Business Overview
Table 88. SGS Institut Fresenius Children Products Testing and Certification Product
Table 89. SGS Institut Fresenius Revenue in Children Products Testing and Certification Business (2020-2025) & (US$ Million)
Table 90. SGS Institut Fresenius Recent Development
Table 91. HQTS Company Details
Table 92. HQTS Business Overview
Table 93. HQTS Children Products Testing and Certification Product
Table 94. HQTS Revenue in Children Products Testing and Certification Business (2020-2025) & (US$ Million)
Table 95. HQTS Recent Development
Table 96. Centre Testing International Company Details
Table 97. Centre Testing International Business Overview
Table 98. Centre Testing International Children Products Testing and Certification Product
Table 99. Centre Testing International Revenue in Children Products Testing and Certification Business (2020-2025) & (US$ Million)
Table 100. Centre Testing International Recent Development
Table 101. CTT Lab Company Details
Table 102. CTT Lab Business Overview
Table 103. CTT Lab Children Products Testing and Certification Product
Table 104. CTT Lab Revenue in Children Products Testing and Certification Business (2020-2025) & (US$ Million)
Table 105. CTT Lab Recent Development
Table 106. Bureau Veritas Company Details
Table 107. Bureau Veritas Business Overview
Table 108. Bureau Veritas Children Products Testing and Certification Product
Table 109. Bureau Veritas Revenue in Children Products Testing and Certification Business (2020-2025) & (US$ Million)
Table 110. Bureau Veritas Recent Development
Table 111. QIMA Company Details
Table 112. QIMA Business Overview
Table 113. QIMA Children Products Testing and Certification Product
Table 114. QIMA Revenue in Children Products Testing and Certification Business (2020-2025) & (US$ Million)
Table 115. QIMA Recent Development
Table 116. Applied Technical Services Company Details
Table 117. Applied Technical Services Business Overview
Table 118. Applied Technical Services Children Products Testing and Certification Product
Table 119. Applied Technical Services Revenue in Children Products Testing and Certification Business (2020-2025) & (US$ Million)
Table 120. Applied Technical Services Recent Development
Table 121. JJR LAB Company Details
Table 122. JJR LAB Business Overview
Table 123. JJR LAB Children Products Testing and Certification Product
Table 124. JJR LAB Revenue in Children Products Testing and Certification Business (2020-2025) & (US$ Million)
Table 125. JJR LAB Recent Development
Table 126. Shenzhen CCTI Testing Technology Co., Ltd. Company Details
Table 127. Shenzhen CCTI Testing Technology Co., Ltd. Business Overview
Table 128. Shenzhen CCTI Testing Technology Co., Ltd. Children Products Testing and Certification Product
Table 129. Shenzhen CCTI Testing Technology Co., Ltd. Revenue in Children Products Testing and Certification Business (2020-2025) & (US$ Million)
Table 130. Shenzhen CCTI Testing Technology Co., Ltd. Recent Development
Table 131. ASTC Limited Company Details
Table 132. ASTC Limited Business Overview
Table 133. ASTC Limited Children Products Testing and Certification Product
Table 134. ASTC Limited Revenue in Children Products Testing and Certification Business (2020-2025) & (US$ Million)
Table 135. ASTC Limited Recent Development
Table 136. Research Programs/Design for This Report
Table 137. Key Data Information from Secondary Sources
Table 138. Key Data Information from Primary Sources
Table 139. Authors List of This Report
List of Figures
Figure 1. Children Products Testing and Certification Picture
Figure 2. Global Children Products Testing and Certification Market Size Comparison by Type (2020-2031) & (US$ Million)
Figure 3. Global Children Products Testing and Certification Market Share by Type: 2024 VS 2031
Figure 4. Mechanical & Physical Testing Features
Figure 5. Flammability Testing Features
Figure 6. Chemical Testing Features
Figure 7. Electrical Safety Testing Features
Figure 8. Age Grading & Labeling Features
Figure 9. Durability & Drop Testing Features
Figure 10. Hygiene & Microbial Testing Features
Figure 11. Others Features
Figure 12. Global Children Products Testing and Certification Market Size by Application (2020-2031) & (US$ Million)
Figure 13. Global Children Products Testing and Certification Market Share by Application: 2024 VS 2031
Figure 14. Infant & Toddler Toys Case Studies
Figure 15. Electronic Toys & Educational Devices Case Studies
Figure 16. Plush & Stuffed Toys Case Studies
Figure 17. Dolls & Action Figures Case Studies
Figure 18. Ride-On Toys & Bicycles Case Studies
Figure 19. Arts & Crafts Materials Case Studies
Figure 20. Toy Vehicles & Playsets Case Studies
Figure 21. Toy Packaging Case Studies
Figure 22. Others Case Studies
Figure 23. Children Products Testing and Certification Report Years Considered
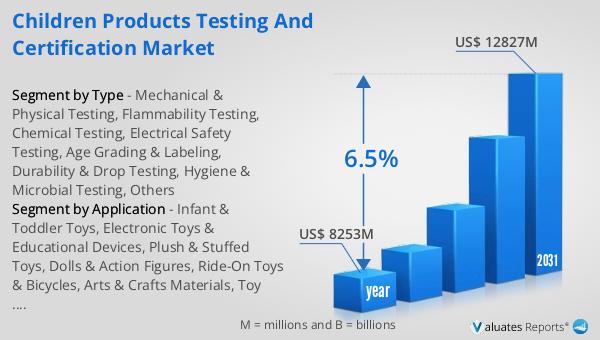
Figure 24. Global Children Products Testing and Certification Market Size (US$ Million), Year-over-Year: 2020-2031
Figure 25. Global Children Products Testing and Certification Market Size, (US$ Million), 2020 VS 2024 VS 2031
Figure 26. Global Children Products Testing and Certification Market Share by Region: 2024 VS 2031
Figure 27. Global Children Products Testing and Certification Market Share by Players in 2024
Figure 28. Global Children Products Testing and Certification Market Share by Company Type (Tier 1, Tier 2, and Tier 3)
Figure 29. The Top 10 and 5 Players Market Share by Children Products Testing and Certification Revenue in 2024
Figure 30. North America Children Products Testing and Certification Market Size YoY Growth (2020-2031) & (US$ Million)
Figure 31. North America Children Products Testing and Certification Market Share by Country (2020-2031)
Figure 32. United States Children Products Testing and Certification Market Size YoY Growth (2020-2031) & (US$ Million)
Figure 33. Canada Children Products Testing and Certification Market Size YoY Growth (2020-2031) & (US$ Million)
Figure 34. Europe Children Products Testing and Certification Market Size YoY Growth (2020-2031) & (US$ Million)
Figure 35. Europe Children Products Testing and Certification Market Share by Country (2020-2031)
Figure 36. Germany Children Products Testing and Certification Market Size YoY Growth (2020-2031) & (US$ Million)
Figure 37. France Children Products Testing and Certification Market Size YoY Growth (2020-2031) & (US$ Million)
Figure 38. U.K. Children Products Testing and Certification Market Size YoY Growth (2020-2031) & (US$ Million)
Figure 39. Italy Children Products Testing and Certification Market Size YoY Growth (2020-2031) & (US$ Million)
Figure 40. Russia Children Products Testing and Certification Market Size YoY Growth (2020-2031) & (US$ Million)
Figure 41. Ireland Children Products Testing and Certification Market Size YoY Growth (2020-2031) & (US$ Million)
Figure 42. Asia-Pacific Children Products Testing and Certification Market Size YoY Growth (2020-2031) & (US$ Million)
Figure 43. Asia-Pacific Children Products Testing and Certification Market Share by Region (2020-2031)
Figure 44. China Children Products Testing and Certification Market Size YoY Growth (2020-2031) & (US$ Million)
Figure 45. Japan Children Products Testing and Certification Market Size YoY Growth (2020-2031) & (US$ Million)
Figure 46. South Korea Children Products Testing and Certification Market Size YoY Growth (2020-2031) & (US$ Million)
Figure 47. Southeast Asia Children Products Testing and Certification Market Size YoY Growth (2020-2031) & (US$ Million)
Figure 48. India Children Products Testing and Certification Market Size YoY Growth (2020-2031) & (US$ Million)
Figure 49. Australia & New Zealand Children Products Testing and Certification Market Size YoY Growth (2020-2031) & (US$ Million)
Figure 50. Latin America Children Products Testing and Certification Market Size YoY Growth (2020-2031) & (US$ Million)
Figure 51. Latin America Children Products Testing and Certification Market Share by Country (2020-2031)
Figure 52. Mexico Children Products Testing and Certification Market Size YoY Growth (2020-2031) & (US$ Million)
Figure 53. Brazil Children Products Testing and Certification Market Size YoY Growth (2020-2031) & (US$ Million)
Figure 54. Middle East & Africa Children Products Testing and Certification Market Size YoY Growth (2020-2031) & (US$ Million)
Figure 55. Middle East & Africa Children Products Testing and Certification Market Share by Country (2020-2031)
Figure 56. Israel Children Products Testing and Certification Market Size YoY Growth (2020-2031) & (US$ Million)
Figure 57. Saudi Arabia Children Products Testing and Certification Market Size YoY Growth (2020-2031) & (US$ Million)
Figure 58. UAE Children Products Testing and Certification Market Size YoY Growth (2020-2031) & (US$ Million)
Figure 59. TÜV SÜD Revenue Growth Rate in Children Products Testing and Certification Business (2020-2025)
Figure 60. Materials Analytical Services Revenue Growth Rate in Children Products Testing and Certification Business (2020-2025)
Figure 61. Worldwide Quality Control Revenue Growth Rate in Children Products Testing and Certification Business (2020-2025)
Figure 62. UL Solutions Revenue Growth Rate in Children Products Testing and Certification Business (2020-2025)
Figure 63. Intertek Revenue Growth Rate in Children Products Testing and Certification Business (2020-2025)
Figure 64. AM Testing and Services Revenue Growth Rate in Children Products Testing and Certification Business (2020-2025)
Figure 65. STC Group Revenue Growth Rate in Children Products Testing and Certification Business (2020-2025)
Figure 66. SGS Institut Fresenius Revenue Growth Rate in Children Products Testing and Certification Business (2020-2025)
Figure 67. HQTS Revenue Growth Rate in Children Products Testing and Certification Business (2020-2025)
Figure 68. Centre Testing International Revenue Growth Rate in Children Products Testing and Certification Business (2020-2025)
Figure 69. CTT Lab Revenue Growth Rate in Children Products Testing and Certification Business (2020-2025)
Figure 70. Bureau Veritas Revenue Growth Rate in Children Products Testing and Certification Business (2020-2025)
Figure 71. QIMA Revenue Growth Rate in Children Products Testing and Certification Business (2020-2025)
Figure 72. Applied Technical Services Revenue Growth Rate in Children Products Testing and Certification Business (2020-2025)
Figure 73. JJR LAB Revenue Growth Rate in Children Products Testing and Certification Business (2020-2025)
Figure 74. Shenzhen CCTI Testing Technology Co., Ltd. Revenue Growth Rate in Children Products Testing and Certification Business (2020-2025)
Figure 75. ASTC Limited Revenue Growth Rate in Children Products Testing and Certification Business (2020-2025)
Figure 76. Bottom-up and Top-down Approaches for This Report
Figure 77. Data Triangulation
Figure 78. Key Executives Interviewed