List of Tables
Table 1. Global Personal E-Mobility Device Market Value Comparison by Type (2024 VS 2031) & (US$ Million)
Table 2. Global Personal E-Mobility Device Market Value by Application (2024 VS 2031) & (US$ Million)
Table 3. Global Personal E-Mobility Device Market Competitive Situation by Manufacturers in 2024
Table 4. Global Personal E-Mobility Device Sales (K Units) of Key Manufacturers (2020-2025)
Table 5. Global Personal E-Mobility Device Sales Market Share by Manufacturers (2020-2025)
Table 6. Global Personal E-Mobility Device Revenue (US$ Million) by Manufacturers (2020-2025)
Table 7. Global Personal E-Mobility Device Revenue Share by Manufacturers (2020-2025)
Table 8. Global Market Personal E-Mobility Device Average Price (USD/Unit) of Key Manufacturers (2020-2025)
Table 9. Global Key Players of Personal E-Mobility Device, Industry Ranking, 2022 VS 2023 VS 2024
Table 10. Global Key Manufacturers of Personal E-Mobility Device, Manufacturing Sites & Headquarters
Table 11. Global Key Manufacturers of Personal E-Mobility Device, Product Type & Application
Table 12. Global Key Manufacturers of Personal E-Mobility Device, Date of Enter into This Industry
Table 13. Global Manufacturers Market Concentration Ratio (CR5 and HHI)
Table 14. Global Personal E-Mobility Device by Company Type (Tier 1, Tier 2, and Tier 3) & (based on the Revenue in Personal E-Mobility Device as of 2024)
Table 15. Manufacturers Mergers & Acquisitions, Expansion Plans
Table 16. Global Personal E-Mobility Device Market Size by Region (US$ Million): 2020 VS 2024 VS 2031
Table 17. Global Personal E-Mobility Device Sales by Region (2020-2025) & (K Units)
Table 18. Global Personal E-Mobility Device Sales Market Share by Region (2020-2025)
Table 19. Global Personal E-Mobility Device Sales by Region (2026-2031) & (K Units)
Table 20. Global Personal E-Mobility Device Sales Market Share by Region (2026-2031)
Table 21. Global Personal E-Mobility Device Revenue by Region (2020-2025) & (US$ Million)
Table 22. Global Personal E-Mobility Device Revenue Market Share by Region (2020-2025)
Table 23. Global Personal E-Mobility Device Revenue by Region (2026-2031) & (US$ Million)
Table 24. Global Personal E-Mobility Device Revenue Market Share by Region (2026-2031)
Table 25. North America Personal E-Mobility Device Revenue by Country: 2020 VS 2024 VS 2031 (US$ Million)
Table 26. North America Personal E-Mobility Device Sales by Country (2020-2025) & (K Units)
Table 27. North America Personal E-Mobility Device Sales by Country (2026-2031) & (K Units)
Table 28. North America Personal E-Mobility Device Revenue by Country (2020-2025) & (US$ Million)
Table 29. North America Personal E-Mobility Device Revenue by Country (2026-2031) & (US$ Million)
Table 30. Europe Personal E-Mobility Device Revenue by Country: 2020 VS 2024 VS 2031 (US$ Million)
Table 31. Europe Personal E-Mobility Device Sales by Country (2020-2025) & (K Units)
Table 32. Europe Personal E-Mobility Device Sales by Country (2026-2031) & (K Units)
Table 33. Europe Personal E-Mobility Device Revenue by Country (2020-2025) & (US$ Million)
Table 34. Europe Personal E-Mobility Device Revenue by Country (2026-2031) & (US$ Million)
Table 35. Asia Pacific Personal E-Mobility Device Revenue by Region: 2020 VS 2024 VS 2031 (US$ Million)
Table 36. Asia Pacific Personal E-Mobility Device Sales by Region (2020-2025) & (K Units)
Table 37. Asia Pacific Personal E-Mobility Device Sales by Region (2026-2031) & (K Units)
Table 38. Asia Pacific Personal E-Mobility Device Revenue by Region (2020-2025) & (US$ Million)
Table 39. Asia Pacific Personal E-Mobility Device Revenue by Region (2026-2031) & (US$ Million)
Table 40. Latin America Personal E-Mobility Device Revenue by Country: 2020 VS 2024 VS 2031 (US$ Million)
Table 41. Latin America Personal E-Mobility Device Sales by Country (2020-2025) & (K Units)
Table 42. Latin America Personal E-Mobility Device Sales by Country (2026-2031) & (K Units)
Table 43. Latin America Personal E-Mobility Device Revenue by Country (2020-2025) & (US$ Million)
Table 44. Latin America Personal E-Mobility Device Revenue by Country (2026-2031) & (US$ Million)
Table 45. Middle East and Africa Personal E-Mobility Device Revenue by Country: 2020 VS 2024 VS 2031 (US$ Million)
Table 46. Middle East and Africa Personal E-Mobility Device Sales by Country (2020-2025) & (K Units)
Table 47. Middle East and Africa Personal E-Mobility Device Sales by Country (2026-2031) & (K Units)
Table 48. Middle East and Africa Personal E-Mobility Device Revenue by Country (2020-2025) & (US$ Million)
Table 49. Middle East and Africa Personal E-Mobility Device Revenue by Country (2026-2031) & (US$ Million)
Table 50. Global Personal E-Mobility Device Sales (K Units) by Type (2020-2025)
Table 51. Global Personal E-Mobility Device Sales (K Units) by Type (2026-2031)
Table 52. Global Personal E-Mobility Device Sales Market Share by Type (2020-2025)
Table 53. Global Personal E-Mobility Device Sales Market Share by Type (2026-2031)
Table 54. Global Personal E-Mobility Device Revenue (US$ Million) by Type (2020-2025)
Table 55. Global Personal E-Mobility Device Revenue (US$ Million) by Type (2026-2031)
Table 56. Global Personal E-Mobility Device Revenue Market Share by Type (2020-2025)
Table 57. Global Personal E-Mobility Device Revenue Market Share by Type (2026-2031)
Table 58. Global Personal E-Mobility Device Price (USD/Unit) by Type (2020-2025)
Table 59. Global Personal E-Mobility Device Price (USD/Unit) by Type (2026-2031)
Table 60. Global Personal E-Mobility Device Sales (K Units) by Application (2020-2025)
Table 61. Global Personal E-Mobility Device Sales (K Units) by Application (2026-2031)
Table 62. Global Personal E-Mobility Device Sales Market Share by Application (2020-2025)
Table 63. Global Personal E-Mobility Device Sales Market Share by Application (2026-2031)
Table 64. Global Personal E-Mobility Device Revenue (US$ Million) by Application (2020-2025)
Table 65. Global Personal E-Mobility Device Revenue (US$ Million) by Application (2026-2031)
Table 66. Global Personal E-Mobility Device Revenue Market Share by Application (2020-2025)
Table 67. Global Personal E-Mobility Device Revenue Market Share by Application (2026-2031)
Table 68. Global Personal E-Mobility Device Price (USD/Unit) by Application (2020-2025)
Table 69. Global Personal E-Mobility Device Price (USD/Unit) by Application (2026-2031)
Table 70. Inmotion Company Information
Table 71. Inmotion Description and Business Overview
Table 72. Inmotion Personal E-Mobility Device Sales (K Units), Revenue (US$ Million), Price (USD/Unit) and Gross Margin (2020-2025)
Table 73. Inmotion Personal E-Mobility Device Product
Table 74. Inmotion Recent Developments/Updates
Table 75. Segway Inc. Company Information
Table 76. Segway Inc. Description and Business Overview
Table 77. Segway Inc. Personal E-Mobility Device Sales (K Units), Revenue (US$ Million), Price (USD/Unit) and Gross Margin (2020-2025)
Table 78. Segway Inc. Personal E-Mobility Device Product
Table 79. Segway Inc. Recent Developments/Updates
Table 80. Honda Motor Company Information
Table 81. Honda Motor Description and Business Overview
Table 82. Honda Motor Personal E-Mobility Device Sales (K Units), Revenue (US$ Million), Price (USD/Unit) and Gross Margin (2020-2025)
Table 83. Honda Motor Personal E-Mobility Device Product
Table 84. Honda Motor Recent Developments/Updates
Table 85. Inventist Company Information
Table 86. Inventist Description and Business Overview
Table 87. Inventist Personal E-Mobility Device Sales (K Units), Revenue (US$ Million), Price (USD/Unit) and Gross Margin (2020-2025)
Table 88. Inventist Personal E-Mobility Device Product
Table 89. Inventist Recent Developments/Updates
Table 90. Airwheel Company Information
Table 91. Airwheel Description and Business Overview
Table 92. Airwheel Personal E-Mobility Device Sales (K Units), Revenue (US$ Million), Price (USD/Unit) and Gross Margin (2020-2025)
Table 93. Airwheel Personal E-Mobility Device Product
Table 94. Airwheel Recent Developments/Updates
Table 95. T3 Motion Company Information
Table 96. T3 Motion Description and Business Overview
Table 97. T3 Motion Personal E-Mobility Device Sales (K Units), Revenue (US$ Million), Price (USD/Unit) and Gross Margin (2020-2025)
Table 98. T3 Motion Personal E-Mobility Device Product
Table 99. T3 Motion Recent Developments/Updates
Table 100. Razor Company Information
Table 101. Razor Description and Business Overview
Table 102. Razor Personal E-Mobility Device Sales (K Units), Revenue (US$ Million), Price (USD/Unit) and Gross Margin (2020-2025)
Table 103. Razor Personal E-Mobility Device Product
Table 104. Razor Recent Developments/Updates
Table 105. AIMA Company Information
Table 106. AIMA Description and Business Overview
Table 107. AIMA Personal E-Mobility Device Sales (K Units), Revenue (US$ Million), Price (USD/Unit) and Gross Margin (2020-2025)
Table 108. AIMA Personal E-Mobility Device Product
Table 109. AIMA Recent Developments/Updates
Table 110. Yadea Company Information
Table 111. Yadea Description and Business Overview
Table 112. Yadea Personal E-Mobility Device Sales (K Units), Revenue (US$ Million), Price (USD/Unit) and Gross Margin (2020-2025)
Table 113. Yadea Personal E-Mobility Device Product
Table 114. Yadea Recent Developments/Updates
Table 115. Sunra Company Information
Table 116. Sunra Description and Business Overview
Table 117. Sunra Personal E-Mobility Device Sales (K Units), Revenue (US$ Million), Price (USD/Unit) and Gross Margin (2020-2025)
Table 118. Sunra Personal E-Mobility Device Product
Table 119. Sunra Recent Developments/Updates
Table 120. Incalcu Company Information
Table 121. Incalcu Description and Business Overview
Table 122. Incalcu Personal E-Mobility Device Sales (K Units), Revenue (US$ Million), Price (USD/Unit) and Gross Margin (2020-2025)
Table 123. Incalcu Personal E-Mobility Device Product
Table 124. Incalcu Recent Developments/Updates
Table 125. Lima Company Information
Table 126. Lima Description and Business Overview
Table 127. Lima Personal E-Mobility Device Sales (K Units), Revenue (US$ Million), Price (USD/Unit) and Gross Margin (2020-2025)
Table 128. Lima Personal E-Mobility Device Product
Table 129. Lima Recent Developments/Updates
Table 130. BYVIN Company Information
Table 131. BYVIN Description and Business Overview
Table 132. BYVIN Personal E-Mobility Device Sales (K Units), Revenue (US$ Million), Price (USD/Unit) and Gross Margin (2020-2025)
Table 133. BYVIN Personal E-Mobility Device Product
Table 134. BYVIN Recent Developments/Updates
Table 135. Lvyuan Company Information
Table 136. Lvyuan Description and Business Overview
Table 137. Lvyuan Personal E-Mobility Device Sales (K Units), Revenue (US$ Million), Price (USD/Unit) and Gross Margin (2020-2025)
Table 138. Lvyuan Personal E-Mobility Device Product
Table 139. Lvyuan Recent Developments/Updates
Table 140. TAILG Company Information
Table 141. TAILG Description and Business Overview
Table 142. TAILG Personal E-Mobility Device Sales (K Units), Revenue (US$ Million), Price (USD/Unit) and Gross Margin (2020-2025)
Table 143. TAILG Personal E-Mobility Device Product
Table 144. TAILG Recent Developments/Updates
Table 145. Supaq Company Information
Table 146. Supaq Description and Business Overview
Table 147. Supaq Personal E-Mobility Device Sales (K Units), Revenue (US$ Million), Price (USD/Unit) and Gross Margin (2020-2025)
Table 148. Supaq Personal E-Mobility Device Product
Table 149. Supaq Recent Developments/Updates
Table 150. E-TWOW Company Information
Table 151. E-TWOW Description and Business Overview
Table 152. E-TWOW Personal E-Mobility Device Sales (K Units), Revenue (US$ Million), Price (USD/Unit) and Gross Margin (2020-2025)
Table 153. E-TWOW Personal E-Mobility Device Product
Table 154. E-TWOW Recent Developments/Updates
Table 155. EcoReco Company Information
Table 156. EcoReco Description and Business Overview
Table 157. EcoReco Personal E-Mobility Device Sales (K Units), Revenue (US$ Million), Price (USD/Unit) and Gross Margin (2020-2025)
Table 158. EcoReco Personal E-Mobility Device Product
Table 159. EcoReco Recent Developments/Updates
Table 160. Glion Dolly Company Information
Table 161. Glion Dolly Description and Business Overview
Table 162. Glion Dolly Personal E-Mobility Device Sales (K Units), Revenue (US$ Million), Price (USD/Unit) and Gross Margin (2020-2025)
Table 163. Glion Dolly Personal E-Mobility Device Product
Table 164. Glion Dolly Recent Developments/Updates
Table 165. Jetson Company Information
Table 166. Jetson Description and Business Overview
Table 167. Jetson Personal E-Mobility Device Sales (K Units), Revenue (US$ Million), Price (USD/Unit) and Gross Margin (2020-2025)
Table 168. Jetson Personal E-Mobility Device Product
Table 169. Jetson Recent Developments/Updates
Table 170. Xiaomi Company Information
Table 171. Xiaomi Description and Business Overview
Table 172. Xiaomi Personal E-Mobility Device Sales (K Units), Revenue (US$ Million), Price (USD/Unit) and Gross Margin (2020-2025)
Table 173. Xiaomi Personal E-Mobility Device Product
Table 174. Xiaomi Recent Developments/Updates
Table 175. Taotao Company Information
Table 176. Taotao Description and Business Overview
Table 177. Taotao Personal E-Mobility Device Sales (K Units), Revenue (US$ Million), Price (USD/Unit) and Gross Margin (2020-2025)
Table 178. Taotao Personal E-Mobility Device Product
Table 179. Taotao Recent Developments/Updates
Table 180. Kugoo Company Information
Table 181. Kugoo Description and Business Overview
Table 182. Kugoo Personal E-Mobility Device Sales (K Units), Revenue (US$ Million), Price (USD/Unit) and Gross Margin (2020-2025)
Table 183. Kugoo Personal E-Mobility Device Product
Table 184. Kugoo Recent Developments/Updates
Table 185. JOYOR Company Information
Table 186. JOYOR Description and Business Overview
Table 187. JOYOR Personal E-Mobility Device Sales (K Units), Revenue (US$ Million), Price (USD/Unit) and Gross Margin (2020-2025)
Table 188. JOYOR Personal E-Mobility Device Product
Table 189. JOYOR Recent Developments/Updates
Table 190. Joybold Company Information
Table 191. Joybold Description and Business Overview
Table 192. Joybold Personal E-Mobility Device Sales (K Units), Revenue (US$ Million), Price (USD/Unit) and Gross Margin (2020-2025)
Table 193. Joybold Personal E-Mobility Device Product
Table 194. Joybold Recent Developments/Updates
Table 195. Okai Company Information
Table 196. Okai Description and Business Overview
Table 197. Okai Personal E-Mobility Device Sales (K Units), Revenue (US$ Million), Price (USD/Unit) and Gross Margin (2020-2025)
Table 198. Okai Personal E-Mobility Device Product
Table 199. Okai Recent Developments/Updates
Table 200. Onewheel Company Information
Table 201. Onewheel Description and Business Overview
Table 202. Onewheel Personal E-Mobility Device Sales (K Units), Revenue (US$ Million), Price (USD/Unit) and Gross Margin (2020-2025)
Table 203. Onewheel Personal E-Mobility Device Product
Table 204. Onewheel Recent Developments/Updates
Table 205. BOXX Corp. Company Information
Table 206. BOXX Corp. Description and Business Overview
Table 207. BOXX Corp. Personal E-Mobility Device Sales (K Units), Revenue (US$ Million), Price (USD/Unit) and Gross Margin (2020-2025)
Table 208. BOXX Corp. Personal E-Mobility Device Product
Table 209. BOXX Corp. Recent Developments/Updates
Table 210. Hangzhou CHIC Intelligent Company Information
Table 211. Hangzhou CHIC Intelligent Description and Business Overview
Table 212. Hangzhou CHIC Intelligent Personal E-Mobility Device Sales (K Units), Revenue (US$ Million), Price (USD/Unit) and Gross Margin (2020-2025)
Table 213. Hangzhou CHIC Intelligent Personal E-Mobility Device Product
Table 214. Hangzhou CHIC Intelligent Recent Developments/Updates
Table 215. Kingsong Company Information
Table 216. Kingsong Description and Business Overview
Table 217. Kingsong Personal E-Mobility Device Sales (K Units), Revenue (US$ Million), Price (USD/Unit) and Gross Margin (2020-2025)
Table 218. Kingsong Personal E-Mobility Device Product
Table 219. Kingsong Recent Developments/Updates
Table 220. Inmotion Company Information
Table 221. Inmotion Description and Business Overview
Table 222. Inmotion Personal E-Mobility Device Sales (K Units), Revenue (US$ Million), Price (USD/Unit) and Gross Margin (2020-2025)
Table 223. Inmotion Personal E-Mobility Device Product
Table 224. Inmotion Recent Developments/Updates
Table 225. Segway Inc. Company Information
Table 226. Segway Inc. Description and Business Overview
Table 227. Segway Inc. Personal E-Mobility Device Sales (K Units), Revenue (US$ Million), Price (USD/Unit) and Gross Margin (2020-2025)
Table 228. Segway Inc. Personal E-Mobility Device Product
Table 229. Segway Inc. Recent Developments/Updates
Table 230. Honda Motor Company Information
Table 231. Honda Motor Description and Business Overview
Table 232. Honda Motor Personal E-Mobility Device Sales (K Units), Revenue (US$ Million), Price (USD/Unit) and Gross Margin (2020-2025)
Table 233. Honda Motor Personal E-Mobility Device Product
Table 234. Honda Motor Recent Developments/Updates
Table 235. Inventist Company Information
Table 236. Inventist Description and Business Overview
Table 237. Inventist Personal E-Mobility Device Sales (K Units), Revenue (US$ Million), Price (USD/Unit) and Gross Margin (2020-2025)
Table 238. Inventist Personal E-Mobility Device Product
Table 239. Inventist Recent Developments/Updates
Table 240. Airwheel Company Information
Table 241. Airwheel Description and Business Overview
Table 242. Airwheel Personal E-Mobility Device Sales (K Units), Revenue (US$ Million), Price (USD/Unit) and Gross Margin (2020-2025)
Table 243. Airwheel Personal E-Mobility Device Product
Table 244. Airwheel Recent Developments/Updates
Table 245. T3 Motion Company Information
Table 246. T3 Motion Description and Business Overview
Table 247. T3 Motion Personal E-Mobility Device Sales (K Units), Revenue (US$ Million), Price (USD/Unit) and Gross Margin (2020-2025)
Table 248. T3 Motion Personal E-Mobility Device Product
Table 249. T3 Motion Recent Developments/Updates
Table 250. Razor Company Information
Table 251. Razor Description and Business Overview
Table 252. Razor Personal E-Mobility Device Sales (K Units), Revenue (US$ Million), Price (USD/Unit) and Gross Margin (2020-2025)
Table 253. Razor Personal E-Mobility Device Product
Table 254. Razor Recent Developments/Updates
Table 255. AIMA Company Information
Table 256. AIMA Description and Business Overview
Table 257. AIMA Personal E-Mobility Device Sales (K Units), Revenue (US$ Million), Price (USD/Unit) and Gross Margin (2020-2025)
Table 258. AIMA Personal E-Mobility Device Product
Table 259. AIMA Recent Developments/Updates
Table 260. Yadea Company Information
Table 261. Yadea Description and Business Overview
Table 262. Yadea Personal E-Mobility Device Sales (K Units), Revenue (US$ Million), Price (USD/Unit) and Gross Margin (2020-2025)
Table 263. Yadea Personal E-Mobility Device Product
Table 264. Yadea Recent Developments/Updates
Table 265. Sunra Company Information
Table 266. Sunra Description and Business Overview
Table 267. Sunra Personal E-Mobility Device Sales (K Units), Revenue (US$ Million), Price (USD/Unit) and Gross Margin (2020-2025)
Table 268. Sunra Personal E-Mobility Device Product
Table 269. Sunra Recent Developments/Updates
Table 270. Key Raw Materials Lists
Table 271. Raw Materials Key Suppliers Lists
Table 272. Personal E-Mobility Device Distributors List
Table 273. Personal E-Mobility Device Customers List
Table 274. Personal E-Mobility Device Market Trends
Table 275. Personal E-Mobility Device Market Drivers
Table 276. Personal E-Mobility Device Market Challenges
Table 277. Personal E-Mobility Device Market Restraints
Table 278. Research Programs/Design for This Report
Table 279. Key Data Information from Secondary Sources
Table 280. Key Data Information from Primary Sources
Table 281. Authors List of This Report
List of Figures
Figure 1. Product Picture of Personal E-Mobility Device
Figure 2. Global Personal E-Mobility Device Market Value Comparison by Type (2020-2031) & (US$ Million)
Figure 3. Global Personal E-Mobility Device Market Share by Type: 2024 & 2031
Figure 4. Electric Bike Product Picture
Figure 5. Electric Scooter Product Picture
Figure 6. Electric Hoverboard Product Picture
Figure 7. Electric Unicycle Product Picture
Figure 8. Electric 4 Wheel Bicycle Product Picture
Figure 9. Others Product Picture
Figure 10. Electric Bike Product Picture
Figure 11. Electric Scooter Product Picture
Figure 12. Electric Hoverboard Product Picture
Figure 13. Global Personal E-Mobility Device Market Value by Application (2020-2031) & (US$ Million)
Figure 14. Global Personal E-Mobility Device Market Share by Application: 2024 & 2031
Figure 15. Personal Use
Figure 16. Shared
Figure 17. Personal Use
Figure 18. Shared
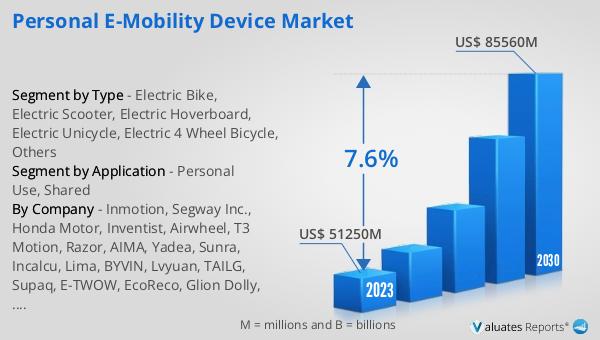
Figure 19. Global Personal E-Mobility Device Revenue, (US$ Million), 2020 VS 2024 VS 2031
Figure 20. Global Personal E-Mobility Device Market Size (2020-2031) & (US$ Million)
Figure 21. Global Personal E-Mobility Device Sales (2020-2031) & (K Units)
Figure 22. Global Personal E-Mobility Device Average Price (USD/Unit) & (2020-2031)
Figure 23. Personal E-Mobility Device Report Years Considered
Figure 24. Personal E-Mobility Device Sales Share by Manufacturers in 2024
Figure 25. Global Personal E-Mobility Device Revenue Share by Manufacturers in 2024
Figure 26. Global 5 and 10 Largest Personal E-Mobility Device Players: Market Share by Revenue in Personal E-Mobility Device in 2024
Figure 27. Personal E-Mobility Device Market Share by Company Type (Tier 1, Tier 2, and Tier 3): 2020 VS 2024
Figure 28. Global Personal E-Mobility Device Market Size by Region (US$ Million): 2020 VS 2024 VS 2031
Figure 29. North America Personal E-Mobility Device Sales Market Share by Country (2020-2031)
Figure 30. North America Personal E-Mobility Device Revenue Market Share by Country (2020-2031)
Figure 31. United States Personal E-Mobility Device Revenue Growth Rate (2020-2031) & (US$ Million)
Figure 32. Canada Personal E-Mobility Device Revenue Growth Rate (2020-2031) & (US$ Million)
Figure 33. United States Personal E-Mobility Device Revenue Growth Rate (2020-2031) & (US$ Million)
Figure 34. Europe Personal E-Mobility Device Sales Market Share by Country (2020-2031)
Figure 35. Europe Personal E-Mobility Device Revenue Market Share by Country (2020-2031)
Figure 36. Germany Personal E-Mobility Device Revenue Growth Rate (2020-2031) & (US$ Million)
Figure 37. France Personal E-Mobility Device Revenue Growth Rate (2020-2031) & (US$ Million)
Figure 38. U.K. Personal E-Mobility Device Revenue Growth Rate (2020-2031) & (US$ Million)
Figure 39. Italy Personal E-Mobility Device Revenue Growth Rate (2020-2031) & (US$ Million)
Figure 40. Russia Personal E-Mobility Device Revenue Growth Rate (2020-2031) & (US$ Million)
Figure 41. Germany Personal E-Mobility Device Revenue Growth Rate (2020-2031) & (US$ Million)
Figure 42. France Personal E-Mobility Device Revenue Growth Rate (2020-2031) & (US$ Million)
Figure 43. U.K. Personal E-Mobility Device Revenue Growth Rate (2020-2031) & (US$ Million)
Figure 44. Italy Personal E-Mobility Device Revenue Growth Rate (2020-2031) & (US$ Million)
Figure 45. Russia Personal E-Mobility Device Revenue Growth Rate (2020-2031) & (US$ Million)
Figure 46. Asia Pacific Personal E-Mobility Device Sales Market Share by Region (2020-2031)
Figure 47. Asia Pacific Personal E-Mobility Device Revenue Market Share by Region (2020-2031)
Figure 48. China Personal E-Mobility Device Revenue Growth Rate (2020-2031) & (US$ Million)
Figure 49. Japan Personal E-Mobility Device Revenue Growth Rate (2020-2031) & (US$ Million)
Figure 50. South Korea Personal E-Mobility Device Revenue Growth Rate (2020-2031) & (US$ Million)
Figure 51. India Personal E-Mobility Device Revenue Growth Rate (2020-2031) & (US$ Million)
Figure 52. Australia Personal E-Mobility Device Revenue Growth Rate (2020-2031) & (US$ Million)
Figure 53. China Taiwan Personal E-Mobility Device Revenue Growth Rate (2020-2031) & (US$ Million)
Figure 54. Indonesia Personal E-Mobility Device Revenue Growth Rate (2020-2031) & (US$ Million)
Figure 55. Thailand Personal E-Mobility Device Revenue Growth Rate (2020-2031) & (US$ Million)
Figure 56. Malaysia Personal E-Mobility Device Revenue Growth Rate (2020-2031) & (US$ Million)
Figure 57. China Personal E-Mobility Device Revenue Growth Rate (2020-2031) & (US$ Million)
Figure 58. Latin America Personal E-Mobility Device Sales Market Share by Country (2020-2031)
Figure 59. Latin America Personal E-Mobility Device Revenue Market Share by Country (2020-2031)
Figure 60. Mexico Personal E-Mobility Device Revenue Growth Rate (2020-2031) & (US$ Million)
Figure 61. Brazil Personal E-Mobility Device Revenue Growth Rate (2020-2031) & (US$ Million)
Figure 62. Argentina Personal E-Mobility Device Revenue Growth Rate (2020-2031) & (US$ Million)
Figure 63. Mexico Personal E-Mobility Device Revenue Growth Rate (2020-2031) & (US$ Million)
Figure 64. Brazil Personal E-Mobility Device Revenue Growth Rate (2020-2031) & (US$ Million)
Figure 65. Argentina Personal E-Mobility Device Revenue Growth Rate (2020-2031) & (US$ Million)
Figure 66. Middle East and Africa Personal E-Mobility Device Sales Market Share by Country (2020-2031)
Figure 67. Middle East and Africa Personal E-Mobility Device Revenue Market Share by Country (2020-2031)
Figure 68. Turkey Personal E-Mobility Device Revenue Growth Rate (2020-2031) & (US$ Million)
Figure 69. Saudi Arabia Personal E-Mobility Device Revenue Growth Rate (2020-2031) & (US$ Million)
Figure 70. UAE Personal E-Mobility Device Revenue Growth Rate (2020-2031) & (US$ Million)
Figure 71. Turkey Personal E-Mobility Device Revenue Growth Rate (2020-2031) & (US$ Million)
Figure 72. Saudi Arabia Personal E-Mobility Device Revenue Growth Rate (2020-2031) & (US$ Million)
Figure 73. UAE Personal E-Mobility Device Revenue Growth Rate (2020-2031) & (US$ Million)
Figure 74. Global Sales Market Share of Personal E-Mobility Device by Type (2020-2031)
Figure 75. Global Revenue Market Share of Personal E-Mobility Device by Type (2020-2031)
Figure 76. Global Personal E-Mobility Device Price (USD/Unit) by Type (2020-2031)
Figure 77. Global Sales Market Share of Personal E-Mobility Device by Application (2020-2031)
Figure 78. Global Revenue Market Share of Personal E-Mobility Device by Application (2020-2031)
Figure 79. Global Personal E-Mobility Device Price (USD/Unit) by Application (2020-2031)
Figure 80. Personal E-Mobility Device Value Chain
Figure 81. Channels of Distribution (Direct Vs Distribution)
Figure 82. Bottom-up and Top-down Approaches for This Report
Figure 83. Data Triangulation
Figure 84. Key Executives Interviewed