List of Tables
Table 1. Industrial Polyethyleneimine CAGR in Value, India VS Global, 2018 VS 2022 VS 2029
Table 2. Industrial Polyethyleneimine Market Trends
Table 3. Industrial Polyethyleneimine Market Drivers
Table 4. Industrial Polyethyleneimine Market Challenges
Table 5. Industrial Polyethyleneimine Market Restraints
Table 6. Global Industrial Polyethyleneimine Sales Growth Rate (CAGR) by Type: 2018 VS 2022 VS 2029 (US$ Million)
Table 7. India Industrial Polyethyleneimine Sales Growth Rate (CAGR) by Type: 2018 VS 2022 VS 2029 (US$ Million)
Table 8. Global Industrial Polyethyleneimine Sales Growth Rate (CAGR) by Application: 2018 VS 2022 VS 2029 (US$ Million)
Table 9. India Industrial Polyethyleneimine Sales Growth Rate (CAGR) by Application: 2018 VS 2022 VS 2029 (US$ Million)
Table 10. Global Key Manufacturers of Industrial Polyethyleneimine, Ranked by Revenue (2022) & (US$ Million)
Table 11. Global Industrial Polyethyleneimine Revenue by Manufacturer, (US$ Million), 2018-2023
Table 12. Global Industrial Polyethyleneimine Revenue Share by Manufacturer, 2018-2023
Table 13. Global Industrial Polyethyleneimine Sales by Manufacturer, (MT), 2018-2023
Table 14. Global Industrial Polyethyleneimine Sales Share by Manufacturer, 2018-2023
Table 15. Global Industrial Polyethyleneimine Price by Manufacturer (2018-2023) & (US$/MT)
Table 16. Global Industrial Polyethyleneimine Manufacturers Market Concentration Ratio (CR5 and HHI)
Table 17. Global Industrial Polyethyleneimine by Company Type (Tier 1, Tier 2, and Tier 3) & (based on the Revenue in Industrial Polyethyleneimine as of 2022)
Table 18. Global Key Manufacturers of Industrial Polyethyleneimine, Manufacturing Base Distribution and Headquarters
Table 19. Global Key Manufacturers of Industrial Polyethyleneimine, Product Offered and Application
Table 20. Global Key Manufacturers of Industrial Polyethyleneimine, Date of Enter into This Industry
Table 21. Manufacturers Mergers & Acquisitions, Expansion Plans
Table 22. Key Players of Industrial Polyethyleneimine in India, Ranked by Revenue (2022) & (US$ million)
Table 23. India Industrial Polyethyleneimine Revenue by Players, (US$ Million), (2018-2023)
Table 24. India Industrial Polyethyleneimine Revenue Share by Players, (2018-2023)
Table 25. India Industrial Polyethyleneimine Sales by Players, (MT), (2018-2023)
Table 26. India Industrial Polyethyleneimine Sales Share by Players, (2018-2023)
Table 27. Global Industrial Polyethyleneimine Market Size Growth Rate (CAGR) by Region (US$ Million): 2018 VS 2022 VS 2029
Table 28. Global Industrial Polyethyleneimine Sales in Volume by Region (2018-2023) & (MT)
Table 29. Global Industrial Polyethyleneimine Sales in Volume Forecast by Region (2024-2029) & (MT)
Table 30. Global Industrial Polyethyleneimine Sales in Value by Region (2018-2023) & (US$ Million)
Table 31. Global Industrial Polyethyleneimine Sales in Value Forecast by Region (2024-2029) & (US$ Million)
Table 32. Americas Industrial Polyethyleneimine Market Size Growth Rate (CAGR) by Country (US$ Million): 2018 VS 2022 VS 2029
Table 33. Americas Industrial Polyethyleneimine Sales in Value by Country (2018-2023) & (US$ Million)
Table 34. Americas Industrial Polyethyleneimine Sales in Value by Country (2024-2029) & (US$ Million)
Table 35. Americas Industrial Polyethyleneimine Sales in Volume by Country (2018-2023) & (MT)
Table 36. Americas Industrial Polyethyleneimine Sales in Volume by Country (2024-2029) & (MT)
Table 37. EMEA Industrial Polyethyleneimine Market Size Growth Rate (CAGR) by Country (US$ Million): 2018 VS 2022 VS 2029
Table 38. EMEA Industrial Polyethyleneimine Sales in Value by Country (2018-2023) & (US$ Million)
Table 39. EMEA Industrial Polyethyleneimine Sales in Value by Country (2024-2029) & (US$ Million)
Table 40. EMEA Industrial Polyethyleneimine Sales in Volume by Country (2018-2023) & (MT)
Table 41. EMEA Industrial Polyethyleneimine Sales in Volume by Country (2024-2029) & (MT)
Table 42. APAC Industrial Polyethyleneimine Market Size Growth Rate (CAGR) by Country (US$ Million): 2018 VS 2022 VS 2029
Table 43. APAC Industrial Polyethyleneimine Sales in Value by Country (2018-2023) & (US$ Million)
Table 44. APAC Industrial Polyethyleneimine Sales in Value by Country (2024-2029) & (US$ Million)
Table 45. APAC Industrial Polyethyleneimine Sales in Volume by Country (2018-2023) & (MT)
Table 46. APAC Industrial Polyethyleneimine Sales in Volume by Country (2024-2029) & (MT)
Table 47. BASF Company Information
Table 48. BASF Description and Business Overview
Table 49. BASF Industrial Polyethyleneimine Sales (MT), Revenue (US$ Million), Price (US$/MT) and Gross Margin (2018-2023)
Table 50. BASF Industrial Polyethyleneimine Product
Table 51. BASF Recent Development
Table 52. NIPPON SHOKUBAI Company Information
Table 53. NIPPON SHOKUBAI Description and Business Overview
Table 54. NIPPON SHOKUBAI Industrial Polyethyleneimine Sales (MT), Revenue (US$ Million), Price (US$/MT) and Gross Margin (2018-2023)
Table 55. NIPPON SHOKUBAI Industrial Polyethyleneimine Product
Table 56. NIPPON SHOKUBAI Recent Development
Table 57. Wuhan Qianglong New Chemical Materials Corporation Company Information
Table 58. Wuhan Qianglong New Chemical Materials Corporation Description and Business Overview
Table 59. Wuhan Qianglong New Chemical Materials Corporation Industrial Polyethyleneimine Sales (MT), Revenue (US$ Million), Price (US$/MT) and Gross Margin (2018-2023)
Table 60. Wuhan Qianglong New Chemical Materials Corporation Industrial Polyethyleneimine Product
Table 61. Wuhan Qianglong New Chemical Materials Corporation Recent Development
Table 62. Shanghai Gobekie Company Information
Table 63. Shanghai Gobekie Description and Business Overview
Table 64. Shanghai Gobekie Industrial Polyethyleneimine Sales (MT), Revenue (US$ Million), Price (US$/MT) and Gross Margin (2018-2023)
Table 65. Shanghai Gobekie Industrial Polyethyleneimine Product
Table 66. Shanghai Gobekie Recent Development
Table 67. Key Raw Materials Lists
Table 68. Raw Materials Key Suppliers Lists
Table 69. Industrial Polyethyleneimine Customers List
Table 70. Industrial Polyethyleneimine Distributors List
Table 71. Research Programs/Design for This Report
Table 72. Key Data Information from Secondary Sources
Table 73. Key Data Information from Primary Sources
List of Figures
Figure 1. Industrial Polyethyleneimine Product Picture
Figure 2. Global Industrial Polyethyleneimine Revenue, (US$ Million), 2018 VS 2022 VS 2029
Figure 3. Global Industrial Polyethyleneimine Market Size 2018-2029 (US$ Million)
Figure 4. Global Industrial Polyethyleneimine Sales 2018-2029 (MT)
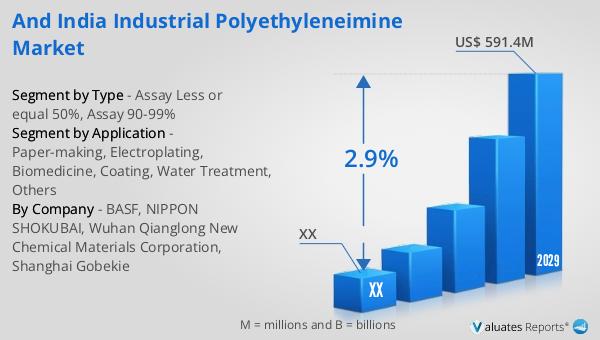
Figure 5. India Industrial Polyethyleneimine Revenue, (US$ Million), 2018 VS 2022 VS 2029
Figure 6. India Industrial Polyethyleneimine Market Size 2018-2029 (US$ Million)
Figure 7. India Industrial Polyethyleneimine Sales 2018-2029 (MT)
Figure 8. India Industrial Polyethyleneimine Market Share in Global, in Value (US$ Million) 2018-2029
Figure 9. India Industrial Polyethyleneimine Market Share in Global, in Volume (MT) 2018-2029
Figure 10. Industrial Polyethyleneimine Report Years Considered
Figure 11. Product Picture of Assay Less or equal 50%
Figure 12. Product Picture of Assay 90-99%
Figure 13. Global Industrial Polyethyleneimine Market Share by Type in 2022 & 2029
Figure 14. Global Industrial Polyethyleneimine Sales in Value by Type (2018-2029) & (US$ Million)
Figure 15. Global Industrial Polyethyleneimine Sales Market Share in Value by Type (2018-2029)
Figure 16. Global Industrial Polyethyleneimine Sales by Type (2018-2029) & (MT)
Figure 17. Global Industrial Polyethyleneimine Sales Market Share in Volume by Type (2018-2029)
Figure 18. Global Industrial Polyethyleneimine Price by Type (2018-2029) & (US$/MT)
Figure 19. India Industrial Polyethyleneimine Market Share by Type in 2022 & 2029
Figure 20. India Industrial Polyethyleneimine Sales in Value by Type (2018-2029) & (US$ Million)
Figure 21. India Industrial Polyethyleneimine Sales Market Share in Value by Type (2018-2029)
Figure 22. India Industrial Polyethyleneimine Sales by Type (2018-2029) & (MT)
Figure 23. India Industrial Polyethyleneimine Sales Market Share in Volume by Type (2018-2029)
Figure 24. India Industrial Polyethyleneimine Price by Type (2018-2029) & (US$/MT)
Figure 25. Product Picture of Paper-making
Figure 26. Product Picture of Electroplating
Figure 27. Product Picture of Biomedicine
Figure 28. Product Picture of Coating
Figure 29. Product Picture of Water Treatment
Figure 30. Product Picture of Others
Figure 31. Global Industrial Polyethyleneimine Market Share by Application in 2022 & 2029
Figure 32. Global Industrial Polyethyleneimine Sales in Value by Application (2018-2029) & (US$ Million)
Figure 33. Global Industrial Polyethyleneimine Sales Market Share in Value by Application (2018-2029)
Figure 34. Global Industrial Polyethyleneimine Sales by Application (2018-2029) & (MT)
Figure 35. Global Industrial Polyethyleneimine Sales Market Share in Volume by Application (2018-2029)
Figure 36. Global Industrial Polyethyleneimine Price by Application (2018-2029) & (US$/MT)
Figure 37. India Industrial Polyethyleneimine Market Share by Application in 2022 & 2029
Figure 38. India Industrial Polyethyleneimine Sales in Value by Application (2018-2029) & (US$ Million)
Figure 39. India Industrial Polyethyleneimine Sales Market Share in Value by Application (2018-2029)
Figure 40. India Industrial Polyethyleneimine Sales by Application (2018-2029) & (MT)
Figure 41. India Industrial Polyethyleneimine Sales Market Share in Volume by Application (2018-2029)
Figure 42. India Industrial Polyethyleneimine Price by Application (2018-2029) & (US$/MT)
Figure 43. Americas Industrial Polyethyleneimine Sales in Volume Growth Rate 2018-2029 (MT)
Figure 44. Americas Industrial Polyethyleneimine Sales in Value Growth Rate 2018-2029 (US$ Million)
Figure 45. Americas Industrial Polyethyleneimine Sales by Type (2018-2029) & (MT)
Figure 46. Americas Industrial Polyethyleneimine Sales Market Share in Volume by Type (2018-2029)
Figure 47. Americas Industrial Polyethyleneimine Sales by Application (2018-2029) & (MT)
Figure 48. Americas Industrial Polyethyleneimine Sales Market Share in Volume by Application (2018-2029)
Figure 49. United States Industrial Polyethyleneimine Sales in Value Growth Rate (2018-2029) & (US$ Million)
Figure 50. Canada Industrial Polyethyleneimine Sales in Value Growth Rate (2018-2029) & (US$ Million)
Figure 51. Mexico Industrial Polyethyleneimine Sales in Value Growth Rate (2018-2029) & (US$ Million)
Figure 52. Brazil Industrial Polyethyleneimine Sales in Value Growth Rate (2018-2029) & (US$ Million)
Figure 53. EMEA Industrial Polyethyleneimine Sales in Volume Growth Rate 2018-2029 (MT)
Figure 54. EMEA Industrial Polyethyleneimine Sales in Value Growth Rate 2018-2029 (US$ Million)
Figure 55. EMEA Industrial Polyethyleneimine Sales by Type (2018-2029) & (MT)
Figure 56. EMEA Industrial Polyethyleneimine Sales Market Share in Volume by Type (2018-2029)
Figure 57. EMEA Industrial Polyethyleneimine Sales by Application (2018-2029) & (MT)
Figure 58. EMEA Industrial Polyethyleneimine Sales Market Share in Volume by Application (2018-2029)
Figure 59. Europe Industrial Polyethyleneimine Sales in Value Growth Rate (2018-2029) & (US$ Million)
Figure 60. Middle East Industrial Polyethyleneimine Sales in Value Growth Rate (2018-2029) & (US$ Million)
Figure 61. Africa Industrial Polyethyleneimine Sales in Value Growth Rate (2018-2029) & (US$ Million)
Figure 62. China Industrial Polyethyleneimine Sales in Volume Growth Rate 2018-2029 (MT)
Figure 63. China Industrial Polyethyleneimine Sales in Value Growth Rate 2018-2029 (US$ Million)
Figure 64. China Industrial Polyethyleneimine Sales by Type (2018-2029) & (MT)
Figure 65. China Industrial Polyethyleneimine Sales Market Share in Volume by Type (2018-2029)
Figure 66. China Industrial Polyethyleneimine Sales by Application (2018-2029) & (MT)
Figure 67. China Industrial Polyethyleneimine Sales Market Share in Volume by Application (2018-2029)
Figure 68. APAC Industrial Polyethyleneimine Sales in Volume Growth Rate 2018-2029 (MT)
Figure 69. APAC Industrial Polyethyleneimine Sales in Value Growth Rate 2018-2029 (US$ Million)
Figure 70. APAC Industrial Polyethyleneimine Sales by Type (2018-2029) & (MT)
Figure 71. APAC Industrial Polyethyleneimine Sales Market Share in Volume by Type (2018-2029)
Figure 72. APAC Industrial Polyethyleneimine Sales by Application (2018-2029) & (MT)
Figure 73. APAC Industrial Polyethyleneimine Sales Market Share in Volume by Application (2018-2029)
Figure 74. Japan Industrial Polyethyleneimine Sales in Value Growth Rate (2018-2029) & (US$ Million)
Figure 75. South Korea Industrial Polyethyleneimine Sales in Value Growth Rate (2018-2029) & (US$ Million)
Figure 76. China Taiwan Industrial Polyethyleneimine Sales in Value Growth Rate (2018-2029) & (US$ Million)
Figure 77. Southeast Asia Industrial Polyethyleneimine Sales in Value Growth Rate (2018-2029) & (US$ Million)
Figure 78. India Industrial Polyethyleneimine Sales in Value Growth Rate (2018-2029) & (US$ Million)
Figure 79. Industrial Polyethyleneimine Value Chain
Figure 80. Industrial Polyethyleneimine Production Process
Figure 81. Channels of Distribution
Figure 82. Distributors Profiles
Figure 83. Bottom-up and Top-down Approaches for This Report
Figure 84. Data Triangulation
Figure 85. Key Executives Interviewed