List of Tables
Table 1. Global 3D Vision Sensor for Embodied Intelligent Robots Market Size Growth Rate by Type (2026-2032) & (US$ Million)
Table 2. Key Players of Based on Multi-Eye Stereo Vision
Table 3. Key Players of Based on iToF
Table 4. Global 3D Vision Sensor for Embodied Intelligent Robots Market Size Growth by Application (2026-2032) & (US$ Million)
Table 5. Global 3D Vision Sensor for Embodied Intelligent Robots Market Size by Region (2026-2032) & (US$ Million)
Table 6. Global 3D Vision Sensor for Embodied Intelligent Robots Market Size by Region (2026-2032) & (US$ Million)
Table 7. Global 3D Vision Sensor for Embodied Intelligent Robots Market Share by Region (2026-2032)
Table 8. Market Top Trends
Table 9. Market Use Cases
Table 10. Global 3D Vision Sensor for Embodied Intelligent Robots Revenue by Players (2026 & 2032) & (US$ Million)
Table 11. Global 3D Vision Sensor for Embodied Intelligent Robots Market Share by Players (2026 & 2032)
Table 12. Key Players Headquarters and Area Served
Table 13. Key Players 3D Vision Sensor for Embodied Intelligent Robots Product/Solution/Service
Table 14. Date of Enter into 3D Vision Sensor for Embodied Intelligent Robots Market
Table 15. Mergers & Acquisitions, Expansion Plans
Table 16. Global 3D Vision Sensor for Embodied Intelligent Robots Market Size by Type (2026-2032) & (US$ Million)
Table 17. Global 3D Vision Sensor for Embodied Intelligent Robots Market Size Share by Type (2026-2032)
Table 18. Global 3D Vision Sensor for Embodied Intelligent Robots Market Size by Application (2026-2032) & (US$ Million)
Table 19. Global 3D Vision Sensor for Embodied Intelligent Robots Market Size Share by Application (2026-2032)
Table 20. North America Key Players 3D Vision Sensor for Embodied Intelligent Robots Revenue (2026 & 2032) & (US$ Million)
Table 21. North America Key Players 3D Vision Sensor for Embodied Intelligent Robots Market Share (2026 & 2032)
Table 22. North America 3D Vision Sensor for Embodied Intelligent Robots Market Size by Type (2026-2032) & (US$ Million)
Table 23. North America 3D Vision Sensor for Embodied Intelligent Robots Market Share by Type (2026-2032)
Table 24. North America 3D Vision Sensor for Embodied Intelligent Robots Market Size by Application (2026-2032) & (US$ Million)
Table 25. North America 3D Vision Sensor for Embodied Intelligent Robots Market Share by Application (2026-2032)
Table 26. Europe Key Players 3D Vision Sensor for Embodied Intelligent Robots Revenue (2026 & 2032) & (US$ Million)
Table 27. Europe Key Players 3D Vision Sensor for Embodied Intelligent Robots Market Share (2026 & 2032)
Table 28. Europe 3D Vision Sensor for Embodied Intelligent Robots Market Size by Type (2026-2032) & (US$ Million)
Table 29. Europe 3D Vision Sensor for Embodied Intelligent Robots Market Share by Type (2026-2032)
Table 30. Europe 3D Vision Sensor for Embodied Intelligent Robots Market Size by Application (2026-2032) & (US$ Million)
Table 31. Europe 3D Vision Sensor for Embodied Intelligent Robots Market Share by Application (2026-2032)
Table 32. China Key Players 3D Vision Sensor for Embodied Intelligent Robots Revenue (2026 & 2032) & (US$ Million)
Table 33. China Key Players 3D Vision Sensor for Embodied Intelligent Robots Market Share (2026 & 2032)
Table 34. China 3D Vision Sensor for Embodied Intelligent Robots Market Size by Type (2026-2032) & (US$ Million)
Table 35. China 3D Vision Sensor for Embodied Intelligent Robots Market Share by Type (2026-2032)
Table 36. China 3D Vision Sensor for Embodied Intelligent Robots Market Size by Application (2026-2032) & (US$ Million)
Table 37. China 3D Vision Sensor for Embodied Intelligent Robots Market Share by Application (2026-2032)
Table 38. Key Players in Japan
Table 39. Cognex (USA) Company Details
Table 40. Cognex (USA) Description and Business Overview
Table 41. Cognex (USA) 3D Vision Sensor for Embodied Intelligent Robots Product
Table 42. Cognex (USA) Revenue in 3D Vision Sensor for Embodied Intelligent Robots Business: 2026 & 2032
Table 43. Cognex (USA) Recent Development
Table 44. Basler (Germany) Company Details
Table 45. Basler (Germany) Description and Business Overview
Table 46. Basler (Germany) 3D Vision Sensor for Embodied Intelligent Robots Product
Table 47. Basler (Germany) Revenue in 3D Vision Sensor for Embodied Intelligent Robots Business: 2026 & 2032
Table 48. Basler (Germany) Recent Development
Table 49. Keyence (Japan) Company Details
Table 50. Keyence (Japan) Description and Business Overview
Table 51. Keyence (Japan) 3D Vision Sensor for Embodied Intelligent Robots Product
Table 52. Keyence (Japan) Revenue in 3D Vision Sensor for Embodied Intelligent Robots Business: 2026 & 2032
Table 53. Keyence (Japan) Recent Development
Table 54. Omron (Japan) Company Details
Table 55. Omron (Japan) Description and Business Overview
Table 56. Omron (Japan) 3D Vision Sensor for Embodied Intelligent Robots Product
Table 57. Omron (Japan) Revenue in 3D Vision Sensor for Embodied Intelligent Robots Business: 2026 & 2032
Table 58. Omron (Japan) Recent Development
Table 59. Obi Zhongguang (China) Company Details
Table 60. Obi Zhongguang (China) Description and Business Overview
Table 61. Obi Zhongguang (China) 3D Vision Sensor for Embodied Intelligent Robots Product
Table 62. Obi Zhongguang (China) Revenue in 3D Vision Sensor for Embodied Intelligent Robots Business: 2026 & 2032
Table 63. Obi Zhongguang (China) Recent Development
Table 64. Weijing Intelligent (China) Company Details
Table 65. Weijing Intelligent (China) Description and Business Overview
Table 66. Weijing Intelligent (China) 3D Vision Sensor for Embodied Intelligent Robots Product
Table 67. Weijing Intelligent (China) Revenue in 3D Vision Sensor for Embodied Intelligent Robots Business: 2026 & 2032
Table 68. Weijing Intelligent (China) Recent Development
Table 69. Distant space and time (China) Company Details
Table 70. Distant space and time (China) Description and Business Overview
Table 71. Distant space and time (China) 3D Vision Sensor for Embodied Intelligent Robots Product
Table 72. Distant space and time (China) Revenue in 3D Vision Sensor for Embodied Intelligent Robots Business: 2026 & 2032
Table 73. Distant space and time (China) Recent Development
Table 74. 3D Vision Sensor for Embodied Intelligent Robots Market Trends
Table 75. 3D Vision Sensor for Embodied Intelligent Robots Market Drivers
Table 76. 3D Vision Sensor for Embodied Intelligent Robots Market Challenges
Table 77. 3D Vision Sensor for Embodied Intelligent Robots Market Restraints
Table 78. Research Programs/Design for This Report
Table 79. Key Data Information from Secondary Sources
Table 80. Key Data Information from Primary Sources
List of Figures
Figure 1. Global 3D Vision Sensor for Embodied Intelligent Robots Market Share by Type in 2026 & 2032
Figure 2. Based on Multi-Eye Stereo Vision Features
Figure 3. Based on iToF Features
Figure 4. Global 3D Vision Sensor for Embodied Intelligent Robots Market Share by Application in 2026 & 2032
Figure 5. Base-Type Robot Case Studies
Figure 6. Wheeled Robot Case Studies
Figure 7. Tracked Robot Case Studies
Figure 8. Quadruped Robot Case Studies
Figure 9. Humanoid Robot Case Studies
Figure 10. Bionic Robot Case Studies
Figure 11. 3D Vision Sensor for Embodied Intelligent Robots Report Years Considered
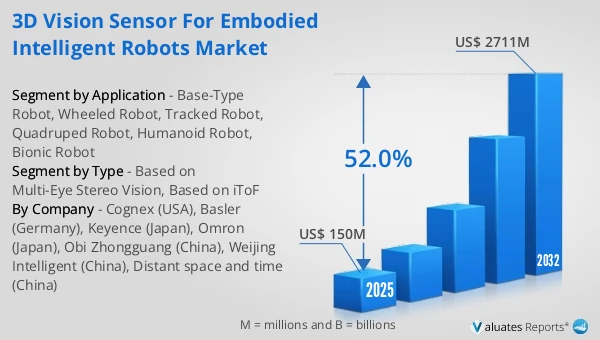
Figure 12. Global 3D Vision Sensor for Embodied Intelligent Robots Market Size and Growth Rate 2026-2032 (US$ Million)
Figure 13. Global 3D Vision Sensor for Embodied Intelligent Robots Market Share by Region (2026-2032)
Figure 14. Global 3D Vision Sensor for Embodied Intelligent Robots Market Size Market Share by Type (2026-2032)
Figure 15. North America 3D Vision Sensor for Embodied Intelligent Robots Market Size 2026-2032 (US$ Million)
Figure 16. Europe 3D Vision Sensor for Embodied Intelligent Robots Market Size 2026-2032 (US$ Million)
Figure 17. China 3D Vision Sensor for Embodied Intelligent Robots Market Size 2026-2032 (US$ Million)
Figure 18. 3D Vision Sensor for Embodied Intelligent Robots Market Size in Japan (2026-2032) & (US$ Million)
Figure 19. Bottom-up and Top-down Approaches for This Report
Figure 20. Data Triangulation
Figure 21. Key Executives Interviewed