List of Tables
Table 1. Global Biopharma Storage Service Market Size Growth Rate by Type (US$ Million): 2020 VS 2024 VS 2031
Table 2. Key Players of Ultra-Low Temperature Cryogenic Storage (-60℃ to -80℃)
Table 3. Key Players of Frozen Storage (-25℃ to -15℃)
Table 4. Key Players of Refrigerated Storage (2℃ to 8℃)
Table 5. Key Players of Ambient/Controlled Room Temperature Storage (15℃ to 25℃)
Table 6. Key Players of Gas-Phase Liquid Nitrogen Storage (Below -150℃)
Table 7. Global Biopharma Storage Service Market Size Growth Rate by Supply Chain (US$ Million): 2020 VS 2024 VS 2031
Table 8. Key Players of Raw Material and Excipient Storage
Table 9. Key Players of Intermediate Product and Raw Material Storage
Table 10. Key Players of Finished Drug and Label/Packaging Storage
Table 11. Key Players of Clinical Trial Drug Storage
Table 12. Key Players of Drug Traceability and Recall Storage
Table 13. Global Biopharma Storage Service Market Size Growth Rate by Compliance (US$ Million): 2020 VS 2024 VS 2031
Table 14. Key Players of GMP Compliant Storage
Table 15. Key Players of GSP Compliant Storage
Table 16. Global Biopharma Storage Service Market Size Growth by Application (US$ Million): 2020 VS 2024 VS 2031
Table 17. Global Biopharma Storage Service Market Size by Region (US$ Million): 2020 VS 2024 VS 2031
Table 18. Global Biopharma Storage Service Market Size by Region (2020-2025) & (US$ Million)
Table 19. Global Biopharma Storage Service Market Share by Region (2020-2025)
Table 20. Global Biopharma Storage Service Forecasted Market Size by Region (2026-2031) & (US$ Million)
Table 21. Global Biopharma Storage Service Market Share by Region (2026-2031)
Table 22. Biopharma Storage Service Market Trends
Table 23. Biopharma Storage Service Market Drivers
Table 24. Biopharma Storage Service Market Challenges
Table 25. Biopharma Storage Service Market Restraints
Table 26. Global Biopharma Storage Service Revenue by Players (2020-2025) & (US$ Million)
Table 27. Global Biopharma Storage Service Market Share by Players (2020-2025)
Table 28. Global Top Biopharma Storage Service Players by Company Type (Tier 1, Tier 2, and Tier 3) & (based on the Revenue in Biopharma Storage Service as of 2024)
Table 29. Ranking of Global Top Biopharma Storage Service Companies by Revenue (US$ Million) in 2024
Table 30. Global 5 Largest Players Market Share by Biopharma Storage Service Revenue (CR5 and HHI) & (2020-2025)
Table 31. Global Key Players of Biopharma Storage Service, Headquarters and Area Served
Table 32. Global Key Players of Biopharma Storage Service, Product and Application
Table 33. Global Key Players of Biopharma Storage Service, Date of Enter into This Industry
Table 34. Mergers & Acquisitions, Expansion Plans
Table 35. Global Biopharma Storage Service Market Size by Type (2020-2025) & (US$ Million)
Table 36. Global Biopharma Storage Service Revenue Market Share by Type (2020-2025)
Table 37. Global Biopharma Storage Service Forecasted Market Size by Type (2026-2031) & (US$ Million)
Table 38. Global Biopharma Storage Service Revenue Market Share by Type (2026-2031)
Table 39. Global Biopharma Storage Service Market Size by Application (2020-2025) & (US$ Million)
Table 40. Global Biopharma Storage Service Revenue Market Share by Application (2020-2025)
Table 41. Global Biopharma Storage Service Forecasted Market Size by Application (2026-2031) & (US$ Million)
Table 42. Global Biopharma Storage Service Revenue Market Share by Application (2026-2031)
Table 43. North America Biopharma Storage Service Market Size Growth Rate by Country (US$ Million): 2020 VS 2024 VS 2031
Table 44. North America Biopharma Storage Service Market Size by Country (2020-2025) & (US$ Million)
Table 45. North America Biopharma Storage Service Market Size by Country (2026-2031) & (US$ Million)
Table 46. Europe Biopharma Storage Service Market Size Growth Rate by Country (US$ Million): 2020 VS 2024 VS 2031
Table 47. Europe Biopharma Storage Service Market Size by Country (2020-2025) & (US$ Million)
Table 48. Europe Biopharma Storage Service Market Size by Country (2026-2031) & (US$ Million)
Table 49. Asia-Pacific Biopharma Storage Service Market Size Growth Rate by Region (US$ Million): 2020 VS 2024 VS 2031
Table 50. Asia-Pacific Biopharma Storage Service Market Size by Region (2020-2025) & (US$ Million)
Table 51. Asia-Pacific Biopharma Storage Service Market Size by Region (2026-2031) & (US$ Million)
Table 52. Latin America Biopharma Storage Service Market Size Growth Rate by Country (US$ Million): 2020 VS 2024 VS 2031
Table 53. Latin America Biopharma Storage Service Market Size by Country (2020-2025) & (US$ Million)
Table 54. Latin America Biopharma Storage Service Market Size by Country (2026-2031) & (US$ Million)
Table 55. Middle East & Africa Biopharma Storage Service Market Size Growth Rate by Country (US$ Million): 2020 VS 2024 VS 2031
Table 56. Middle East & Africa Biopharma Storage Service Market Size by Country (2020-2025) & (US$ Million)
Table 57. Middle East & Africa Biopharma Storage Service Market Size by Country (2026-2031) & (US$ Million)
Table 58. Alcami Company Details
Table 59. Alcami Business Overview
Table 60. Alcami Biopharma Storage Service Product
Table 61. Alcami Revenue in Biopharma Storage Service Business (2020-2025) & (US$ Million)
Table 62. Alcami Recent Development
Table 63. Azenta Life Sciences Company Details
Table 64. Azenta Life Sciences Business Overview
Table 65. Azenta Life Sciences Biopharma Storage Service Product
Table 66. Azenta Life Sciences Revenue in Biopharma Storage Service Business (2020-2025) & (US$ Million)
Table 67. Azenta Life Sciences Recent Development
Table 68. Biopharma Technology LLC Company Details
Table 69. Biopharma Technology LLC Business Overview
Table 70. Biopharma Technology LLC Biopharma Storage Service Product
Table 71. Biopharma Technology LLC Revenue in Biopharma Storage Service Business (2020-2025) & (US$ Million)
Table 72. Biopharma Technology LLC Recent Development
Table 73. Cencora Company Details
Table 74. Cencora Business Overview
Table 75. Cencora Biopharma Storage Service Product
Table 76. Cencora Revenue in Biopharma Storage Service Business (2020-2025) & (US$ Million)
Table 77. Cencora Recent Development
Table 78. Donnegan Systems Company Details
Table 79. Donnegan Systems Business Overview
Table 80. Donnegan Systems Biopharma Storage Service Product
Table 81. Donnegan Systems Revenue in Biopharma Storage Service Business (2020-2025) & (US$ Million)
Table 82. Donnegan Systems Recent Development
Table 83. ExtraVault Company Details
Table 84. ExtraVault Business Overview
Table 85. ExtraVault Biopharma Storage Service Product
Table 86. ExtraVault Revenue in Biopharma Storage Service Business (2020-2025) & (US$ Million)
Table 87. ExtraVault Recent Development
Table 88. GBA Group Company Details
Table 89. GBA Group Business Overview
Table 90. GBA Group Biopharma Storage Service Product
Table 91. GBA Group Revenue in Biopharma Storage Service Business (2020-2025) & (US$ Million)
Table 92. GBA Group Recent Development
Table 93. Patheon pharma services Company Details
Table 94. Patheon pharma services Business Overview
Table 95. Patheon pharma services Biopharma Storage Service Product
Table 96. Patheon pharma services Revenue in Biopharma Storage Service Business (2020-2025) & (US$ Million)
Table 97. Patheon pharma services Recent Development
Table 98. PCI Services Company Details
Table 99. PCI Services Business Overview
Table 100. PCI Services Biopharma Storage Service Product
Table 101. PCI Services Revenue in Biopharma Storage Service Business (2020-2025) & (US$ Million)
Table 102. PCI Services Recent Development
Table 103. Pharmaserv Logistics Company Details
Table 104. Pharmaserv Logistics Business Overview
Table 105. Pharmaserv Logistics Biopharma Storage Service Product
Table 106. Pharmaserv Logistics Revenue in Biopharma Storage Service Business (2020-2025) & (US$ Million)
Table 107. Pharmaserv Logistics Recent Development
Table 108. SciSafe Company Details
Table 109. SciSafe Business Overview
Table 110. SciSafe Biopharma Storage Service Product
Table 111. SciSafe Revenue in Biopharma Storage Service Business (2020-2025) & (US$ Million)
Table 112. SciSafe Recent Development
Table 113. Sentry BioPharma Services Company Details
Table 114. Sentry BioPharma Services Business Overview
Table 115. Sentry BioPharma Services Biopharma Storage Service Product
Table 116. Sentry BioPharma Services Revenue in Biopharma Storage Service Business (2020-2025) & (US$ Million)
Table 117. Sentry BioPharma Services Recent Development
Table 118. Stirling Ultracold Company Details
Table 119. Stirling Ultracold Business Overview
Table 120. Stirling Ultracold Biopharma Storage Service Product
Table 121. Stirling Ultracold Revenue in Biopharma Storage Service Business (2020-2025) & (US$ Million)
Table 122. Stirling Ultracold Recent Development
Table 123. Tobin Scientific Company Details
Table 124. Tobin Scientific Business Overview
Table 125. Tobin Scientific Biopharma Storage Service Product
Table 126. Tobin Scientific Revenue in Biopharma Storage Service Business (2020-2025) & (US$ Million)
Table 127. Tobin Scientific Recent Development
Table 128. Research Programs/Design for This Report
Table 129. Key Data Information from Secondary Sources
Table 130. Key Data Information from Primary Sources
Table 131. Authors List of This Report
List of Figures
Figure 1. Biopharma Storage Service Picture
Figure 2. Global Biopharma Storage Service Market Size Comparison by Type (2020-2031) & (US$ Million)
Figure 3. Global Biopharma Storage Service Market Share by Type: 2024 VS 2031
Figure 4. Ultra-Low Temperature Cryogenic Storage (-60℃ to -80℃) Features
Figure 5. Frozen Storage (-25℃ to -15℃) Features
Figure 6. Refrigerated Storage (2℃ to 8℃) Features
Figure 7. Ambient/Controlled Room Temperature Storage (15℃ to 25℃) Features
Figure 8. Gas-Phase Liquid Nitrogen Storage (Below -150℃) Features
Figure 9. Global Biopharma Storage Service Market Size Comparison by Supply Chain (2020-2031) & (US$ Million)
Figure 10. Raw Material and Excipient Storage Features
Figure 11. Intermediate Product and Raw Material Storage Features
Figure 12. Finished Drug and Label/Packaging Storage Features
Figure 13. Clinical Trial Drug Storage Features
Figure 14. Drug Traceability and Recall Storage Features
Figure 15. Global Biopharma Storage Service Market Size Comparison by Compliance (2020-2031) & (US$ Million)
Figure 16. GMP Compliant Storage Features
Figure 17. GSP Compliant Storage Features
Figure 18. Global Biopharma Storage Service Market Size by Application (2020-2031) & (US$ Million)
Figure 19. Global Biopharma Storage Service Market Share by Application: 2024 VS 2031
Figure 20. Drug Development and Clinical Trials Case Studies
Figure 21. Commercial Manufacturing and Supply Chain Management Case Studies
Figure 22. Cell and Gene Therapy Case Studies
Figure 23. Drug Traceability and Full Life Cycle Management Case Studies
Figure 24. Others Case Studies
Figure 25. Biopharma Storage Service Report Years Considered
Figure 26. Global Biopharma Storage Service Market Size (US$ Million), Year-over-Year: 2020-2031
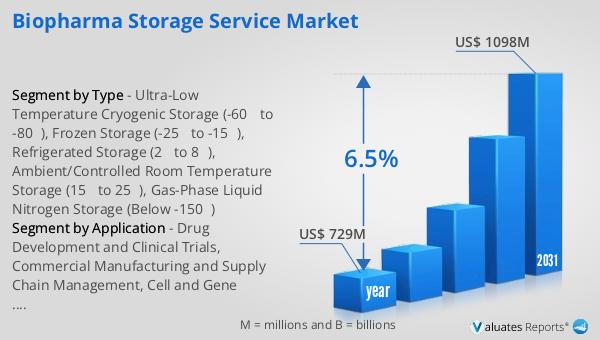
Figure 27. Global Biopharma Storage Service Market Size, (US$ Million), 2020 VS 2024 VS 2031
Figure 28. Global Biopharma Storage Service Market Share by Region: 2024 VS 2031
Figure 29. Global Biopharma Storage Service Market Share by Players in 2024
Figure 30. Global Biopharma Storage Service Market Share by Company Type (Tier 1, Tier 2, and Tier 3)
Figure 31. The Top 10 and 5 Players Market Share by Biopharma Storage Service Revenue in 2024
Figure 32. North America Biopharma Storage Service Market Size YoY Growth (2020-2031) & (US$ Million)
Figure 33. North America Biopharma Storage Service Market Share by Country (2020-2031)
Figure 34. United States Biopharma Storage Service Market Size YoY Growth (2020-2031) & (US$ Million)
Figure 35. Canada Biopharma Storage Service Market Size YoY Growth (2020-2031) & (US$ Million)
Figure 36. Europe Biopharma Storage Service Market Size YoY Growth (2020-2031) & (US$ Million)
Figure 37. Europe Biopharma Storage Service Market Share by Country (2020-2031)
Figure 38. Germany Biopharma Storage Service Market Size YoY Growth (2020-2031) & (US$ Million)
Figure 39. France Biopharma Storage Service Market Size YoY Growth (2020-2031) & (US$ Million)
Figure 40. U.K. Biopharma Storage Service Market Size YoY Growth (2020-2031) & (US$ Million)
Figure 41. Italy Biopharma Storage Service Market Size YoY Growth (2020-2031) & (US$ Million)
Figure 42. Russia Biopharma Storage Service Market Size YoY Growth (2020-2031) & (US$ Million)
Figure 43. Ireland Biopharma Storage Service Market Size YoY Growth (2020-2031) & (US$ Million)
Figure 44. Asia-Pacific Biopharma Storage Service Market Size YoY Growth (2020-2031) & (US$ Million)
Figure 45. Asia-Pacific Biopharma Storage Service Market Share by Region (2020-2031)
Figure 46. China Biopharma Storage Service Market Size YoY Growth (2020-2031) & (US$ Million)
Figure 47. Japan Biopharma Storage Service Market Size YoY Growth (2020-2031) & (US$ Million)
Figure 48. South Korea Biopharma Storage Service Market Size YoY Growth (2020-2031) & (US$ Million)
Figure 49. Southeast Asia Biopharma Storage Service Market Size YoY Growth (2020-2031) & (US$ Million)
Figure 50. India Biopharma Storage Service Market Size YoY Growth (2020-2031) & (US$ Million)
Figure 51. Australia & New Zealand Biopharma Storage Service Market Size YoY Growth (2020-2031) & (US$ Million)
Figure 52. Latin America Biopharma Storage Service Market Size YoY Growth (2020-2031) & (US$ Million)
Figure 53. Latin America Biopharma Storage Service Market Share by Country (2020-2031)
Figure 54. Mexico Biopharma Storage Service Market Size YoY Growth (2020-2031) & (US$ Million)
Figure 55. Brazil Biopharma Storage Service Market Size YoY Growth (2020-2031) & (US$ Million)
Figure 56. Middle East & Africa Biopharma Storage Service Market Size YoY Growth (2020-2031) & (US$ Million)
Figure 57. Middle East & Africa Biopharma Storage Service Market Share by Country (2020-2031)
Figure 58. Israel Biopharma Storage Service Market Size YoY Growth (2020-2031) & (US$ Million)
Figure 59. Saudi Arabia Biopharma Storage Service Market Size YoY Growth (2020-2031) & (US$ Million)
Figure 60. UAE Biopharma Storage Service Market Size YoY Growth (2020-2031) & (US$ Million)
Figure 61. Alcami Revenue Growth Rate in Biopharma Storage Service Business (2020-2025)
Figure 62. Azenta Life Sciences Revenue Growth Rate in Biopharma Storage Service Business (2020-2025)
Figure 63. Biopharma Technology LLC Revenue Growth Rate in Biopharma Storage Service Business (2020-2025)
Figure 64. Cencora Revenue Growth Rate in Biopharma Storage Service Business (2020-2025)
Figure 65. Donnegan Systems Revenue Growth Rate in Biopharma Storage Service Business (2020-2025)
Figure 66. ExtraVault Revenue Growth Rate in Biopharma Storage Service Business (2020-2025)
Figure 67. GBA Group Revenue Growth Rate in Biopharma Storage Service Business (2020-2025)
Figure 68. Patheon pharma services Revenue Growth Rate in Biopharma Storage Service Business (2020-2025)
Figure 69. PCI Services Revenue Growth Rate in Biopharma Storage Service Business (2020-2025)
Figure 70. Pharmaserv Logistics Revenue Growth Rate in Biopharma Storage Service Business (2020-2025)
Figure 71. SciSafe Revenue Growth Rate in Biopharma Storage Service Business (2020-2025)
Figure 72. Sentry BioPharma Services Revenue Growth Rate in Biopharma Storage Service Business (2020-2025)
Figure 73. Stirling Ultracold Revenue Growth Rate in Biopharma Storage Service Business (2020-2025)
Figure 74. Tobin Scientific Revenue Growth Rate in Biopharma Storage Service Business (2020-2025)
Figure 75. Bottom-up and Top-down Approaches for This Report
Figure 76. Data Triangulation
Figure 77. Key Executives Interviewed