1 Market Overview
1.1 Pneumatic Vibrators Product Introduction
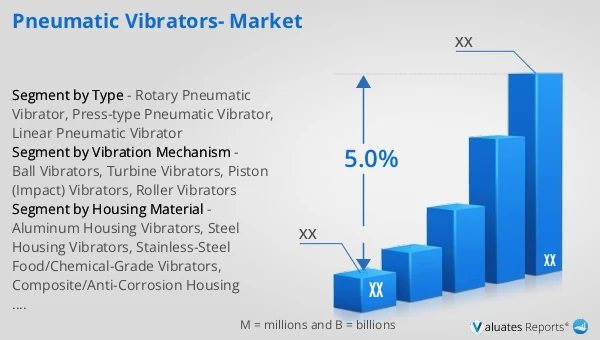
1.2 Global Pneumatic Vibrators Market Size Forecast
1.2.1 Global Pneumatic Vibrators Sales Value (2021–2032)
1.2.2 Global Pneumatic Vibrators Sales Volume (2021–2032)
1.2.3 Global Pneumatic Vibrators Sales Price (2021–2032)
1.3 Pneumatic Vibrators Market Trends & Drivers
1.3.1 Pneumatic Vibrators Industry Trends
1.3.2 Pneumatic Vibrators Market Drivers & Opportunities
1.3.3 Pneumatic Vibrators Market Challenges
1.3.4 Pneumatic Vibrators Market Restraints
1.3.5 Impact of U.S. Tariffs
1.4 Assumptions and Limitations
1.5 Study Objectives
1.6 Years Considered
2 Competitive Analysis by Company
2.1 Global Pneumatic Vibrators Players Revenue Ranking (2025)
2.2 Global Pneumatic Vibrators Revenue by Company (2021–2026)
2.3 Global Pneumatic Vibrators Sales Volume Ranking of Players (2025)
2.4 Global Pneumatic Vibrators Sales Volume by Company (2021–2026)
2.5 Global Pneumatic Vibrators Average Price by Company (2021–2026)
2.6 Key Manufacturers Pneumatic Vibrators Manufacturing Base and Headquarters
2.7 Key Manufacturers Pneumatic Vibrators Product Offerings
2.8 Key Manufacturers Start of Mass Production of Pneumatic Vibrators
2.9 Pneumatic Vibrators Market Competitive Analysis
2.9.1 Pneumatic Vibrators Market Concentration Rate (2021–2026)
2.9.2 Global 5 and 10 Largest Manufacturers by Pneumatic Vibrators Revenue in 2025
2.9.3 Global Companies by Tier (Tier 1, Tier 2, Tier 3), based on Pneumatic Vibrators revenue, 2025
2.10 Mergers & Acquisitions and Expansion
3 Segmentation Pneumatic Vibrators Market Classification
3.1 Introduction by Type
3.1.1 Rotary Pneumatic Vibrator
3.1.2 Press-type Pneumatic Vibrator
3.1.3 Linear Pneumatic Vibrator
3.1.4 Global Pneumatic Vibrators Sales Value by Type
3.1.4.1 Global Pneumatic Vibrators Sales Value by Type (2021 vs 2025 vs 2032)
3.1.4.2 Global Pneumatic Vibrators Sales Value, by Type (2021–2032)
3.1.4.3 Global Pneumatic Vibrators Sales Value, by Type (%), 2021–2032
3.1.5 Global Pneumatic Vibrators Sales Volume by Type
3.1.5.1 Global Pneumatic Vibrators Sales Volume by Type (2021 vs 2025 vs 2032)
3.1.5.2 Global Pneumatic Vibrators Sales Volume, by Type (2021–2032)
3.1.5.3 Global Pneumatic Vibrators Sales Volume, by Type (%), 2021–2032
3.1.6 Global Pneumatic Vibrators Average Price by Type (2021–2032)
3.2 Introduction by Vibration Mechanism
3.2.1 Ball Vibrators
3.2.2 Turbine Vibrators
3.2.3 Piston (Impact) Vibrators
3.2.4 Roller Vibrators
3.2.5 Global Pneumatic Vibrators Sales Value by Vibration Mechanism
3.2.5.1 Global Pneumatic Vibrators Sales Value by Vibration Mechanism (2021 vs 2025 vs 2032)
3.2.5.2 Global Pneumatic Vibrators Sales Value, by Vibration Mechanism (2021–2032)
3.2.5.3 Global Pneumatic Vibrators Sales Value, by Vibration Mechanism (%), 2021–2032
3.2.6 Global Pneumatic Vibrators Sales Volume by Vibration Mechanism
3.2.6.1 Global Pneumatic Vibrators Sales Volume by Vibration Mechanism (2021 vs 2025 vs 2032)
3.2.6.2 Global Pneumatic Vibrators Sales Volume, by Vibration Mechanism (2021–2032)
3.2.6.3 Global Pneumatic Vibrators Sales Volume, by Vibration Mechanism (%), 2021–2032
3.2.7 Global Pneumatic Vibrators Average Price by Vibration Mechanism (2021–2032)
3.3 Introduction by Housing Material
3.3.1 Aluminum Housing Vibrators
3.3.2 Steel Housing Vibrators
3.3.3 Stainless-Steel Food/Chemical-Grade Vibrators
3.3.4 Composite/Anti-Corrosion Housing Vibrators
3.3.5 Global Pneumatic Vibrators Sales Value by Housing Material
3.3.5.1 Global Pneumatic Vibrators Sales Value by Housing Material (2021 vs 2025 vs 2032)
3.3.5.2 Global Pneumatic Vibrators Sales Value, by Housing Material (2021–2032)
3.3.5.3 Global Pneumatic Vibrators Sales Value, by Housing Material (%), 2021–2032
3.3.6 Global Pneumatic Vibrators Sales Volume by Housing Material
3.3.6.1 Global Pneumatic Vibrators Sales Volume by Housing Material (2021 vs 2025 vs 2032)
3.3.6.2 Global Pneumatic Vibrators Sales Volume, by Housing Material (2021–2032)
3.3.6.3 Global Pneumatic Vibrators Sales Volume, by Housing Material (%), 2021–2032
3.3.7 Global Pneumatic Vibrators Average Price by Housing Material (2021–2032)
4 Segmentation by Application
4.1 Introduction by Application
4.1.1 Environmental Protection
4.1.2 Wastewater Treatment
4.1.3 Construction
4.1.4 Sewage Discharge
4.1.5 Fine Chemical
4.2 Global Pneumatic Vibrators Sales Value by Application
4.2.1 Global Pneumatic Vibrators Sales Value by Application (2021 vs 2025 vs 2032)
4.2.2 Global Pneumatic Vibrators Sales Value, by Application (2021–2032)
4.2.3 Global Pneumatic Vibrators Sales Value, by Application (%), 2021–2032
4.3 Global Pneumatic Vibrators Sales Volume by Application
4.3.1 Global Pneumatic Vibrators Sales Volume by Application (2021 vs 2025 vs 2032)
4.3.2 Global Pneumatic Vibrators Sales Volume, by Application (2021–2032)
4.3.3 Global Pneumatic Vibrators Sales Volume, by Application (%), 2021–2032
4.4 Global Pneumatic Vibrators Average Price by Application (2021–2032)
5 Segmentation by Region
5.1 Global Pneumatic Vibrators Sales Value by Region
5.1.1 Global Pneumatic Vibrators Sales Value by Region: 2021 vs 2025 vs 2032
5.1.2 Global Pneumatic Vibrators Sales Value by Region (2021–2026)
5.1.3 Global Pneumatic Vibrators Sales Value by Region (2027–2032)
5.1.4 Global Pneumatic Vibrators Sales Value by Region (%), 2021–2032
5.2 Global Pneumatic Vibrators Sales Volume by Region
5.2.1 Global Pneumatic Vibrators Sales Volume by Region: 2021 vs 2025 vs 2032
5.2.2 Global Pneumatic Vibrators Sales Volume by Region (2021–2026)
5.2.3 Global Pneumatic Vibrators Sales Volume by Region (2027–2032)
5.2.4 Global Pneumatic Vibrators Sales Volume by Region (%), 2021–2032
5.3 Global Pneumatic Vibrators Average Price by Region (2021–2032)
5.4 North America
5.4.1 North America Pneumatic Vibrators Sales Value, 2021–2032
5.4.2 North America Pneumatic Vibrators Sales Value by Country (%), 2025 vs 2032
5.5 Europe
5.5.1 Europe Pneumatic Vibrators Sales Value, 2021–2032
5.5.2 Europe Pneumatic Vibrators Sales Value by Country (%), 2025 vs 2032
5.6 Asia Pacific
5.6.1 Asia Pacific Pneumatic Vibrators Sales Value, 2021–2032
5.6.2 Asia Pacific Pneumatic Vibrators Sales Value by Region (%), 2025 vs 2032
5.7 South America
5.7.1 South America Pneumatic Vibrators Sales Value, 2021–2032
5.7.2 South America Pneumatic Vibrators Sales Value by Country (%), 2025 vs 2032
5.8 Middle East & Africa
5.8.1 Middle East & Africa Pneumatic Vibrators Sales Value, 2021–2032
5.8.2 Middle East & Africa Pneumatic Vibrators Sales Value by Country (%), 2025 vs 2032
6 Segmentation by Key Countries/Regions
6.1 Key Countries/Regions Pneumatic Vibrators Sales Value Growth Trends, 2021 vs 2025 vs 2032
6.2 Key Countries/Regions Pneumatic Vibrators Sales Value and Sales Volume
6.2.1 Key Countries/Regions Pneumatic Vibrators Sales Value, 2021–2032
6.2.2 Key Countries/Regions Pneumatic Vibrators Sales Volume, 2021–2032
6.3 United States
6.3.1 United States Pneumatic Vibrators Sales Value, 2021–2032
6.3.2 United States Pneumatic Vibrators Sales Value by Type (%), 2025 vs 2032
6.3.3 United States Pneumatic Vibrators Sales Value by Application, 2025 vs 2032
6.4 Europe
6.4.1 Europe Pneumatic Vibrators Sales Value, 2021–2032
6.4.2 Europe Pneumatic Vibrators Sales Value by Type (%), 2025 vs 2032
6.4.3 Europe Pneumatic Vibrators Sales Value by Application, 2025 vs 2032
6.5 China
6.5.1 China Pneumatic Vibrators Sales Value, 2021–2032
6.5.2 China Pneumatic Vibrators Sales Value by Type (%), 2025 vs 2032
6.5.3 China Pneumatic Vibrators Sales Value by Application, 2025 vs 2032
6.6 Japan
6.6.1 Japan Pneumatic Vibrators Sales Value, 2021–2032
6.6.2 Japan Pneumatic Vibrators Sales Value by Type (%), 2025 vs 2032
6.6.3 Japan Pneumatic Vibrators Sales Value by Application, 2025 vs 2032
6.7 South Korea
6.7.1 South Korea Pneumatic Vibrators Sales Value, 2021–2032
6.7.2 South Korea Pneumatic Vibrators Sales Value by Type (%), 2025 vs 2032
6.7.3 South Korea Pneumatic Vibrators Sales Value by Application, 2025 vs 2032
6.8 Southeast Asia
6.8.1 Southeast Asia Pneumatic Vibrators Sales Value, 2021–2032
6.8.2 Southeast Asia Pneumatic Vibrators Sales Value by Type (%), 2025 vs 2032
6.8.3 Southeast Asia Pneumatic Vibrators Sales Value by Application, 2025 vs 2032
6.9 India
6.9.1 India Pneumatic Vibrators Sales Value, 2021–2032
6.9.2 India Pneumatic Vibrators Sales Value by Type (%), 2025 vs 2032
6.9.3 India Pneumatic Vibrators Sales Value by Application, 2025 vs 2032
7 Company Profiles
7.1 Cleveland Vibrator
7.1.1 Cleveland Vibrator Company Information
7.1.2 Cleveland Vibrator Introduction and Business Overview
7.1.3 Cleveland Vibrator Pneumatic Vibrators Sales, Revenue, Price and Gross Margin (2021–2026)
7.1.4 Cleveland Vibrator Pneumatic Vibrators Product Offerings
7.1.5 Cleveland Vibrator Recent Developments
7.2 FINETEK
7.2.1 FINETEK Company Information
7.2.2 FINETEK Introduction and Business Overview
7.2.3 FINETEK Pneumatic Vibrators Sales, Revenue, Price and Gross Margin (2021–2026)
7.2.4 FINETEK Pneumatic Vibrators Product Offerings
7.2.5 FINETEK Recent Developments
7.3 Netter Vibration
7.3.1 Netter Vibration Company Information
7.3.2 Netter Vibration Introduction and Business Overview
7.3.3 Netter Vibration Pneumatic Vibrators Sales, Revenue, Price and Gross Margin (2021–2026)
7.3.4 Netter Vibration Pneumatic Vibrators Product Offerings
7.3.5 Netter Vibration Recent Developments
7.4 ALDAK GmbH
7.4.1 ALDAK GmbH Company Information
7.4.2 ALDAK GmbH Introduction and Business Overview
7.4.3 ALDAK GmbH Pneumatic Vibrators Sales, Revenue, Price and Gross Margin (2021–2026)
7.4.4 ALDAK GmbH Pneumatic Vibrators Product Offerings
7.4.5 ALDAK GmbH Recent Developments
7.5 Filquip
7.5.1 Filquip Company Information
7.5.2 Filquip Introduction and Business Overview
7.5.3 Filquip Pneumatic Vibrators Sales, Revenue, Price and Gross Margin (2021–2026)
7.5.4 Filquip Pneumatic Vibrators Product Offerings
7.5.5 Filquip Recent Developments
7.6 Vibronord
7.6.1 Vibronord Company Information
7.6.2 Vibronord Introduction and Business Overview
7.6.3 Vibronord Pneumatic Vibrators Sales, Revenue, Price and Gross Margin (2021–2026)
7.6.4 Vibronord Pneumatic Vibrators Product Offerings
7.6.5 Vibronord Recent Developments
7.7 NetterVibration
7.7.1 NetterVibration Company Information
7.7.2 NetterVibration Introduction and Business Overview
7.7.3 NetterVibration Pneumatic Vibrators Sales, Revenue, Price and Gross Margin (2021–2026)
7.7.4 NetterVibration Pneumatic Vibrators Product Offerings
7.7.5 NetterVibration Recent Developments
7.8 Martineng
7.8.1 Martineng Company Information
7.8.2 Martineng Introduction and Business Overview
7.8.3 Martineng Pneumatic Vibrators Sales, Revenue, Price and Gross Margin (2021–2026)
7.8.4 Martineng Pneumatic Vibrators Product Offerings
7.8.5 Martineng Recent Developments
7.9 Holid
7.9.1 Holid Company Information
7.9.2 Holid Introduction and Business Overview
7.9.3 Holid Pneumatic Vibrators Sales, Revenue, Price and Gross Margin (2021–2026)
7.9.4 Holid Pneumatic Vibrators Product Offerings
7.9.5 Holid Recent Developments
7.10 Olivibra
7.10.1 Olivibra Company Information
7.10.2 Olivibra Introduction and Business Overview
7.10.3 Olivibra Pneumatic Vibrators Sales, Revenue, Price and Gross Margin (2021–2026)
7.10.4 Olivibra Pneumatic Vibrators Product Offerings
7.10.5 Olivibra Recent Developments
7.11 Vibra-Schultheis
7.11.1 Vibra-Schultheis Company Information
7.11.2 Vibra-Schultheis Introduction and Business Overview
7.11.3 Vibra-Schultheis Pneumatic Vibrators Sales, Revenue, Price and Gross Margin (2021–2026)
7.11.4 Vibra-Schultheis Pneumatic Vibrators Product Offerings
7.11.5 Vibra-Schultheis Recent Developments
7.12 Vibco Vibrators
7.12.1 Vibco Vibrators Company Information
7.12.2 Vibco Vibrators Introduction and Business Overview
7.12.3 Vibco Vibrators Pneumatic Vibrators Sales, Revenue, Price and Gross Margin (2021–2026)
7.12.4 Vibco Vibrators Pneumatic Vibrators Product Offerings
7.12.5 Vibco Vibrators Recent Developments
7.13 OLI Vibrators
7.13.1 OLI Vibrators Company Information
7.13.2 OLI Vibrators Introduction and Business Overview
7.13.3 OLI Vibrators Pneumatic Vibrators Sales, Revenue, Price and Gross Margin (2021–2026)
7.13.4 OLI Vibrators Pneumatic Vibrators Product Offerings
7.13.5 OLI Vibrators Recent Developments
7.14 KOLLMANN
7.14.1 KOLLMANN Company Information
7.14.2 KOLLMANN Introduction and Business Overview
7.14.3 KOLLMANN Pneumatic Vibrators Sales, Revenue, Price and Gross Margin (2021–2026)
7.14.4 KOLLMANN Pneumatic Vibrators Product Offerings
7.14.5 KOLLMANN Recent Developments
7.15 Findeva AG
7.15.1 Findeva AG Company Information
7.15.2 Findeva AG Introduction and Business Overview
7.15.3 Findeva AG Pneumatic Vibrators Sales, Revenue, Price and Gross Margin (2021–2026)
7.15.4 Findeva AG Pneumatic Vibrators Product Offerings
7.15.5 Findeva AG Recent Developments
8 Industry Chain Analysis
8.1 Pneumatic Vibrators Industrial Chain
8.2 Pneumatic Vibrators Upstream Analysis
8.2.1 Key Raw Materials
8.2.2 Key Suppliers of Raw Materials
8.2.3 Manufacturing Cost Structure
8.3 Midstream Analysis
8.4 Downstream Analysis (Customer Analysis)
8.5 Sales Model and Sales Channelss
8.5.1 Pneumatic Vibrators Sales Model
8.5.2 Sales Channels
8.5.3 Pneumatic Vibrators Distributors
9 Research Findings and Conclusion
10 Appendix
10.1 Research Methodology
10.1.1 Methodology/Research Approach
10.1.1.1 Research Programs/Design
10.1.1.2 Market Size Estimation
10.1.1.3 Market Breakdown and Data Triangulation
10.1.2 Data Source
10.1.2.1 Secondary Sources
10.1.2.2 Primary Sources
10.2 Author Details
10.3 Disclaimer