1 Market Overview
1.1 Wall Mounted Bioethanol Fireplace Product Introduction
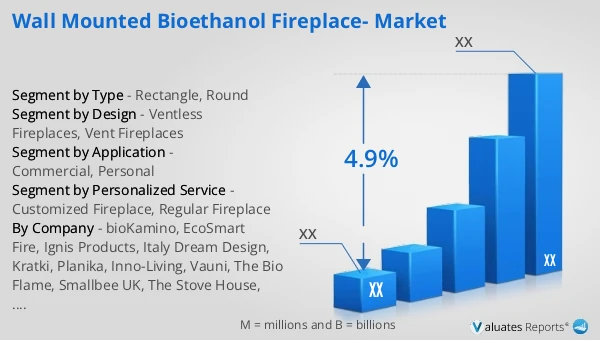
1.2 Global Wall Mounted Bioethanol Fireplace Market Size Forecast
1.2.1 Global Wall Mounted Bioethanol Fireplace Sales Value (2021–2032)
1.2.2 Global Wall Mounted Bioethanol Fireplace Sales Volume (2021–2032)
1.2.3 Global Wall Mounted Bioethanol Fireplace Sales Price (2021–2032)
1.3 Wall Mounted Bioethanol Fireplace Market Trends & Drivers
1.3.1 Wall Mounted Bioethanol Fireplace Industry Trends
1.3.2 Wall Mounted Bioethanol Fireplace Market Drivers & Opportunities
1.3.3 Wall Mounted Bioethanol Fireplace Market Challenges
1.3.4 Wall Mounted Bioethanol Fireplace Market Restraints
1.3.5 Impact of U.S. Tariffs
1.4 Assumptions and Limitations
1.5 Study Objectives
1.6 Years Considered
2 Competitive Analysis by Company
2.1 Global Wall Mounted Bioethanol Fireplace Players Revenue Ranking (2025)
2.2 Global Wall Mounted Bioethanol Fireplace Revenue by Company (2021–2026)
2.3 Global Wall Mounted Bioethanol Fireplace Sales Volume Ranking of Players (2025)
2.4 Global Wall Mounted Bioethanol Fireplace Sales Volume by Company (2021–2026)
2.5 Global Wall Mounted Bioethanol Fireplace Average Price by Company (2021–2026)
2.6 Key Manufacturers Wall Mounted Bioethanol Fireplace Manufacturing Base and Headquarters
2.7 Key Manufacturers Wall Mounted Bioethanol Fireplace Product Offerings
2.8 Key Manufacturers Start of Mass Production of Wall Mounted Bioethanol Fireplace
2.9 Wall Mounted Bioethanol Fireplace Market Competitive Analysis
2.9.1 Wall Mounted Bioethanol Fireplace Market Concentration Rate (2021–2026)
2.9.2 Global 5 and 10 Largest Manufacturers by Wall Mounted Bioethanol Fireplace Revenue in 2025
2.9.3 Global Companies by Tier (Tier 1, Tier 2, Tier 3), based on Wall Mounted Bioethanol Fireplace revenue, 2025
2.10 Mergers & Acquisitions and Expansion
3 Segmentation Wall Mounted Bioethanol Fireplace Market Classification
3.1 Introduction by Type
3.1.1 Rectangle
3.1.2 Round
3.1.3 Global Wall Mounted Bioethanol Fireplace Sales Value by Type
3.1.3.1 Global Wall Mounted Bioethanol Fireplace Sales Value by Type (2021 vs 2025 vs 2032)
3.1.3.2 Global Wall Mounted Bioethanol Fireplace Sales Value, by Type (2021–2032)
3.1.3.3 Global Wall Mounted Bioethanol Fireplace Sales Value, by Type (%), 2021–2032
3.1.4 Global Wall Mounted Bioethanol Fireplace Sales Volume by Type
3.1.4.1 Global Wall Mounted Bioethanol Fireplace Sales Volume by Type (2021 vs 2025 vs 2032)
3.1.4.2 Global Wall Mounted Bioethanol Fireplace Sales Volume, by Type (2021–2032)
3.1.4.3 Global Wall Mounted Bioethanol Fireplace Sales Volume, by Type (%), 2021–2032
3.1.5 Global Wall Mounted Bioethanol Fireplace Average Price by Type (2021–2032)
3.2 Introduction by Personalized Service
3.2.1 Customized Fireplace
3.2.2 Regular Fireplace
3.2.3 Global Wall Mounted Bioethanol Fireplace Sales Value by Personalized Service
3.2.3.1 Global Wall Mounted Bioethanol Fireplace Sales Value by Personalized Service (2021 vs 2025 vs 2032)
3.2.3.2 Global Wall Mounted Bioethanol Fireplace Sales Value, by Personalized Service (2021–2032)
3.2.3.3 Global Wall Mounted Bioethanol Fireplace Sales Value, by Personalized Service (%), 2021–2032
3.2.4 Global Wall Mounted Bioethanol Fireplace Sales Volume by Personalized Service
3.2.4.1 Global Wall Mounted Bioethanol Fireplace Sales Volume by Personalized Service (2021 vs 2025 vs 2032)
3.2.4.2 Global Wall Mounted Bioethanol Fireplace Sales Volume, by Personalized Service (2021–2032)
3.2.4.3 Global Wall Mounted Bioethanol Fireplace Sales Volume, by Personalized Service (%), 2021–2032
3.2.5 Global Wall Mounted Bioethanol Fireplace Average Price by Personalized Service (2021–2032)
3.3 Introduction by Design
3.3.1 Ventless Fireplaces
3.3.2 Vent Fireplaces
3.3.3 Global Wall Mounted Bioethanol Fireplace Sales Value by Design
3.3.3.1 Global Wall Mounted Bioethanol Fireplace Sales Value by Design (2021 vs 2025 vs 2032)
3.3.3.2 Global Wall Mounted Bioethanol Fireplace Sales Value, by Design (2021–2032)
3.3.3.3 Global Wall Mounted Bioethanol Fireplace Sales Value, by Design (%), 2021–2032
3.3.4 Global Wall Mounted Bioethanol Fireplace Sales Volume by Design
3.3.4.1 Global Wall Mounted Bioethanol Fireplace Sales Volume by Design (2021 vs 2025 vs 2032)
3.3.4.2 Global Wall Mounted Bioethanol Fireplace Sales Volume, by Design (2021–2032)
3.3.4.3 Global Wall Mounted Bioethanol Fireplace Sales Volume, by Design (%), 2021–2032
3.3.5 Global Wall Mounted Bioethanol Fireplace Average Price by Design (2021–2032)
4 Segmentation by Application
4.1 Introduction by Application
4.1.1 Commercial
4.1.2 Personal
4.2 Global Wall Mounted Bioethanol Fireplace Sales Value by Application
4.2.1 Global Wall Mounted Bioethanol Fireplace Sales Value by Application (2021 vs 2025 vs 2032)
4.2.2 Global Wall Mounted Bioethanol Fireplace Sales Value, by Application (2021–2032)
4.2.3 Global Wall Mounted Bioethanol Fireplace Sales Value, by Application (%), 2021–2032
4.3 Global Wall Mounted Bioethanol Fireplace Sales Volume by Application
4.3.1 Global Wall Mounted Bioethanol Fireplace Sales Volume by Application (2021 vs 2025 vs 2032)
4.3.2 Global Wall Mounted Bioethanol Fireplace Sales Volume, by Application (2021–2032)
4.3.3 Global Wall Mounted Bioethanol Fireplace Sales Volume, by Application (%), 2021–2032
4.4 Global Wall Mounted Bioethanol Fireplace Average Price by Application (2021–2032)
5 Segmentation by Region
5.1 Global Wall Mounted Bioethanol Fireplace Sales Value by Region
5.1.1 Global Wall Mounted Bioethanol Fireplace Sales Value by Region: 2021 vs 2025 vs 2032
5.1.2 Global Wall Mounted Bioethanol Fireplace Sales Value by Region (2021–2026)
5.1.3 Global Wall Mounted Bioethanol Fireplace Sales Value by Region (2027–2032)
5.1.4 Global Wall Mounted Bioethanol Fireplace Sales Value by Region (%), 2021–2032
5.2 Global Wall Mounted Bioethanol Fireplace Sales Volume by Region
5.2.1 Global Wall Mounted Bioethanol Fireplace Sales Volume by Region: 2021 vs 2025 vs 2032
5.2.2 Global Wall Mounted Bioethanol Fireplace Sales Volume by Region (2021–2026)
5.2.3 Global Wall Mounted Bioethanol Fireplace Sales Volume by Region (2027–2032)
5.2.4 Global Wall Mounted Bioethanol Fireplace Sales Volume by Region (%), 2021–2032
5.3 Global Wall Mounted Bioethanol Fireplace Average Price by Region (2021–2032)
5.4 North America
5.4.1 North America Wall Mounted Bioethanol Fireplace Sales Value, 2021–2032
5.4.2 North America Wall Mounted Bioethanol Fireplace Sales Value by Country (%), 2025 vs 2032
5.5 Europe
5.5.1 Europe Wall Mounted Bioethanol Fireplace Sales Value, 2021–2032
5.5.2 Europe Wall Mounted Bioethanol Fireplace Sales Value by Country (%), 2025 vs 2032
5.6 Asia Pacific
5.6.1 Asia Pacific Wall Mounted Bioethanol Fireplace Sales Value, 2021–2032
5.6.2 Asia Pacific Wall Mounted Bioethanol Fireplace Sales Value by Region (%), 2025 vs 2032
5.7 South America
5.7.1 South America Wall Mounted Bioethanol Fireplace Sales Value, 2021–2032
5.7.2 South America Wall Mounted Bioethanol Fireplace Sales Value by Country (%), 2025 vs 2032
5.8 Middle East & Africa
5.8.1 Middle East & Africa Wall Mounted Bioethanol Fireplace Sales Value, 2021–2032
5.8.2 Middle East & Africa Wall Mounted Bioethanol Fireplace Sales Value by Country (%), 2025 vs 2032
6 Segmentation by Key Countries/Regions
6.1 Key Countries/Regions Wall Mounted Bioethanol Fireplace Sales Value Growth Trends, 2021 vs 2025 vs 2032
6.2 Key Countries/Regions Wall Mounted Bioethanol Fireplace Sales Value and Sales Volume
6.2.1 Key Countries/Regions Wall Mounted Bioethanol Fireplace Sales Value, 2021–2032
6.2.2 Key Countries/Regions Wall Mounted Bioethanol Fireplace Sales Volume, 2021–2032
6.3 United States
6.3.1 United States Wall Mounted Bioethanol Fireplace Sales Value, 2021–2032
6.3.2 United States Wall Mounted Bioethanol Fireplace Sales Value by Type (%), 2025 vs 2032
6.3.3 United States Wall Mounted Bioethanol Fireplace Sales Value by Application, 2025 vs 2032
6.4 Europe
6.4.1 Europe Wall Mounted Bioethanol Fireplace Sales Value, 2021–2032
6.4.2 Europe Wall Mounted Bioethanol Fireplace Sales Value by Type (%), 2025 vs 2032
6.4.3 Europe Wall Mounted Bioethanol Fireplace Sales Value by Application, 2025 vs 2032
6.5 China
6.5.1 China Wall Mounted Bioethanol Fireplace Sales Value, 2021–2032
6.5.2 China Wall Mounted Bioethanol Fireplace Sales Value by Type (%), 2025 vs 2032
6.5.3 China Wall Mounted Bioethanol Fireplace Sales Value by Application, 2025 vs 2032
6.6 Japan
6.6.1 Japan Wall Mounted Bioethanol Fireplace Sales Value, 2021–2032
6.6.2 Japan Wall Mounted Bioethanol Fireplace Sales Value by Type (%), 2025 vs 2032
6.6.3 Japan Wall Mounted Bioethanol Fireplace Sales Value by Application, 2025 vs 2032
6.7 South Korea
6.7.1 South Korea Wall Mounted Bioethanol Fireplace Sales Value, 2021–2032
6.7.2 South Korea Wall Mounted Bioethanol Fireplace Sales Value by Type (%), 2025 vs 2032
6.7.3 South Korea Wall Mounted Bioethanol Fireplace Sales Value by Application, 2025 vs 2032
6.8 Southeast Asia
6.8.1 Southeast Asia Wall Mounted Bioethanol Fireplace Sales Value, 2021–2032
6.8.2 Southeast Asia Wall Mounted Bioethanol Fireplace Sales Value by Type (%), 2025 vs 2032
6.8.3 Southeast Asia Wall Mounted Bioethanol Fireplace Sales Value by Application, 2025 vs 2032
6.9 India
6.9.1 India Wall Mounted Bioethanol Fireplace Sales Value, 2021–2032
6.9.2 India Wall Mounted Bioethanol Fireplace Sales Value by Type (%), 2025 vs 2032
6.9.3 India Wall Mounted Bioethanol Fireplace Sales Value by Application, 2025 vs 2032
7 Company Profiles
7.1 bioKamino
7.1.1 bioKamino Company Information
7.1.2 bioKamino Introduction and Business Overview
7.1.3 bioKamino Wall Mounted Bioethanol Fireplace Sales, Revenue, Price and Gross Margin (2021–2026)
7.1.4 bioKamino Wall Mounted Bioethanol Fireplace Product Offerings
7.1.5 bioKamino Recent Developments
7.2 EcoSmart Fire
7.2.1 EcoSmart Fire Company Information
7.2.2 EcoSmart Fire Introduction and Business Overview
7.2.3 EcoSmart Fire Wall Mounted Bioethanol Fireplace Sales, Revenue, Price and Gross Margin (2021–2026)
7.2.4 EcoSmart Fire Wall Mounted Bioethanol Fireplace Product Offerings
7.2.5 EcoSmart Fire Recent Developments
7.3 Ignis Products
7.3.1 Ignis Products Company Information
7.3.2 Ignis Products Introduction and Business Overview
7.3.3 Ignis Products Wall Mounted Bioethanol Fireplace Sales, Revenue, Price and Gross Margin (2021–2026)
7.3.4 Ignis Products Wall Mounted Bioethanol Fireplace Product Offerings
7.3.5 Ignis Products Recent Developments
7.4 Italy Dream Design
7.4.1 Italy Dream Design Company Information
7.4.2 Italy Dream Design Introduction and Business Overview
7.4.3 Italy Dream Design Wall Mounted Bioethanol Fireplace Sales, Revenue, Price and Gross Margin (2021–2026)
7.4.4 Italy Dream Design Wall Mounted Bioethanol Fireplace Product Offerings
7.4.5 Italy Dream Design Recent Developments
7.5 Kratki
7.5.1 Kratki Company Information
7.5.2 Kratki Introduction and Business Overview
7.5.3 Kratki Wall Mounted Bioethanol Fireplace Sales, Revenue, Price and Gross Margin (2021–2026)
7.5.4 Kratki Wall Mounted Bioethanol Fireplace Product Offerings
7.5.5 Kratki Recent Developments
7.6 Planika
7.6.1 Planika Company Information
7.6.2 Planika Introduction and Business Overview
7.6.3 Planika Wall Mounted Bioethanol Fireplace Sales, Revenue, Price and Gross Margin (2021–2026)
7.6.4 Planika Wall Mounted Bioethanol Fireplace Product Offerings
7.6.5 Planika Recent Developments
7.7 Inno-Living
7.7.1 Inno-Living Company Information
7.7.2 Inno-Living Introduction and Business Overview
7.7.3 Inno-Living Wall Mounted Bioethanol Fireplace Sales, Revenue, Price and Gross Margin (2021–2026)
7.7.4 Inno-Living Wall Mounted Bioethanol Fireplace Product Offerings
7.7.5 Inno-Living Recent Developments
7.8 Vauni
7.8.1 Vauni Company Information
7.8.2 Vauni Introduction and Business Overview
7.8.3 Vauni Wall Mounted Bioethanol Fireplace Sales, Revenue, Price and Gross Margin (2021–2026)
7.8.4 Vauni Wall Mounted Bioethanol Fireplace Product Offerings
7.8.5 Vauni Recent Developments
7.9 The Bio Flame
7.9.1 The Bio Flame Company Information
7.9.2 The Bio Flame Introduction and Business Overview
7.9.3 The Bio Flame Wall Mounted Bioethanol Fireplace Sales, Revenue, Price and Gross Margin (2021–2026)
7.9.4 The Bio Flame Wall Mounted Bioethanol Fireplace Product Offerings
7.9.5 The Bio Flame Recent Developments
7.10 Smallbee UK
7.10.1 Smallbee UK Company Information
7.10.2 Smallbee UK Introduction and Business Overview
7.10.3 Smallbee UK Wall Mounted Bioethanol Fireplace Sales, Revenue, Price and Gross Margin (2021–2026)
7.10.4 Smallbee UK Wall Mounted Bioethanol Fireplace Product Offerings
7.10.5 Smallbee UK Recent Developments
7.11 The Stove House
7.11.1 The Stove House Company Information
7.11.2 The Stove House Introduction and Business Overview
7.11.3 The Stove House Wall Mounted Bioethanol Fireplace Sales, Revenue, Price and Gross Margin (2021–2026)
7.11.4 The Stove House Wall Mounted Bioethanol Fireplace Product Offerings
7.11.5 The Stove House Recent Developments
7.12 Imaginfires
7.12.1 Imaginfires Company Information
7.12.2 Imaginfires Introduction and Business Overview
7.12.3 Imaginfires Wall Mounted Bioethanol Fireplace Sales, Revenue, Price and Gross Margin (2021–2026)
7.12.4 Imaginfires Wall Mounted Bioethanol Fireplace Product Offerings
7.12.5 Imaginfires Recent Developments
7.13 Focotto
7.13.1 Focotto Company Information
7.13.2 Focotto Introduction and Business Overview
7.13.3 Focotto Wall Mounted Bioethanol Fireplace Sales, Revenue, Price and Gross Margin (2021–2026)
7.13.4 Focotto Wall Mounted Bioethanol Fireplace Product Offerings
7.13.5 Focotto Recent Developments
8 Industry Chain Analysis
8.1 Wall Mounted Bioethanol Fireplace Industrial Chain
8.2 Wall Mounted Bioethanol Fireplace Upstream Analysis
8.2.1 Key Raw Materials
8.2.2 Key Suppliers of Raw Materials
8.2.3 Manufacturing Cost Structure
8.3 Midstream Analysis
8.4 Downstream Analysis (Customer Analysis)
8.5 Sales Model and Sales Channelss
8.5.1 Wall Mounted Bioethanol Fireplace Sales Model
8.5.2 Sales Channels
8.5.3 Wall Mounted Bioethanol Fireplace Distributors
9 Research Findings and Conclusion
10 Appendix
10.1 Research Methodology
10.1.1 Methodology/Research Approach
10.1.1.1 Research Programs/Design
10.1.1.2 Market Size Estimation
10.1.1.3 Market Breakdown and Data Triangulation
10.1.2 Data Source
10.1.2.1 Secondary Sources
10.1.2.2 Primary Sources
10.2 Author Details
10.3 Disclaimer