0
U.S. (TOLL FREE)
+1 (315) 215-3225
Automative

0
U.S. (TOLL FREE)
+1 (315) 215-3225
Global GPU Cloud Access Technologies Market Outlook, In‑Depth Analysis & Forecast to 2031
Published Date: September 2025
|
Report Code: QYRE-Auto-0Z20283
Home | Market Reports | Computers & Electronics
Global GPU Cloud Access Technologies Market Outlook In Depth Analysis Forecast to 2031
BUY CHAPTERS

Global GPU Cloud Access Technologies Market Outlook, In‑Depth Analysis & Forecast to 2031

Code: QYRE-Auto-0Z20283
Report
September 2025
Pages:148
QYResearch
Buy Now with 15% Discount
DESCRIPTION
TABLE OF CONTENT
TABLES & FIGURES

GPU Cloud Access Technologies Market Size

The global GPU Cloud Access Technologies market is projected to grow from US$ 1350 million in 2024 to US$ 2267 million by 2031, at a CAGR of 7.8% (2025-2031), driven by critical product segments and diverse end‑use applications.

GPU Cloud Access Technologies Market

GPU Cloud Access Technologies Market

GPU Cloud Access Technologies refer to a set of tools, platforms, and protocols that enable users to remotely access and utilize Graphics Processing Units (GPUs) hosted in cloud environments for compute-intensive tasks such as machine learning, rendering, data analytics, and gaming. These technologies allow users to leverage the power of GPUs without needing to own or maintain high-performance hardware on-premises. Instead, GPUs are accessed over the internet, often via cloud service providers like Amazon Web Services (AWS), Microsoft Azure, or Google Cloud.
From a downstream perspective, IT & Telecom accounted for % of 2024 revenue, surging to US$ million by 2031 (CAGR: % from 2025–2031).
GPU Cloud Access Technologies leading manufacturers including NVIDIA, AWS, Google, Microsoft, Oracle, IBM, Anyscale, Hugging Face, Meta, Tesla, etc., dominate supply; the top five capture approximately % of global revenue, with NVIDIA leading 2024 sales at US$ million.
Regional Outlook:
North America rose from US$ million in 2024 to a forecast US$ million by 2031 (CAGR %).
Asia‑Pacific will expand from US$ million to US$ million (CAGR  %), led by China (US$ million in 2024, % share rising to % by 2031), Japan (CAGR %), South Korea (CAGR %), and Southeast Asia (CAGR %).
Europe is set to grow from US$ million to US$ million (CAGR %), with Germany projected to hit US$ million by 2031 (CAGR %).

Report Includes:

This definitive report equips CEOs, marketing directors, and investors with a 360° view of the global GPU Cloud Access Technologies market across value chain. It analyzes historical revenue data (2020–2024) and delivers forecasts through 2031, illuminating demand trends and growth drivers.
By segmenting the market by Type and by Application, the study quantifies market size, growth rates, niche opportunities, and substitution risks, and analyzes downstream customers distribution pattern.
Granular regional insights cover five major markets—North America, Europe, APAC, South America, and MEA—with in‑depth analysis of 20+ countries, detailing dominant products, competitive landscape, and downstream demand trends.
Critical competitive intelligence profiles players—revenue, margins, pricing strategies, and major customers—and dissects the top-player positioning across product lines, applications, and regions to reveal strategic strengths.
A concise Industry‑chain overview maps upstream, middlestream, and downstream distribution dynamics to identify strategic gaps and unmet demand.
Market Segmentation

Scope of GPU Cloud Access Technologies Market Report

Report Metric Details
Report Name GPU Cloud Access Technologies Market
Accounted market size in 2024 US$ 1350 million
Forecasted market size in 2031 US$ 2267 million
CAGR 7.8%
Base Year 2024
Forecasted years 2025 - 2031
Segment by Type
  • GPU Cloud Compute Instances
  • GPU Virtualization
  • GPU-as-a-Service (GaaS)
  • Others
Segment by Application
  • IT & Telecom
  • Healthcare
  • Automotive
  • Finance
  • Entertainment & Media
  • Retail & eCommerce
  • Manufacturing Automotion
  • Energy & Utilities
  • Education
Sales by Region
  • North America (United States, Canada)
  • Europe (Germany, France, UK, Italy, Russia) Rest of Europe
  • Nordic Countries
  • Asia-Pacific (China, Japan, South Korea)
  • Southeast Asia (India, Australia)
  • Rest of Asia
  • Latin America (Mexico, Brazil)
  • Rest of Latin America
  • Middle East & Africa (Turkey, Saudi Arabia, UAE, Rest of MEA)
By Company NVIDIA, AWS, Google, Microsoft, Oracle, IBM, Anyscale, Hugging Face, Meta, Tesla, Paperspace, Vast.ai, Cerebras, Lambda Labs, Fathom, Run.ai, Intel, Cloudflare, Equinix, Alibaba
Forecast units USD million in value
Report coverage Revenue and volume forecast, company share, competitive landscape, growth factors and trends

Chapter Outline

  • Chapter 1: Defines the GPU Cloud Access Technologies study scope, segments the market by Type and by Application, etc, highlights segment size and growth potential.
  • Chapter 2: Offers current market state, projects global revenue and sales to 2031, pinpointing high consumption regions and emerging market catalysts
  • Chapter 3: Dissects the player landscape—ranks by revenue and profitability, details Player performance by product type and evaluates concentration alongside M&A moves.
  • Chapter 4: Unlocks high margin product segments—compares revenue, ASP, and technology differentiators, highlighting growth niches and substitution risks
  • Chapter 5: Targets downstream market opportunities—evaluates market size by Application, identifies emerging use cases, and profiles leading customers by region and by Application.
  • Chapter 6: North America—breaks down market size by Type, by Application and country, profiles key players and assesses growth drivers and barriers.
  • Chapter 7: Europe—analyses regional market by Type, by Application and players, flagging drivers and barriers.
  • Chapter 8: Asia Pacific—quantifies market size by Type, by Application, and region/country, profiles top players, and uncovers high potential expansion areas.
  • Chapter 9: Central & South America—measures market size by Type, by Application, and country, profiles top players, and identifies investment opportunities and challenges.
  • Chapter 10: Middle East and Africa—evaluates market size by Type, by Application, and country, profiles key players, and outlines investment prospects and market hurdles
  • Chapter 11: Profiles players in depth—details product specs, revenue, margins; Top-tier players 2024 sales breakdowns by Product type, by Application, by region SWOT analysis, and recent strategic developments.
  • Chapter 12: Industry chain—analyses upstream, cost drivers, plus downstream channels.
  • Chapter 13: Market dynamics—explores drivers, restraints, regulatory impacts, and risk mitigation strategies.
  • Chapter 14: Actionable conclusions and strategic recommendations.
  • Why This Report:
  • Beyond standard market data, this analysis provides a clear profitability roadmap—empowering you to:
  • Allocate capital strategically to high growth regions (Chapters 6–10) and margin rich segments (Chapter 5).
  • Negotiate from strength with suppliers (Chapter 12) and customers (Chapter 5) using cost and demand intelligence.
  • Outmaneuver competitors with granular insights into their operations, margins, and strategies (Chapters 3 and 11).
  • Capitalize on the projected billion‑dollar opportunity with data‑driven regional and segment tactics (Chapter 12-14).
  • Leverage this 360° intelligence to turn market complexity into actionable competitive advantage.

FAQ for this report

How fast is GPU Cloud Access Technologies Market growing?

Ans: The GPU Cloud Access Technologies Market witnessing a CAGR of 7.8% during the forecast period 2025-2031.

What is the GPU Cloud Access Technologies Market size in 2031?

Ans: The GPU Cloud Access Technologies Market size in 2031 will be US$ 2267 million.

Who are the main players in the GPU Cloud Access Technologies Market report?

Ans: The main players in the GPU Cloud Access Technologies Market are NVIDIA, AWS, Google, Microsoft, Oracle, IBM, Anyscale, Hugging Face, Meta, Tesla, Paperspace, Vast.ai, Cerebras, Lambda Labs, Fathom, Run.ai, Intel, Cloudflare, Equinix, Alibaba

What are the Application segmentation covered in the GPU Cloud Access Technologies Market report?

Ans: The Applications covered in the GPU Cloud Access Technologies Market report are IT & Telecom, Healthcare, Automotive, Finance, Entertainment & Media, Retail & eCommerce, Manufacturing Automotion, Energy & Utilities, Education

What are the Type segmentation covered in the GPU Cloud Access Technologies Market report?

Ans: The Types covered in the GPU Cloud Access Technologies Market report are GPU Cloud Compute Instances, GPU Virtualization, GPU-as-a-Service (GaaS), Others

1 Study Coverage
1.1 Introduction to GPU Cloud Access Technologies: Definition, Properties, and Key Attributes
1.2 Market Segmentation by Type
1.2.1 Global GPU Cloud Access Technologies Market Size by Type, 2020 VS 2024 VS 2031
1.2.2 GPU Cloud Compute Instances
1.2.3 GPU Virtualization
1.2.4 GPU-as-a-Service (GaaS)
1.2.5 Others
1.3 Market Segmentation by Application
1.3.1 Global GPU Cloud Access Technologies Market Size by Application, 2020 VS 2024 VS 2031
1.3.2 IT & Telecom
1.3.3 Healthcare
1.3.4 Automotive
1.3.5 Finance
1.3.6 Entertainment & Media
1.3.7 Retail & eCommerce
1.3.8 Manufacturing Automotion
1.3.9 Energy & Utilities
1.3.10 Education
1.4 Assumptions and Limitations
1.5 Study Objectives
1.6 Years Considered
2 Executive Summary
2.1 Global GPU Cloud Access Technologies Revenue Estimates and Forecasts 2020-2031
2.2 Global GPU Cloud Access Technologies Revenue by Region
2.2.1 Revenue Comparison: 2020 VS 2024 VS 2031
2.2.2 Historical and Forecasted Revenue by Region (2020-2031)
2.2.3 Global Revenue Market Share by Region (2020-2031)
2.2.4 Emerging Market Focus: Growth Drivers & Investment Trends
3 Competition by Players
3.1 Global GPU Cloud Access Technologies Player Revenue Rankings and Profitability
3.1.1 Global Revenue (Value) by Players (2020-2025)
3.1.2 Global Key Player Revenue Ranking (2023 vs. 2024)
3.1.3 Revenue-Based Tier Segmentation (Tier 1, Tier 2, and Tier 3)
3.1.4 Gross Margin by Top Player (2020 VS 2024)
3.2 Global GPU Cloud Access Technologies Companies Headquarters and Service Footprint
3.3 Main Product Type Market Size by Players
3.3.1 GPU Cloud Compute Instances Market Size by Players
3.3.2 GPU Virtualization Market Size by Players
3.3.3 GPU-as-a-Service (GaaS) Market Size by Players
3.3.4 Others Market Size by Players
3.4 Global GPU Cloud Access Technologies Market Concentration and Dynamics
3.4.1 Global Market Concentration (CR5 and HHI)
3.4.2 Entrant/Exit Impact Analysis
3.4.3 Strategic Moves: M&A, Expansion, R&D Investment
4 Global Product Segmentation Analysis
4.1 Global GPU Cloud Access Technologies Revenue Trends by Type
4.1.1 Global Historical and Forecasted Revenue by Type (2020-2031)
4.1.2 Global Revenue Market Share by Type (2020-2031)
4.2 Key Product Attributes and Differentiation
4.3 Subtype Dynamics: Growth Leaders, Profitability and Risk
4.3.1 High-Growth Niches and Adoption Drivers
4.3.2 Profitability Hotspots and Cost Drivers
4.3.3 Substitution Threats
5 Global Downstream Application Analysis
5.1 Global GPU Cloud Access Technologies Revenue by Application
5.1.1 Global Historical and Forecasted Revenue by Application (2020-2031)
5.1.2 Revenue Market Share by Application (2020-2031)
5.1.3 High-Growth Application Identification
5.1.4 Emerging Application Case Studies
5.2 Downstream Customer Analysis
5.2.1 Top Customers by Region
5.2.2 Top Customers by Application
6 North America
6.1 North America Market Size (2020-2031)
6.2 North America Key Players Revenue in 2024
6.3 North America GPU Cloud Access Technologies Market Size by Type (2020-2031)
6.4 North America GPU Cloud Access Technologies Market Size by Application (2020-2031)
6.5 North America Growth Accelerators and Market Barriers
6.6 North America GPU Cloud Access Technologies Market Size by Country
6.6.1 North America Revenue Trends by Country
6.6.2 US
6.6.3 Canada
6.6.4 Mexico
7 Europe
7.1 Europe Market Size (2020-2031)
7.2 Europe Key Players Revenue in 2024
7.3 Europe GPU Cloud Access Technologies Market Size by Type (2020-2031)
7.4 Europe GPU Cloud Access Technologies Market Size by Application (2020-2031)
7.5 Europe Growth Accelerators and Market Barriers
7.6 Europe GPU Cloud Access Technologies Market Size by Country
7.6.1 Europe Revenue Trends by Country
7.6.2 Germany
7.6.3 France
7.6.4 U.K.
7.6.5 Italy
7.6.6 Russia
8 Asia-Pacific
8.1 Asia-Pacific Market Size (2020-2031)
8.2 Asia-Pacific Key Players Revenue in 2024
8.3 Asia-Pacific GPU Cloud Access Technologies Market Size by Type (2020-2031)
8.4 Asia-Pacific GPU Cloud Access Technologies Market Size by Application (2020-2031)
8.5 Asia-Pacific Growth Accelerators and Market Barriers
8.6 Asia-Pacific GPU Cloud Access Technologies Market Size by Region
8.6.1 Asia-Pacific Revenue Trends by Region
8.7 China
8.8 Japan
8.9 South Korea
8.10 Australia
8.11 India
8.12 Southeast Asia
8.12.1 Indonesia
8.12.2 Vietnam
8.12.3 Malaysia
8.12.4 Philippines
8.12.5 Singapore
9 Central and South America
9.1 Central and South America Market Size (2020-2031)
9.2 Central and South America Key Players Revenue in 2024
9.3 Central and South America GPU Cloud Access Technologies Market Size by Type (2020-2031)
9.4 Central and South America GPU Cloud Access Technologies Market Size by Application (2020-2031)
9.5 Central and South America Investment Opportunities and Key Challenges
9.6 Central and South America GPU Cloud Access Technologies Market Size by Country
9.6.1 Central and South America Revenue Trends by Country (2020 VS 2024 VS 2031)
9.6.2 Brazil
9.6.3 Argentina
10 Middle East and Africa
10.1 Middle East and Africa Market Size (2020-2031)
10.2 Middle East and Africa Key Players Revenue in 2024
10.3 Middle East and Africa GPU Cloud Access Technologies Market Size by Type (2020-2031)
10.4 Middle East and Africa GPU Cloud Access Technologies Market Size by Application (2020-2031)
10.5 Middle East and Africa Investment Opportunities and Key Challenges
10.6 Middle East and Africa GPU Cloud Access Technologies Market Size by Country
10.6.1 Middle East and Africa Revenue Trends by Country (2020 VS 2024 VS 2031)
10.6.2 GCC Countries
10.6.3 Israel
10.6.4 Egypt
10.6.5 South Africa
11 Corporate Profile
11.1 NVIDIA
11.1.1 NVIDIA Corporation Information
11.1.2 NVIDIA Business Overview
11.1.3 NVIDIA GPU Cloud Access Technologies Product Features and Attributes
11.1.4 NVIDIA GPU Cloud Access Technologies Revenue and Gross Margin (2020-2025)
11.1.5 NVIDIA GPU Cloud Access Technologies Revenue by Product in 2024
11.1.6 NVIDIA GPU Cloud Access Technologies Revenue by Application in 2024
11.1.7 NVIDIA GPU Cloud Access Technologies Revenue by Geographic Area in 2024
11.1.8 NVIDIA GPU Cloud Access Technologies SWOT Analysis
11.1.9 NVIDIA Recent Developments
11.2 AWS
11.2.1 AWS Corporation Information
11.2.2 AWS Business Overview
11.2.3 AWS GPU Cloud Access Technologies Product Features and Attributes
11.2.4 AWS GPU Cloud Access Technologies Revenue and Gross Margin (2020-2025)
11.2.5 AWS GPU Cloud Access Technologies Revenue by Product in 2024
11.2.6 AWS GPU Cloud Access Technologies Revenue by Application in 2024
11.2.7 AWS GPU Cloud Access Technologies Revenue by Geographic Area in 2024
11.2.8 AWS GPU Cloud Access Technologies SWOT Analysis
11.2.9 AWS Recent Developments
11.3 Google
11.3.1 Google Corporation Information
11.3.2 Google Business Overview
11.3.3 Google GPU Cloud Access Technologies Product Features and Attributes
11.3.4 Google GPU Cloud Access Technologies Revenue and Gross Margin (2020-2025)
11.3.5 Google GPU Cloud Access Technologies Revenue by Product in 2024
11.3.6 Google GPU Cloud Access Technologies Revenue by Application in 2024
11.3.7 Google GPU Cloud Access Technologies Revenue by Geographic Area in 2024
11.3.8 Google GPU Cloud Access Technologies SWOT Analysis
11.3.9 Google Recent Developments
11.4 Microsoft
11.4.1 Microsoft Corporation Information
11.4.2 Microsoft Business Overview
11.4.3 Microsoft GPU Cloud Access Technologies Product Features and Attributes
11.4.4 Microsoft GPU Cloud Access Technologies Revenue and Gross Margin (2020-2025)
11.4.5 Microsoft GPU Cloud Access Technologies Revenue by Product in 2024
11.4.6 Microsoft GPU Cloud Access Technologies Revenue by Application in 2024
11.4.7 Microsoft GPU Cloud Access Technologies Revenue by Geographic Area in 2024
11.4.8 Microsoft GPU Cloud Access Technologies SWOT Analysis
11.4.9 Microsoft Recent Developments
11.5 Oracle
11.5.1 Oracle Corporation Information
11.5.2 Oracle Business Overview
11.5.3 Oracle GPU Cloud Access Technologies Product Features and Attributes
11.5.4 Oracle GPU Cloud Access Technologies Revenue and Gross Margin (2020-2025)
11.5.5 Oracle GPU Cloud Access Technologies Revenue by Product in 2024
11.5.6 Oracle GPU Cloud Access Technologies Revenue by Application in 2024
11.5.7 Oracle GPU Cloud Access Technologies Revenue by Geographic Area in 2024
11.5.8 Oracle GPU Cloud Access Technologies SWOT Analysis
11.5.9 Oracle Recent Developments
11.6 IBM
11.6.1 IBM Corporation Information
11.6.2 IBM Business Overview
11.6.3 IBM GPU Cloud Access Technologies Product Features and Attributes
11.6.4 IBM GPU Cloud Access Technologies Revenue and Gross Margin (2020-2025)
11.6.5 IBM Recent Developments
11.7 Anyscale
11.7.1 Anyscale Corporation Information
11.7.2 Anyscale Business Overview
11.7.3 Anyscale GPU Cloud Access Technologies Product Features and Attributes
11.7.4 Anyscale GPU Cloud Access Technologies Revenue and Gross Margin (2020-2025)
11.7.5 Anyscale Recent Developments
11.8 Hugging Face
11.8.1 Hugging Face Corporation Information
11.8.2 Hugging Face Business Overview
11.8.3 Hugging Face GPU Cloud Access Technologies Product Features and Attributes
11.8.4 Hugging Face GPU Cloud Access Technologies Revenue and Gross Margin (2020-2025)
11.8.5 Hugging Face Recent Developments
11.9 Meta
11.9.1 Meta Corporation Information
11.9.2 Meta Business Overview
11.9.3 Meta GPU Cloud Access Technologies Product Features and Attributes
11.9.4 Meta GPU Cloud Access Technologies Revenue and Gross Margin (2020-2025)
11.9.5 Meta Recent Developments
11.10 Tesla
11.10.1 Tesla Corporation Information
11.10.2 Tesla Business Overview
11.10.3 Tesla GPU Cloud Access Technologies Product Features and Attributes
11.10.4 Tesla GPU Cloud Access Technologies Revenue and Gross Margin (2020-2025)
11.10.5 Company Ten Recent Developments
11.11 Paperspace
11.11.1 Paperspace Corporation Information
11.11.2 Paperspace Business Overview
11.11.3 Paperspace GPU Cloud Access Technologies Product Features and Attributes
11.11.4 Paperspace GPU Cloud Access Technologies Revenue and Gross Margin (2020-2025)
11.11.5 Paperspace Recent Developments
11.12 Vast.ai
11.12.1 Vast.ai Corporation Information
11.12.2 Vast.ai Business Overview
11.12.3 Vast.ai GPU Cloud Access Technologies Product Features and Attributes
11.12.4 Vast.ai GPU Cloud Access Technologies Revenue and Gross Margin (2020-2025)
11.12.5 Vast.ai Recent Developments
11.13 Cerebras
11.13.1 Cerebras Corporation Information
11.13.2 Cerebras Business Overview
11.13.3 Cerebras GPU Cloud Access Technologies Product Features and Attributes
11.13.4 Cerebras GPU Cloud Access Technologies Revenue and Gross Margin (2020-2025)
11.13.5 Cerebras Recent Developments
11.14 Lambda Labs
11.14.1 Lambda Labs Corporation Information
11.14.2 Lambda Labs Business Overview
11.14.3 Lambda Labs GPU Cloud Access Technologies Product Features and Attributes
11.14.4 Lambda Labs GPU Cloud Access Technologies Revenue and Gross Margin (2020-2025)
11.14.5 Lambda Labs Recent Developments
11.15 Fathom
11.15.1 Fathom Corporation Information
11.15.2 Fathom Business Overview
11.15.3 Fathom GPU Cloud Access Technologies Product Features and Attributes
11.15.4 Fathom GPU Cloud Access Technologies Revenue and Gross Margin (2020-2025)
11.15.5 Fathom Recent Developments
11.16 Run.ai
11.16.1 Run.ai Corporation Information
11.16.2 Run.ai Business Overview
11.16.3 Run.ai GPU Cloud Access Technologies Product Features and Attributes
11.16.4 Run.ai GPU Cloud Access Technologies Revenue and Gross Margin (2020-2025)
11.16.5 Run.ai Recent Developments
11.17 Intel
11.17.1 Intel Corporation Information
11.17.2 Intel Business Overview
11.17.3 Intel GPU Cloud Access Technologies Product Features and Attributes
11.17.4 Intel GPU Cloud Access Technologies Revenue and Gross Margin (2020-2025)
11.17.5 Intel Recent Developments
11.18 Cloudflare
11.18.1 Cloudflare Corporation Information
11.18.2 Cloudflare Business Overview
11.18.3 Cloudflare GPU Cloud Access Technologies Product Features and Attributes
11.18.4 Cloudflare GPU Cloud Access Technologies Revenue and Gross Margin (2020-2025)
11.18.5 Cloudflare Recent Developments
11.19 Equinix
11.19.1 Equinix Corporation Information
11.19.2 Equinix Business Overview
11.19.3 Equinix GPU Cloud Access Technologies Product Features and Attributes
11.19.4 Equinix GPU Cloud Access Technologies Revenue and Gross Margin (2020-2025)
11.19.5 Equinix Recent Developments
11.20 Alibaba
11.20.1 Alibaba Corporation Information
11.20.2 Alibaba Business Overview
11.20.3 Alibaba GPU Cloud Access Technologies Product Features and Attributes
11.20.4 Alibaba GPU Cloud Access Technologies Revenue and Gross Margin (2020-2025)
11.20.5 Alibaba Recent Developments
12 GPU Cloud Access TechnologiesIndustry Chain Analysis
12.1 GPU Cloud Access Technologies Industry Chain
12.2 Upstream Analysis
12.2.1 Upstream Key Suppliers
12.3 Middlestream Analysis
12.4 Downstream Sales Model and Distribution Networks
12.4.1 Sales Channels
12.4.2 Distributors
13 GPU Cloud Access Technologies Market Dynamics
13.1 Industry Trends and Evolution
13.2 Market Growth Drivers and Emerging Opportunities
13.3 Market Challenges, Risks, and Restraints
14 Key Findings in the Global GPU Cloud Access Technologies Study
15 Appendix
15.1 Research Methodology
15.1.1 Methodology/Research Approach
15.1.1.1 Research Programs/Design
15.1.1.2 Market Size Estimation
15.1.1.3 Market Breakdown and Data Triangulation
15.1.2 Data Source
15.1.2.1 Secondary Sources
15.1.2.2 Primary Sources
15.2 Author Details
List of Tables
 Table 1. Global GPU Cloud Access Technologies Market Size Growth Rate by Type, 2020 VS 2024 VS 2031 (US$ Million)
 Table 2. Global GPU Cloud Access Technologies Market Size Growth Rate by Application, 2020 VS 2024 VS 2031 (US$ Million)
 Table 3. Global GPU Cloud Access Technologies Revenue Grow Rate (CAGR) by Region: 2020 VS 2024 VS 2031 (US$ Million)
 Table 4. Global GPU Cloud Access Technologies Revenue by Region (2020-2025) & (US$ Million)
 Table 5. Global GPU Cloud Access Technologies Revenue by Region (2026-2031) & (US$ Million)
 Table 6. Emerging Market Revenue Grow Rate (CAGR) by Country (2020 VS 2024 VS 2031) (US$ Million)
 Table 7. Global GPU Cloud Access Technologies Revenue by Players (2020-2025) & (US$ Million)
 Table 8. Global GPU Cloud Access Technologies Revenue Market Share by Players (2020-2025)
 Table 9. Global Key Players’Ranking Shift (2023 vs. 2024) (Based on Revenue)
 Table 10. Global GPU Cloud Access Technologies by Player Tier (Tier 1, Tier 2, and Tier 3) & (based on the Revenue in GPU Cloud Access Technologies as of 2024)
 Table 11. Global GPU Cloud Access Technologies Average Gross Margin (%) by Player (2020 VS 2024)
 Table 12. Global GPU Cloud Access Technologies Companies Headquarters
 Table 13. Global GPU Cloud Access Technologies Market Concentration Ratio (CR5 and HHI)
 Table 14. Key Market Entrant/Exit (2020-2024) – Drivers & Impact Analysis
 Table 15. Key Mergers & Acquisitions, Expansion Plans, R&D Investment
 Table 16. Global GPU Cloud Access Technologies Revenue by Type (2020-2025) & (US$ Million)
 Table 17. Global GPU Cloud Access Technologies Revenue by Type (2026-2031) & (US$ Million)
 Table 18. Key Product Attributes and Differentiation
 Table 19. Global GPU Cloud Access Technologies Revenue by Application (2020-2025) & (US$ Million)
 Table 20. Global GPU Cloud Access Technologies Revenue by Application (2026-2031) & (US$ Million)
 Table 21. GPU Cloud Access Technologies High-Growth Sectors Demand CAGR (2024-2031)
 Table 22. Top Customers by Region
 Table 23. Top Customers by Application
 Table 24. North America GPU Cloud Access Technologies Growth Accelerators and Market Barriers
 Table 25. North America GPU Cloud Access Technologies Revenue Grow Rate (CAGR) by Country (2020 VS 2024 VS 2031) (US$ Million)
 Table 26. Europe GPU Cloud Access Technologies Growth Accelerators and Market Barriers
 Table 27. Europe GPU Cloud Access Technologies Revenue Grow Rate (CAGR) by Country: 2020 VS 2024 VS 2031 (US$ Million)
 Table 28. Asia-Pacific GPU Cloud Access Technologies Growth Accelerators and Market Barriers
 Table 29. Asia-Pacific GPU Cloud Access Technologies Revenue Grow Rate (CAGR) by Region: 2020 VS 2024 VS 2031 (US$ Million)
 Table 30. Central and South America GPU Cloud Access Technologies Investment Opportunities and Key Challenges
 Table 31. Central and South America GPU Cloud Access Technologies Revenue Grow Rate (CAGR) by Country (2020 VS 2024 VS 2031) (US$ Million)
 Table 32. Middle East and Africa GPU Cloud Access Technologies Investment Opportunities and Key Challenges
 Table 33. Middle East and Africa GPU Cloud Access Technologies Revenue Grow Rate (CAGR) by Country (2020 VS 2024 VS 2031) (US$ Million)
 Table 34. NVIDIA Corporation Information
 Table 35. NVIDIA Description and Major Businesses
 Table 36. NVIDIA Product Features and Attributes
 Table 37. NVIDIA Revenue (US$ Million) and Gross Margin (2020-2025)
 Table 38. NVIDIA Revenue Proportion by Product in 2024
 Table 39. NVIDIA Revenue Proportion by Application in 2024
 Table 40. NVIDIA Revenue Proportion by Geographic Area in 2024
 Table 41. NVIDIA GPU Cloud Access Technologies SWOT Analysis
 Table 42. NVIDIA Recent Developments
 Table 43. AWS Corporation Information
 Table 44. AWS Description and Major Businesses
 Table 45. AWS Product Features and Attributes
 Table 46. AWS Revenue (US$ Million) and Gross Margin (2020-2025)
 Table 47. AWS Revenue Proportion by Product in 2024
 Table 48. AWS Revenue Proportion by Application in 2024
 Table 49. AWS Revenue Proportion by Geographic Area in 2024
 Table 50. AWS GPU Cloud Access Technologies SWOT Analysis
 Table 51. AWS Recent Developments
 Table 52. Google Corporation Information
 Table 53. Google Description and Major Businesses
 Table 54. Google Product Features and Attributes
 Table 55. Google Revenue (US$ Million) and Gross Margin (2020-2025)
 Table 56. Google Revenue Proportion by Product in 2024
 Table 57. Google Revenue Proportion by Application in 2024
 Table 58. Google Revenue Proportion by Geographic Area in 2024
 Table 59. Google GPU Cloud Access Technologies SWOT Analysis
 Table 60. Google Recent Developments
 Table 61. Microsoft Corporation Information
 Table 62. Microsoft Description and Major Businesses
 Table 63. Microsoft Product Features and Attributes
 Table 64. Microsoft Revenue (US$ Million) and Gross Margin (2020-2025)
 Table 65. Microsoft Revenue Proportion by Product in 2024
 Table 66. Microsoft Revenue Proportion by Application in 2024
 Table 67. Microsoft Revenue Proportion by Geographic Area in 2024
 Table 68. Microsoft GPU Cloud Access Technologies SWOT Analysis
 Table 69. Microsoft Recent Developments
 Table 70. Oracle Corporation Information
 Table 71. Oracle Description and Major Businesses
 Table 72. Oracle Product Features and Attributes
 Table 73. Oracle Revenue (US$ Million) and Gross Margin (2020-2025)
 Table 74. Oracle Revenue Proportion by Product in 2024
 Table 75. Oracle Revenue Proportion by Application in 2024
 Table 76. Oracle Revenue Proportion by Geographic Area in 2024
 Table 77. Oracle GPU Cloud Access Technologies SWOT Analysis
 Table 78. Oracle Recent Developments
 Table 79. IBM Corporation Information
 Table 80. IBM Description and Major Businesses
 Table 81. IBM Product Features and Attributes
 Table 82. IBM Revenue (US$ Million) and Gross Margin (2020-2025)
 Table 83. IBM Recent Developments
 Table 84. Anyscale Corporation Information
 Table 85. Anyscale Description and Major Businesses
 Table 86. Anyscale Product Features and Attributes
 Table 87. Anyscale Revenue (US$ Million) and Gross Margin (2020-2025)
 Table 88. Anyscale Recent Developments
 Table 89. Hugging Face Corporation Information
 Table 90. Hugging Face Description and Major Businesses
 Table 91. Hugging Face Product Features and Attributes
 Table 92. Hugging Face Revenue (US$ Million) and Gross Margin (2020-2025)
 Table 93. Hugging Face Recent Developments
 Table 94. Meta Corporation Information
 Table 95. Meta Description and Major Businesses
 Table 96. Meta Product Features and Attributes
 Table 97. Meta Revenue (US$ Million) and Gross Margin (2020-2025)
 Table 98. Meta Recent Developments
 Table 99. Tesla Corporation Information
 Table 100. Tesla Description and Major Businesses
 Table 101. Tesla Product Features and Attributes
 Table 102. Tesla Revenue (US$ Million) and Gross Margin (2020-2025)
 Table 103. Tesla Recent Developments
 Table 104. Paperspace Corporation Information
 Table 105. Paperspace Description and Major Businesses
 Table 106. Paperspace Product Features and Attributes
 Table 107. Paperspace Revenue (US$ Million) and Gross Margin (2020-2025)
 Table 108. Paperspace Recent Developments
 Table 109. Vast.ai Corporation Information
 Table 110. Vast.ai Description and Major Businesses
 Table 111. Vast.ai Product Features and Attributes
 Table 112. Vast.ai Revenue (US$ Million) and Gross Margin (2020-2025)
 Table 113. Vast.ai Recent Developments
 Table 114. Cerebras Corporation Information
 Table 115. Cerebras Description and Major Businesses
 Table 116. Cerebras Product Features and Attributes
 Table 117. Cerebras Revenue (US$ Million) and Gross Margin (2020-2025)
 Table 118. Cerebras Recent Developments
 Table 119. Lambda Labs Corporation Information
 Table 120. Lambda Labs Description and Major Businesses
 Table 121. Lambda Labs Product Features and Attributes
 Table 122. Lambda Labs Revenue (US$ Million) and Gross Margin (2020-2025)
 Table 123. Lambda Labs Recent Developments
 Table 124. Fathom Corporation Information
 Table 125. Fathom Description and Major Businesses
 Table 126. Fathom Product Features and Attributes
 Table 127. Fathom Revenue (US$ Million) and Gross Margin (2020-2025)
 Table 128. Fathom Recent Developments
 Table 129. Run.ai Corporation Information
 Table 130. Run.ai Description and Major Businesses
 Table 131. Run.ai Product Features and Attributes
 Table 132. Run.ai Revenue (US$ Million) and Gross Margin (2020-2025)
 Table 133. Run.ai Recent Developments
 Table 134. Intel Corporation Information
 Table 135. Intel Description and Major Businesses
 Table 136. Intel Product Features and Attributes
 Table 137. Intel Revenue (US$ Million) and Gross Margin (2020-2025)
 Table 138. Intel Recent Developments
 Table 139. Cloudflare Corporation Information
 Table 140. Cloudflare Description and Major Businesses
 Table 141. Cloudflare Product Features and Attributes
 Table 142. Cloudflare Revenue (US$ Million) and Gross Margin (2020-2025)
 Table 143. Cloudflare Recent Developments
 Table 144. Equinix Corporation Information
 Table 145. Equinix Description and Major Businesses
 Table 146. Equinix Product Features and Attributes
 Table 147. Equinix Revenue (US$ Million) and Gross Margin (2020-2025)
 Table 148. Equinix Recent Developments
 Table 149. Alibaba Corporation Information
 Table 150. Alibaba Description and Major Businesses
 Table 151. Alibaba Product Features and Attributes
 Table 152. Alibaba Revenue (US$ Million) and Gross Margin (2020-2025)
 Table 153. Alibaba Recent Developments
 Table 154. Raw Materials Key Suppliers
 Table 155. Distributors List
 Table 156. Market Trends and Market Evolution
 Table 157. Market Drivers and Opportunities
 Table 158. Market Challenges, Risks, and Restraints
 Table 159. Research Programs/Design for This Report
 Table 160. Key Data Information from Secondary Sources
 Table 161. Key Data Information from Primary Sources


List of Figures
 Figure 1. GPU Cloud Access Technologies Product Picture
 Figure 2. Global GPU Cloud Access Technologies Market Size Growth Rate by Type, 2020 VS 2024 VS 2031 (US$ Million)
 Figure 3. GPU Cloud Compute Instances Product Picture
 Figure 4. GPU Virtualization Product Picture
 Figure 5. GPU-as-a-Service (GaaS) Product Picture
 Figure 6. Others Product Picture
 Figure 7. Global GPU Cloud Access Technologies Market Size Growth Rate by Application, 2020 VS 2024 VS 2031 (US$ Million)
 Figure 8. IT & Telecom
 Figure 9. Healthcare
 Figure 10. Automotive
 Figure 11. Finance
 Figure 12. Entertainment & Media
 Figure 13. Retail & eCommerce
 Figure 14. Manufacturing Automotion
 Figure 15. Energy & Utilities
 Figure 16. Education
 Figure 17. GPU Cloud Access Technologies Report Years Considered
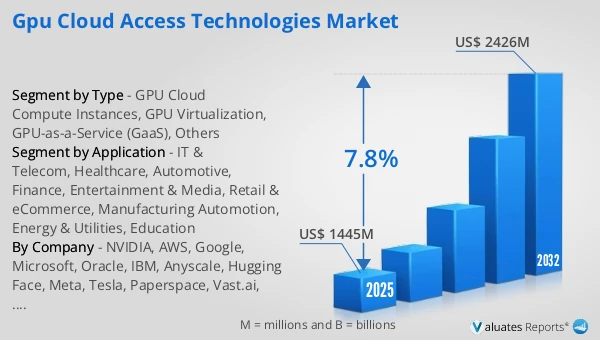
 Figure 18. Global GPU Cloud Access Technologies Revenue, (US$ Million), 2020 VS 2024 VS 2031
 Figure 19. Global GPU Cloud Access Technologies Revenue (2020-2031) & (US$ Million)
 Figure 20. Global GPU Cloud Access Technologies Revenue (CAGR) by Region: 2020 VS 2024 VS 2031 (US$ Million)
 Figure 21. Global GPU Cloud Access Technologies Revenue Market Share by Region (2020-2031)
 Figure 22. Global GPU Cloud Access Technologies Revenue Market Share Ranking (2024)
 Figure 23. Tier Distribution by Revenue Contribution (2020 VS 2024)
 Figure 24. GPU Cloud Compute Instances Revenue Market Share by Player in 2024
 Figure 25. GPU Virtualization Revenue Market Share by Player in 2024
 Figure 26. GPU-as-a-Service (GaaS) Revenue Market Share by Player in 2024
 Figure 27. Others Revenue Market Share by Player in 2024
 Figure 28. Global GPU Cloud Access Technologies Revenue Market Share by Type (2020-2031)
 Figure 29. Global GPU Cloud Access Technologies Revenue Market Share by Application (2020-2031)
 Figure 30. North America GPU Cloud Access Technologies Revenue YoY (2020-2031) & (US$ Million)
 Figure 31. North America Top 5 Players GPU Cloud Access Technologies Revenue (US$ Million) in 2024
 Figure 32. North America GPU Cloud Access Technologies Revenue (US$ Million) by Type (2020 - 2031)
 Figure 33. North America GPU Cloud Access Technologies Revenue (US$ Million) by Application (2020-2031)
 Figure 34. US GPU Cloud Access Technologies Revenue (2020-2031) & (US$ Million)
 Figure 35. Canada GPU Cloud Access Technologies Revenue (2020-2031) & (US$ Million)
 Figure 36. Mexico GPU Cloud Access Technologies Revenue (2020-2031) & (US$ Million)
 Figure 37. Europe GPU Cloud Access Technologies Revenue YoY (2020-2031) & (US$ Million)
 Figure 38. Europe Top 5 Players GPU Cloud Access Technologies Revenue (US$ Million) in 2024
 Figure 39. Europe GPU Cloud Access Technologies Revenue (US$ Million) by Type (2020-2031)
 Figure 40. Europe GPU Cloud Access Technologies Revenue (US$ Million) by Application (2020-2031)
 Figure 41. Germany GPU Cloud Access Technologies Revenue (2020-2031) & (US$ Million)
 Figure 42. France GPU Cloud Access Technologies Revenue (2020-2031) & (US$ Million)
 Figure 43. U.K. GPU Cloud Access Technologies Revenue (2020-2031) & (US$ Million)
 Figure 44. Italy GPU Cloud Access Technologies Revenue (2020-2031) & (US$ Million)
 Figure 45. Russia GPU Cloud Access Technologies Revenue (2020-2031) & (US$ Million)
 Figure 46. Asia-Pacific GPU Cloud Access Technologies Revenue YoY (2020-2031) & (US$ Million)
 Figure 47. Asia-Pacific Top 8 Players GPU Cloud Access Technologies Revenue (US$ Million) in 2024
 Figure 48. Asia-Pacific GPU Cloud Access Technologies Revenue (US$ Million) by Type (2020-2031)
 Figure 49. Asia-Pacific GPU Cloud Access Technologies Revenue (US$ Million) by Application (2020-2031)
 Figure 50. Indonesia GPU Cloud Access Technologies Revenue (2020-2031) & (US$ Million)
 Figure 51. Japan GPU Cloud Access Technologies Revenue (2020-2031) & (US$ Million)
 Figure 52. South Korea GPU Cloud Access Technologies Revenue (2020-2031) & (US$ Million)
 Figure 53. Australia GPU Cloud Access Technologies Revenue (2020-2031) & (US$ Million)
 Figure 54. India GPU Cloud Access Technologies Revenue (2020-2031) & (US$ Million)
 Figure 55. Indonesia GPU Cloud Access Technologies Revenue (2020-2031) & (US$ Million)
 Figure 56. Vietnam GPU Cloud Access Technologies Revenue (2020-2031) & (US$ Million)
 Figure 57. Malaysia GPU Cloud Access Technologies Revenue (2020-2031) & (US$ Million)
 Figure 58. Philippines GPU Cloud Access Technologies Revenue (2020-2031) & (US$ Million)
 Figure 59. Singapore GPU Cloud Access Technologies Revenue (2020-2031) & (US$ Million)
 Figure 60. Central and South America GPU Cloud Access Technologies Revenue YoY (2020-2031) & (US$ Million)
 Figure 61. Central and South America Top 5 Players GPU Cloud Access Technologies Revenue (US$ Million) in 2024
 Figure 62. Central and South America GPU Cloud Access Technologies Revenue (US$ Million) by Type (2020-2031)
 Figure 63. Central and South America GPU Cloud Access Technologies Revenue (US$ Million) by Application (2020-2031)
 Figure 64. Brazil GPU Cloud Access Technologies Revenue (2020-2025) & (US$ Million)
 Figure 65. Argentina GPU Cloud Access Technologies Revenue (2020-2025) & (US$ Million)
 Figure 66. Middle East and Africa GPU Cloud Access Technologies Revenue YoY (2020-2031) & (US$ Million)
 Figure 67. Middle East and Africa Top 5 Players GPU Cloud Access Technologies Revenue (US$ Million) in 2024
 Figure 68. South America GPU Cloud Access Technologies Revenue (US$ Million) by Type (2020-2031)
 Figure 69. Middle East and Africa GPU Cloud Access Technologies Revenue (US$ Million) by Application (2020-2031)
 Figure 70. GCC Countries GPU Cloud Access Technologies Revenue (2020-2025) & (US$ Million)
 Figure 71. Israel GPU Cloud Access Technologies Revenue (2020-2025) & (US$ Million)
 Figure 72. Egypt GPU Cloud Access Technologies Revenue (2020-2025) & (US$ Million)
 Figure 73. South Africa GPU Cloud Access Technologies Revenue (2020-2025) & (US$ Million)
 Figure 74. GPU Cloud Access Technologies Industry Chain Mapping
 Figure 75. Channels of Distribution (Direct Vs Distribution)
 Figure 76. Bottom-up and Top-down Approaches for This Report
 Figure 77. Data Triangulation
 Figure 78. Key Executives Interviewed
SELECT A FORMAT
Added to Cart
Electronic (PDF)

$4900

This license allows only one user to access the PDF.
Electronic (PDF)

$7350

This license allows 1 - 5 user to access the PDF, license is suitable for small groups of 5 users working together
Electronic (PDF)

$9800

This license allows users/teams in a same Enterprise to use this report, various departments within an enterpise can use this report
Add to Cart
Buy Now (15% Discount)

OUR CUSTOMER

Accenture

SIMILAR REPORTS