FEATURED COMPANIES
Amphenol
Aptiv
Yonggui Electric
High Voltage Connectors For Energy Vehicle Market Size
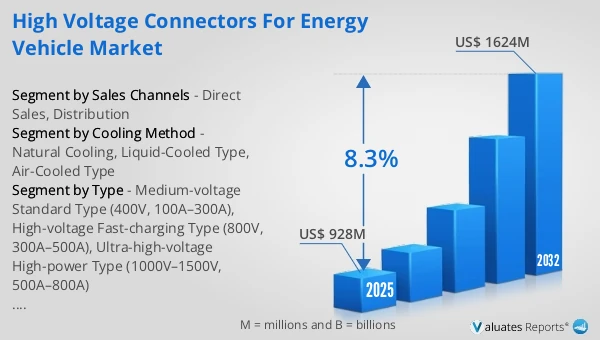
The global High Voltage Connectors For Energy Vehicle market was valued at US$ 928 million in 2025 and is anticipated to reach US$ 1624 million by 2032, at a CAGR of 8.3% from 2026 to 2032.
High Voltage Connectors For Energy Vehicle Market
The 2025 U.S. tariff policies introduce profound uncertainty into the global economic landscape. This report critically examines the implications of recent tariff adjustments and international strategic countermeasures on High Voltage Connectors For Energy Vehicle competitive dynamics, regional economic interdependencies, and supply chain reconfigurations.
New energy vehicle high-voltage connectors are designed to interface with the vehicle's high-voltage circuitry (primarily 400V/800V, with some commercial vehicles reaching 1500V), handling high-voltage, high-current (100A–800A) transmission, signal exchange, and safety interlocking. These interconnect components facilitate electrical connections between high-voltage components such as battery packs, motors/motor controllers, PDUs/BDUs, OBCs, DC/DC converters, and charging systems. They serve as the critical ‘lifeline’ ensuring the safe, efficient, and reliable operation of new energy vehicle high-voltage systems..
Global sales of high-voltage connectors for new energy vehicles reached 131.48 million units in 2025, with an average price of US$7.06 per unit.
Core Development Trends
High-voltage and fast-charging evolution: 800V platforms accelerate market penetration, with 800V models accounting for 28% of sales in 2024, projected to rise to 65% by 2030. This drives liquid-cooled high-voltage connectors to exceed 70% market share. Commercial vehicles upgrade to 1500V ultra-high voltage, with currents exceeding 800A.
Integration and Lightweighting: Transitioning from single-function connectors to integrated solutions combining ‘connection + thermal management + signal transmission + HVIL’, utilising monolithic moulding and lightweight materials (e.g., aluminium alloys/composites) to reduce product weight by over 30% and volume by 25%.
Intelligent and High Reliability: Integrates real-time monitoring of temperature, current, and insulation, supports CAN/LIN communication and remote diagnostics, with predictive maintenance reducing failure rates. Mating cycles enhanced to 10,000, and protection upgraded to IP68/IP69K.
This report delivers a comprehensive overview of the global High Voltage Connectors For Energy Vehicle market, with both quantitative and qualitative analyses, to help readers develop growth strategies, assess the competitive landscape, evaluate their position in the current market, and make informed business decisions regarding High Voltage Connectors For Energy Vehicle. The High Voltage Connectors For Energy Vehicle market size, estimates, and forecasts are provided in terms of output/shipments (M Units) and revenue (US$ millions), with 2025 as the base year and historical and forecast data for 2021–2032.
The report segments the global High Voltage Connectors For Energy Vehicle market comprehensively. Regional market sizes by Type, by Application, by Cooling Method, and by company are also provided. For deeper insight, the report profiles the competitive landscape, key competitors, and their respective market rankings, and discusses technological trends and new product developments.
This report will assist High Voltage Connectors For Energy Vehicle manufacturers, new entrants, and companies across the industry value chain with information on revenues, production, and average prices for the overall market and its sub-segments, by company, by Type, by Application, and by region.
Market Segmentation
Scope of High Voltage Connectors For Energy Vehicle Market Report
| Report Metric |
Details |
| Report Name |
High Voltage Connectors For Energy Vehicle Market |
| Accounted market size in 2025 |
US$ 928 million |
| Forecasted market size in 2032 |
US$ 1624 million |
| CAGR |
8.3% |
| Base Year |
2025 |
| Forecasted years |
2026 - 2032 |
| Segment by Type |
- Medium-voltage Standard Type (400V, 100A–300A)
- High-voltage Fast-charging Type (800V, 300A–500A)
- Ultra-high-voltage High-power Type (1000V–1500V, 500A–800A)
|
| Segment by Cooling Method |
- Natural Cooling
- Liquid-Cooled Type
- Air-Cooled Type
|
| Segment by Sales Channels |
- Direct Sales
- Distribution
|
| by Application |
- Passenger Vehicle High-Voltage Circuit
- Commercial Vehicle High-Voltage Circuit
- Charging System
|
| Production by Region |
- North America
- Europe
- China
- Japan
|
| Consumption by Region |
- North America (United States, Canada)
- Europe (Germany, France, UK, Italy, Russia)
- Asia-Pacific (China, Japan, South Korea, Taiwan)
- Southeast Asia (India)
- Latin America (Mexico, Brazil)
|
| By Company |
TE Connectivity, Amphenol, Yazaki, Molex, Rosenberger, JST, Hirose Electric, JONHON, Recodeal, Aptiv, Sumitomo Wiring Systems, ECT, JAE, Woer New Energy Electrical, Guizhou Aerospace Electric, THB Electronics, Yonggui Electric, Luxshare, Laimu Electronic, Kangni |
| Forecast units |
USD million in value |
| Report coverage |
Revenue and volume forecast, company share, competitive landscape, growth factors and trends |
Chapter Outline
- Chapter 1: Defines the scope of the report and presents an executive summary of market segments (by Type, by Application, by Cooling Method, etc.), including the size of each segment and its future growth potential. It offers a high-level view of the current market and its likely evolution in the short, medium, and long term.
- Chapter 2: Provides a detailed analysis of the competitive landscape for High Voltage Connectors For Energy Vehicle manufacturers, including prices, production, value-based market shares, latest development plans, and information on mergers and acquisitions.
- Chapter 3: Examines High Voltage Connectors For Energy Vehicle production/output and value by region and country, providing a quantitative assessment of market size and growth potential for each region over the next six years.
- Chapter 4: Analyzes High Voltage Connectors For Energy Vehicle consumption at the regional and country levels. It quantifies market size and growth potential for each region and its key countries, and outlines market development, outlook, addressable space, and national production.
- Chapter 5: Analyzes market segments by Type, covering the size and growth potential of each segment to help readers identify “blue ocean” opportunities.
- Chapter 6: Analyzes market segments by Application, covering the size and growth potential of each segment to help readers identify “blue ocean” opportunities in downstream markets.
- Chapter 7: Profiles key players, detailing the fundamentals of major companies, including product production/output, value, price, gross margin, product portfolio/introductions, and recent developments.
- Chapter 8: Reviews the industry value chain, including upstream and downstream segments.
- Chapter 9: Discusses market dynamics and recent developments, including drivers, restraints, challenges and risks for manufacturers, U.S. Tariffs and relevant policy analysis.
- Chapter 10: Summarizes the key findings and conclusions of the report.
FAQ for this report
How fast is High Voltage Connectors For Energy Vehicle Market growing?
Ans: The High Voltage Connectors For Energy Vehicle Market witnessing a CAGR of 8.3% during the forecast period 2026-2032.
What is the High Voltage Connectors For Energy Vehicle Market size in 2032?
Ans: The High Voltage Connectors For Energy Vehicle Market size in 2032 will be US$ 1624 million.
Who are the main players in the High Voltage Connectors For Energy Vehicle Market report?
Ans: The main players in the High Voltage Connectors For Energy Vehicle Market are TE Connectivity, Amphenol, Yazaki, Molex, Rosenberger, JST, Hirose Electric, JONHON, Recodeal, Aptiv, Sumitomo Wiring Systems, ECT, JAE, Woer New Energy Electrical, Guizhou Aerospace Electric, THB Electronics, Yonggui Electric, Luxshare, Laimu Electronic, Kangni
What are the Application segmentation covered in the High Voltage Connectors For Energy Vehicle Market report?
Ans: The Applications covered in the High Voltage Connectors For Energy Vehicle Market report are Passenger Vehicle High-Voltage Circuit, Commercial Vehicle High-Voltage Circuit, Charging System
What are the Type segmentation covered in the High Voltage Connectors For Energy Vehicle Market report?
Ans: The Types covered in the High Voltage Connectors For Energy Vehicle Market report are Medium-voltage Standard Type (400V, 100A–300A), High-voltage Fast-charging Type (800V, 300A–500A), Ultra-high-voltage High-power Type (1000V–1500V, 500A–800A)

