List of Tables
Table 1. Global Architectural BIM Software Market Size Growth Rate by Type (US$ Million): 2021 vs 2025 vs 2032
Table 2. Key Players of Cloud-based
Table 3. Key Players of On-premises
Table 4. Global Architectural BIM Software Market Size Growth Rate by Project Phase (US$ Million): 2021 vs 2025 vs 2032
Table 5. Key Players of Design Phase BIM Software
Table 6. Key Players of Construction Phase BIM Software
Table 7. Key Players of Operation and Maintenance Phase BIM Software
Table 8. Key Players of Integrated BIM Platform Throughout the Entire Lifecycle
Table 9. Global Architectural BIM Software Market Size Growth Rate by Collaboration and Management Capabilities (US$ Million): 2021 vs 2025 vs 2032
Table 10. Key Players of Standalone Modeling Tool
Table 11. Key Players of Multi-Disciplinary Collaborative Design
Table 12. Key Players of Cross-Enterprise Collaboration and Project Management Platform
Table 13. Key Players of Owner-Level BIM Management and Delivery Platform
Table 14. Global Architectural BIM Software Market Size Growth by Application (US$ Million): 2021 vs 2025 vs 2032
Table 15. Global Architectural BIM Software Market Size by Region (US$ Million): 2021 vs 2025 vs 2032
Table 16. Global Architectural BIM Software Market Size by Region (US$ Million), 2021–2026
Table 17. Global Architectural BIM Software Market Share by Region (2021–2026)
Table 18. Global Architectural BIM Software Forecasted Market Size by Region (US$ Million), 2027–2032
Table 19. Global Architectural BIM Software Market Share by Region (2027–2032)
Table 20. Architectural BIM Software Market Trends
Table 21. Architectural BIM Software Market Drivers
Table 22. Architectural BIM Software Market Challenges
Table 23. Architectural BIM Software Market Restraints
Table 24. Global Architectural BIM Software Revenue by Players (US$ Million), 2021–2026
Table 25. Global Architectural BIM Software Market Share by Players (2021–2026)
Table 26. Global Top Architectural BIM Software Players by Tier (Tier 1, Tier 2, and Tier 3), based on Architectural BIM Software Revenue, 2025
Table 27. Ranking of Global Top Architectural BIM Software Companies by Revenue (US$ Million) in 2025
Table 28. Global 5 Largest Players Market Share by Architectural BIM Software Revenue (CR5 and HHI), 2021–2026
Table 29. Global Key Players of Architectural BIM Software, Headquarters and Area Served
Table 30. Global Key Players of Architectural BIM Software, Products and Applications
Table 31. Global Key Players of Architectural BIM Software, Date of General Availability (GA)
Table 32. Mergers and Acquisitions, Expansion Plans
Table 33. Global Architectural BIM Software Market Size by Type (US$ Million), 2021–2026
Table 34. Global Architectural BIM Software Revenue Market Share by Type (2021–2026)
Table 35. Global Architectural BIM Software Forecasted Market Size by Type (US$ Million), 2027–2032
Table 36. Global Architectural BIM Software Revenue Market Share by Type (2027–2032)
Table 37. Global Architectural BIM Software Market Size by Application (US$ Million), 2021–2026
Table 38. Global Architectural BIM Software Revenue Market Share by Application (2021–2026)
Table 39. Global Architectural BIM Software Forecasted Market Size by Application (US$ Million), 2027–2032
Table 40. Global Architectural BIM Software Revenue Market Share by Application (2027–2032)
Table 41. North America Architectural BIM Software Market Size Growth Rate by Country (US$ Million): 2021 vs 2025 vs 2032
Table 42. North America Architectural BIM Software Market Size by Country (US$ Million), 2021–2026
Table 43. North America Architectural BIM Software Market Size by Country (US$ Million), 2027–2032
Table 44. Europe Architectural BIM Software Market Size Growth Rate by Country (US$ Million): 2021 vs 2025 vs 2032
Table 45. Europe Architectural BIM Software Market Size by Country (US$ Million), 2021–2026
Table 46. Europe Architectural BIM Software Market Size by Country (US$ Million), 2027–2032
Table 47. Asia-Pacific Architectural BIM Software Market Size Growth Rate by Region (US$ Million): 2021 vs 2025 vs 2032
Table 48. Asia-Pacific Architectural BIM Software Market Size by Region (US$ Million), 2021–2026
Table 49. Asia-Pacific Architectural BIM Software Market Size by Region (US$ Million), 2027–2032
Table 50. Latin America Architectural BIM Software Market Size Growth Rate by Country (US$ Million): 2021 vs 2025 vs 2032
Table 51. Latin America Architectural BIM Software Market Size by Country (US$ Million), 2021–2026
Table 52. Latin America Architectural BIM Software Market Size by Country (US$ Million), 2027–2032
Table 53. Middle East & Africa Architectural BIM Software Market Size Growth Rate by Country (US$ Million): 2021 vs 2025 vs 2032
Table 54. Middle East & Africa Architectural BIM Software Market Size by Country (US$ Million), 2021–2026
Table 55. Middle East & Africa Architectural BIM Software Market Size by Country (US$ Million), 2027–2032
Table 56. Autodesk Company Details
Table 57. Autodesk Business Overview
Table 58. Autodesk Architectural BIM Software Product
Table 59. Autodesk Revenue in Architectural BIM Software Business (US$ Million), 2021–2026
Table 60. Autodesk Recent Development
Table 61. Nemetschek Company Details
Table 62. Nemetschek Business Overview
Table 63. Nemetschek Architectural BIM Software Product
Table 64. Nemetschek Revenue in Architectural BIM Software Business (US$ Million), 2021–2026
Table 65. Nemetschek Recent Development
Table 66. Bentley Systems Company Details
Table 67. Bentley Systems Business Overview
Table 68. Bentley Systems Architectural BIM Software Product
Table 69. Bentley Systems Revenue in Architectural BIM Software Business (US$ Million), 2021–2026
Table 70. Bentley Systems Recent Development
Table 71. Trimble Navigation Company Details
Table 72. Trimble Navigation Business Overview
Table 73. Trimble Navigation Architectural BIM Software Product
Table 74. Trimble Navigation Revenue in Architectural BIM Software Business (US$ Million), 2021–2026
Table 75. Trimble Navigation Recent Development
Table 76. Dassault Systemes Company Details
Table 77. Dassault Systemes Business Overview
Table 78. Dassault Systemes Architectural BIM Software Product
Table 79. Dassault Systemes Revenue in Architectural BIM Software Business (US$ Million), 2021–2026
Table 80. Dassault Systemes Recent Development
Table 81. RIB Software Company Details
Table 82. RIB Software Business Overview
Table 83. RIB Software Architectural BIM Software Product
Table 84. RIB Software Revenue in Architectural BIM Software Business (US$ Million), 2021–2026
Table 85. RIB Software Recent Development
Table 86. Robert Mcneel & Associates Company Details
Table 87. Robert Mcneel & Associates Business Overview
Table 88. Robert Mcneel & Associates Architectural BIM Software Product
Table 89. Robert Mcneel & Associates Revenue in Architectural BIM Software Business (US$ Million), 2021–2026
Table 90. Robert Mcneel & Associates Recent Development
Table 91. Siemens Company Details
Table 92. Siemens Business Overview
Table 93. Siemens Architectural BIM Software Product
Table 94. Siemens Revenue in Architectural BIM Software Business (US$ Million), 2021–2026
Table 95. Siemens Recent Development
Table 96. AVEVA Group Company Details
Table 97. AVEVA Group Business Overview
Table 98. AVEVA Group Architectural BIM Software Product
Table 99. AVEVA Group Revenue in Architectural BIM Software Business (US$ Million), 2021–2026
Table 100. AVEVA Group Recent Development
Table 101. Oracle Aconex Company Details
Table 102. Oracle Aconex Business Overview
Table 103. Oracle Aconex Architectural BIM Software Product
Table 104. Oracle Aconex Revenue in Architectural BIM Software Business (US$ Million), 2021–2026
Table 105. Oracle Aconex Recent Development
Table 106. Beck Technology Company Details
Table 107. Beck Technology Business Overview
Table 108. Beck Technology Architectural BIM Software Product
Table 109. Beck Technology Revenue in Architectural BIM Software Business (US$ Million), 2021–2026
Table 110. Beck Technology Recent Development
Table 111. Innovaya Company Details
Table 112. Innovaya Business Overview
Table 113. Innovaya Architectural BIM Software Product
Table 114. Innovaya Revenue in Architectural BIM Software Business (US$ Million), 2021–2026
Table 115. Innovaya Recent Development
Table 116. IES Company Details
Table 117. IES Business Overview
Table 118. IES Architectural BIM Software Product
Table 119. IES Revenue in Architectural BIM Software Business (US$ Million), 2021–2026
Table 120. IES Recent Development
Table 121. Glodon Company Details
Table 122. Glodon Business Overview
Table 123. Glodon Architectural BIM Software Product
Table 124. Glodon Revenue in Architectural BIM Software Business (US$ Million), 2021–2026
Table 125. Glodon Recent Development
Table 126. TSSD Company Details
Table 127. TSSD Business Overview
Table 128. TSSD Architectural BIM Software Product
Table 129. TSSD Revenue in Architectural BIM Software Business (US$ Million), 2021–2026
Table 130. TSSD Recent Development
Table 131. Luban Soft Company Details
Table 132. Luban Soft Business Overview
Table 133. Luban Soft Architectural BIM Software Product
Table 134. Luban Soft Revenue in Architectural BIM Software Business (US$ Million), 2021–2026
Table 135. Luban Soft Recent Development
Table 136. YJK Company Details
Table 137. YJK Business Overview
Table 138. YJK Architectural BIM Software Product
Table 139. YJK Revenue in Architectural BIM Software Business (US$ Million), 2021–2026
Table 140. YJK Recent Development
Table 141. Tangent Company Details
Table 142. Tangent Business Overview
Table 143. Tangent Architectural BIM Software Product
Table 144. Tangent Revenue in Architectural BIM Software Business (US$ Million), 2021–2026
Table 145. Tangent Recent Development
Table 146. Research Programs/Design for This Report
Table 147. Key Data Information from Secondary Sources
Table 148. Key Data Information from Primary Sources
Table 149. Authors List of This Report
List of Figures
Figure 1. Architectural BIM Software Picture
Figure 2. Global Architectural BIM Software Market Size Comparison by Type (US$ Million), 2021–2032
Figure 3. Global Architectural BIM Software Market Share by Type: 2025 vs 2032
Figure 4. Cloud-based Features
Figure 5. On-premises Features
Figure 6. Global Architectural BIM Software Market Size Comparison by Project Phase (US$ Million), 2021–2032
Figure 7. Design Phase BIM Software Features
Figure 8. Construction Phase BIM Software Features
Figure 9. Operation and Maintenance Phase BIM Software Features
Figure 10. Integrated BIM Platform Throughout the Entire Lifecycle Features
Figure 11. Global Architectural BIM Software Market Size Comparison by Collaboration and Management Capabilities (US$ Million), 2021–2032
Figure 12. Standalone Modeling Tool Features
Figure 13. Multi-Disciplinary Collaborative Design Features
Figure 14. Cross-Enterprise Collaboration and Project Management Platform Features
Figure 15. Owner-Level BIM Management and Delivery Platform Features
Figure 16. Global Architectural BIM Software Market Size by Application (US$ Million), 2021–2032
Figure 17. Global Architectural BIM Software Market Share by Application: 2025 vs 2032
Figure 18. Small and Medium Enterprises (SMEs) Case Studies
Figure 19. Large Enterprises Case Studies
Figure 20. Architectural BIM Software Report Years Considered
Figure 21. Global Architectural BIM Software Market Size (US$ Million), Year-over-Year: 2021–2032
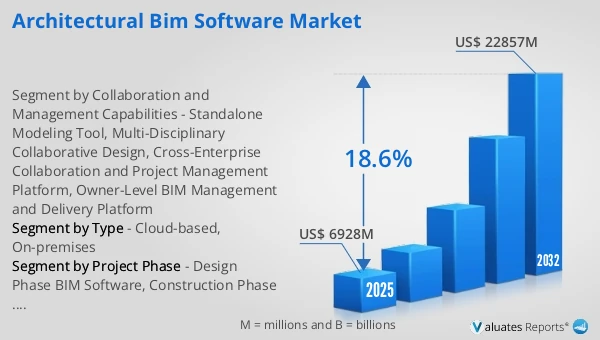
Figure 22. Global Architectural BIM Software Market Size, (US$ Million), 2021 vs 2025 vs 2032
Figure 23. Global Architectural BIM Software Market Share by Region: 2025 vs 2032
Figure 24. Global Architectural BIM Software Market Share by Players in 2025
Figure 25. Global Architectural BIM Software Market Share by Company Type (Tier 1, Tier 2, and Tier 3)
Figure 26. The Top 10 and 5 Players Market Share by Architectural BIM Software Revenue in 2025
Figure 27. North America Architectural BIM Software Market Size YoY Growth (US$ Million), 2021–2032
Figure 28. North America Architectural BIM Software Market Share by Country (2021–2032)
Figure 29. United States Architectural BIM Software Market Size YoY Growth (US$ Million), 2021–2032
Figure 30. Canada Architectural BIM Software Market Size YoY Growth (US$ Million), 2021–2032
Figure 31. Europe Architectural BIM Software Market Size YoY Growth (US$ Million), 2021–2032
Figure 32. Europe Architectural BIM Software Market Share by Country (2021–2032)
Figure 33. Germany Architectural BIM Software Market Size YoY Growth (US$ Million), 2021–2032
Figure 34. France Architectural BIM Software Market Size YoY Growth (US$ Million), 2021–2032
Figure 35. U.K. Architectural BIM Software Market Size YoY Growth (US$ Million), 2021–2032
Figure 36. Italy Architectural BIM Software Market Size YoY Growth (US$ Million), 2021–2032
Figure 37. Russia Architectural BIM Software Market Size YoY Growth (US$ Million), 2021–2032
Figure 38. Ireland Architectural BIM Software Market Size YoY Growth (US$ Million), 2021–2032
Figure 39. Asia-Pacific Architectural BIM Software Market Size YoY Growth (US$ Million), 2021–2032
Figure 40. Asia-Pacific Architectural BIM Software Market Share by Region (2021–2032)
Figure 41. China Architectural BIM Software Market Size YoY Growth (US$ Million), 2021–2032
Figure 42. Japan Architectural BIM Software Market Size YoY Growth (US$ Million), 2021–2032
Figure 43. South Korea Architectural BIM Software Market Size YoY Growth (US$ Million), 2021–2032
Figure 44. Southeast Asia Architectural BIM Software Market Size YoY Growth (US$ Million), 2021–2032
Figure 45. India Architectural BIM Software Market Size YoY Growth (US$ Million), 2021–2032
Figure 46. Australia & New Zealand Architectural BIM Software Market Size YoY Growth (US$ Million), 2021–2032
Figure 47. Latin America Architectural BIM Software Market Size YoY Growth (US$ Million), 2021–2032
Figure 48. Latin America Architectural BIM Software Market Share by Country (2021–2032)
Figure 49. Mexico Architectural BIM Software Market Size YoY Growth (US$ Million), 2021–2032
Figure 50. Brazil Architectural BIM Software Market Size YoY Growth (US$ Million), 2021–2032
Figure 51. Middle East & Africa Architectural BIM Software Market Size YoY Growth (US$ Million), 2021–2032
Figure 52. Middle East & Africa Architectural BIM Software Market Share by Country (2021–2032)
Figure 53. Israel Architectural BIM Software Market Size YoY Growth (US$ Million), 2021–2032
Figure 54. Saudi Arabia Architectural BIM Software Market Size YoY Growth (US$ Million), 2021–2032
Figure 55. UAE Architectural BIM Software Market Size YoY Growth (US$ Million), 2021–2032
Figure 56. Autodesk Revenue Growth Rate in Architectural BIM Software Business (2021–2026)
Figure 57. Nemetschek Revenue Growth Rate in Architectural BIM Software Business (2021–2026)
Figure 58. Bentley Systems Revenue Growth Rate in Architectural BIM Software Business (2021–2026)
Figure 59. Trimble Navigation Revenue Growth Rate in Architectural BIM Software Business (2021–2026)
Figure 60. Dassault Systemes Revenue Growth Rate in Architectural BIM Software Business (2021–2026)
Figure 61. RIB Software Revenue Growth Rate in Architectural BIM Software Business (2021–2026)
Figure 62. Robert Mcneel & Associates Revenue Growth Rate in Architectural BIM Software Business (2021–2026)
Figure 63. Siemens Revenue Growth Rate in Architectural BIM Software Business (2021–2026)
Figure 64. AVEVA Group Revenue Growth Rate in Architectural BIM Software Business (2021–2026)
Figure 65. Oracle Aconex Revenue Growth Rate in Architectural BIM Software Business (2021–2026)
Figure 66. Beck Technology Revenue Growth Rate in Architectural BIM Software Business (2021–2026)
Figure 67. Innovaya Revenue Growth Rate in Architectural BIM Software Business (2021–2026)
Figure 68. IES Revenue Growth Rate in Architectural BIM Software Business (2021–2026)
Figure 69. Glodon Revenue Growth Rate in Architectural BIM Software Business (2021–2026)
Figure 70. TSSD Revenue Growth Rate in Architectural BIM Software Business (2021–2026)
Figure 71. Luban Soft Revenue Growth Rate in Architectural BIM Software Business (2021–2026)
Figure 72. YJK Revenue Growth Rate in Architectural BIM Software Business (2021–2026)
Figure 73. Tangent Revenue Growth Rate in Architectural BIM Software Business (2021–2026)
Figure 74. Bottom-up and Top-down Approaches for This Report
Figure 75. Data Triangulation
Figure 76. Key Executives Interviewed