List of Tables
Table 1. Global Web-Based Indoor Location by Positioning Systems Market Size Growth Rate by Type (US$ Million): 2021 vs 2025 vs 2032
Table 2. Key Players of Pure Web / Cloud-based Platform
Table 3. Key Players of Web + Edge Hybrid Architecture
Table 4. Key Players of On-premise Web System
Table 5. Key Players of Private Cloud Web Platform
Table 6. Key Players of Multi-tenant SaaS Web Platform
Table 7. Global Web-Based Indoor Location by Positioning Systems Market Size Growth Rate by Web Interface Type (US$ Million): 2021 vs 2025 vs 2032
Table 8. Key Players of Web Dashboard & Monitoring
Table 9. Key Players of Web Map-based Visualization
Table 10. Key Players of Web Analytics & Heatmap
Table 11. Key Players of Web Navigation / Wayfinding
Table 12. Key Players of Others
Table 13. Global Web-Based Indoor Location by Positioning Systems Market Size Growth Rate by Web Data Processing Model (US$ Million): 2021 vs 2025 vs 2032
Table 14. Key Players of Real-time Streaming
Table 15. Key Players of Near Real-time
Table 16. Key Players of Others
Table 17. Global Web-Based Indoor Location by Positioning Systems Market Size Growth by Application (US$ Million): 2021 vs 2025 vs 2032
Table 18. Global Web-Based Indoor Location by Positioning Systems Market Size by Region (US$ Million): 2021 vs 2025 vs 2032
Table 19. Global Web-Based Indoor Location by Positioning Systems Market Size by Region (US$ Million), 2021–2026
Table 20. Global Web-Based Indoor Location by Positioning Systems Market Share by Region (2021–2026)
Table 21. Global Web-Based Indoor Location by Positioning Systems Forecasted Market Size by Region (US$ Million), 2027–2032
Table 22. Global Web-Based Indoor Location by Positioning Systems Market Share by Region (2027–2032)
Table 23. Web-Based Indoor Location by Positioning Systems Market Trends
Table 24. Web-Based Indoor Location by Positioning Systems Market Drivers
Table 25. Web-Based Indoor Location by Positioning Systems Market Challenges
Table 26. Web-Based Indoor Location by Positioning Systems Market Restraints
Table 27. Global Web-Based Indoor Location by Positioning Systems Revenue by Players (US$ Million), 2021–2026
Table 28. Global Web-Based Indoor Location by Positioning Systems Market Share by Players (2021–2026)
Table 29. Global Top Web-Based Indoor Location by Positioning Systems Players by Tier (Tier 1, Tier 2, and Tier 3), based on Web-Based Indoor Location by Positioning Systems Revenue, 2025
Table 30. Ranking of Global Top Web-Based Indoor Location by Positioning Systems Companies by Revenue (US$ Million) in 2025
Table 31. Global 5 Largest Players Market Share by Web-Based Indoor Location by Positioning Systems Revenue (CR5 and HHI), 2021–2026
Table 32. Global Key Players of Web-Based Indoor Location by Positioning Systems, Headquarters and Area Served
Table 33. Global Key Players of Web-Based Indoor Location by Positioning Systems, Products and Applications
Table 34. Global Key Players of Web-Based Indoor Location by Positioning Systems, Date of General Availability (GA)
Table 35. Mergers and Acquisitions, Expansion Plans
Table 36. Global Web-Based Indoor Location by Positioning Systems Market Size by Type (US$ Million), 2021–2026
Table 37. Global Web-Based Indoor Location by Positioning Systems Revenue Market Share by Type (2021–2026)
Table 38. Global Web-Based Indoor Location by Positioning Systems Forecasted Market Size by Type (US$ Million), 2027–2032
Table 39. Global Web-Based Indoor Location by Positioning Systems Revenue Market Share by Type (2027–2032)
Table 40. Global Web-Based Indoor Location by Positioning Systems Market Size by Application (US$ Million), 2021–2026
Table 41. Global Web-Based Indoor Location by Positioning Systems Revenue Market Share by Application (2021–2026)
Table 42. Global Web-Based Indoor Location by Positioning Systems Forecasted Market Size by Application (US$ Million), 2027–2032
Table 43. Global Web-Based Indoor Location by Positioning Systems Revenue Market Share by Application (2027–2032)
Table 44. North America Web-Based Indoor Location by Positioning Systems Market Size Growth Rate by Country (US$ Million): 2021 vs 2025 vs 2032
Table 45. North America Web-Based Indoor Location by Positioning Systems Market Size by Country (US$ Million), 2021–2026
Table 46. North America Web-Based Indoor Location by Positioning Systems Market Size by Country (US$ Million), 2027–2032
Table 47. Europe Web-Based Indoor Location by Positioning Systems Market Size Growth Rate by Country (US$ Million): 2021 vs 2025 vs 2032
Table 48. Europe Web-Based Indoor Location by Positioning Systems Market Size by Country (US$ Million), 2021–2026
Table 49. Europe Web-Based Indoor Location by Positioning Systems Market Size by Country (US$ Million), 2027–2032
Table 50. Asia-Pacific Web-Based Indoor Location by Positioning Systems Market Size Growth Rate by Region (US$ Million): 2021 vs 2025 vs 2032
Table 51. Asia-Pacific Web-Based Indoor Location by Positioning Systems Market Size by Region (US$ Million), 2021–2026
Table 52. Asia-Pacific Web-Based Indoor Location by Positioning Systems Market Size by Region (US$ Million), 2027–2032
Table 53. Latin America Web-Based Indoor Location by Positioning Systems Market Size Growth Rate by Country (US$ Million): 2021 vs 2025 vs 2032
Table 54. Latin America Web-Based Indoor Location by Positioning Systems Market Size by Country (US$ Million), 2021–2026
Table 55. Latin America Web-Based Indoor Location by Positioning Systems Market Size by Country (US$ Million), 2027–2032
Table 56. Middle East & Africa Web-Based Indoor Location by Positioning Systems Market Size Growth Rate by Country (US$ Million): 2021 vs 2025 vs 2032
Table 57. Middle East & Africa Web-Based Indoor Location by Positioning Systems Market Size by Country (US$ Million), 2021–2026
Table 58. Middle East & Africa Web-Based Indoor Location by Positioning Systems Market Size by Country (US$ Million), 2027–2032
Table 59. Zebra Technologies Corp. Company Details
Table 60. Zebra Technologies Corp. Business Overview
Table 61. Zebra Technologies Corp. Web-Based Indoor Location by Positioning Systems Product
Table 62. Zebra Technologies Corp. Revenue in Web-Based Indoor Location by Positioning Systems Business (US$ Million), 2021–2026
Table 63. Zebra Technologies Corp. Recent Development
Table 64. Aruba(HPE Aruba) Company Details
Table 65. Aruba(HPE Aruba) Business Overview
Table 66. Aruba(HPE Aruba) Web-Based Indoor Location by Positioning Systems Product
Table 67. Aruba(HPE Aruba) Revenue in Web-Based Indoor Location by Positioning Systems Business (US$ Million), 2021–2026
Table 68. Aruba(HPE Aruba) Recent Development
Table 69. Acuity Brands Company Details
Table 70. Acuity Brands Business Overview
Table 71. Acuity Brands Web-Based Indoor Location by Positioning Systems Product
Table 72. Acuity Brands Revenue in Web-Based Indoor Location by Positioning Systems Business (US$ Million), 2021–2026
Table 73. Acuity Brands Recent Development
Table 74. CenTrak Company Details
Table 75. CenTrak Business Overview
Table 76. CenTrak Web-Based Indoor Location by Positioning Systems Product
Table 77. CenTrak Revenue in Web-Based Indoor Location by Positioning Systems Business (US$ Million), 2021–2026
Table 78. CenTrak Recent Development
Table 79. HID Global Company Details
Table 80. HID Global Business Overview
Table 81. HID Global Web-Based Indoor Location by Positioning Systems Product
Table 82. HID Global Revenue in Web-Based Indoor Location by Positioning Systems Business (US$ Million), 2021–2026
Table 83. HID Global Recent Development
Table 84. STANLEY Healthcare Company Details
Table 85. STANLEY Healthcare Business Overview
Table 86. STANLEY Healthcare Web-Based Indoor Location by Positioning Systems Product
Table 87. STANLEY Healthcare Revenue in Web-Based Indoor Location by Positioning Systems Business (US$ Million), 2021–2026
Table 88. STANLEY Healthcare Recent Development
Table 89. Ubisense Company Details
Table 90. Ubisense Business Overview
Table 91. Ubisense Web-Based Indoor Location by Positioning Systems Product
Table 92. Ubisense Revenue in Web-Based Indoor Location by Positioning Systems Business (US$ Million), 2021–2026
Table 93. Ubisense Recent Development
Table 94. Quuppa Company Details
Table 95. Quuppa Business Overview
Table 96. Quuppa Web-Based Indoor Location by Positioning Systems Product
Table 97. Quuppa Revenue in Web-Based Indoor Location by Positioning Systems Business (US$ Million), 2021–2026
Table 98. Quuppa Recent Development
Table 99. Mist Systems Company Details
Table 100. Mist Systems Business Overview
Table 101. Mist Systems Web-Based Indoor Location by Positioning Systems Product
Table 102. Mist Systems Revenue in Web-Based Indoor Location by Positioning Systems Business (US$ Million), 2021–2026
Table 103. Mist Systems Recent Development
Table 104. Inpixon Company Details
Table 105. Inpixon Business Overview
Table 106. Inpixon Web-Based Indoor Location by Positioning Systems Product
Table 107. Inpixon Revenue in Web-Based Indoor Location by Positioning Systems Business (US$ Million), 2021–2026
Table 108. Inpixon Recent Development
Table 109. Essensium Company Details
Table 110. Essensium Business Overview
Table 111. Essensium Web-Based Indoor Location by Positioning Systems Product
Table 112. Essensium Revenue in Web-Based Indoor Location by Positioning Systems Business (US$ Million), 2021–2026
Table 113. Essensium Recent Development
Table 114. Sewio Company Details
Table 115. Sewio Business Overview
Table 116. Sewio Web-Based Indoor Location by Positioning Systems Product
Table 117. Sewio Revenue in Web-Based Indoor Location by Positioning Systems Business (US$ Million), 2021–2026
Table 118. Sewio Recent Development
Table 119. TRX Systems Company Details
Table 120. TRX Systems Business Overview
Table 121. TRX Systems Web-Based Indoor Location by Positioning Systems Product
Table 122. TRX Systems Revenue in Web-Based Indoor Location by Positioning Systems Business (US$ Million), 2021–2026
Table 123. TRX Systems Recent Development
Table 124. Sonitor Company Details
Table 125. Sonitor Business Overview
Table 126. Sonitor Web-Based Indoor Location by Positioning Systems Product
Table 127. Sonitor Revenue in Web-Based Indoor Location by Positioning Systems Business (US$ Million), 2021–2026
Table 128. Sonitor Recent Development
Table 129. Pozyx Labs Company Details
Table 130. Pozyx Labs Business Overview
Table 131. Pozyx Labs Web-Based Indoor Location by Positioning Systems Product
Table 132. Pozyx Labs Revenue in Web-Based Indoor Location by Positioning Systems Business (US$ Million), 2021–2026
Table 133. Pozyx Labs Recent Development
Table 134. Advanced Realtime Tracking Company Details
Table 135. Advanced Realtime Tracking Business Overview
Table 136. Advanced Realtime Tracking Web-Based Indoor Location by Positioning Systems Product
Table 137. Advanced Realtime Tracking Revenue in Web-Based Indoor Location by Positioning Systems Business (US$ Million), 2021–2026
Table 138. Advanced Realtime Tracking Recent Development
Table 139. Cisco Company Details
Table 140. Cisco Business Overview
Table 141. Cisco Web-Based Indoor Location by Positioning Systems Product
Table 142. Cisco Revenue in Web-Based Indoor Location by Positioning Systems Business (US$ Million), 2021–2026
Table 143. Cisco Recent Development
Table 144. Siemens Company Details
Table 145. Siemens Business Overview
Table 146. Siemens Web-Based Indoor Location by Positioning Systems Product
Table 147. Siemens Revenue in Web-Based Indoor Location by Positioning Systems Business (US$ Million), 2021–2026
Table 148. Siemens Recent Development
Table 149. Extreme Networks Company Details
Table 150. Extreme Networks Business Overview
Table 151. Extreme Networks Web-Based Indoor Location by Positioning Systems Product
Table 152. Extreme Networks Revenue in Web-Based Indoor Location by Positioning Systems Business (US$ Million), 2021–2026
Table 153. Extreme Networks Recent Development
Table 154. Kontakt.io Company Details
Table 155. Kontakt.io Business Overview
Table 156. Kontakt.io Web-Based Indoor Location by Positioning Systems Product
Table 157. Kontakt.io Revenue in Web-Based Indoor Location by Positioning Systems Business (US$ Million), 2021–2026
Table 158. Kontakt.io Recent Development
Table 159. KINEXON Company Details
Table 160. KINEXON Business Overview
Table 161. KINEXON Web-Based Indoor Location by Positioning Systems Product
Table 162. KINEXON Revenue in Web-Based Indoor Location by Positioning Systems Business (US$ Million), 2021–2026
Table 163. KINEXON Recent Development
Table 164. SICK Company Details
Table 165. SICK Business Overview
Table 166. SICK Web-Based Indoor Location by Positioning Systems Product
Table 167. SICK Revenue in Web-Based Indoor Location by Positioning Systems Business (US$ Million), 2021–2026
Table 168. SICK Recent Development
Table 169. Honeywell Company Details
Table 170. Honeywell Business Overview
Table 171. Honeywell Web-Based Indoor Location by Positioning Systems Product
Table 172. Honeywell Revenue in Web-Based Indoor Location by Positioning Systems Business (US$ Million), 2021–2026
Table 173. Honeywell Recent Development
Table 174. Research Programs/Design for This Report
Table 175. Key Data Information from Secondary Sources
Table 176. Key Data Information from Primary Sources
Table 177. Authors List of This Report
List of Figures
Figure 1. Web-Based Indoor Location by Positioning Systems Picture
Figure 2. Global Web-Based Indoor Location by Positioning Systems Market Size Comparison by Type (US$ Million), 2021–2032
Figure 3. Global Web-Based Indoor Location by Positioning Systems Market Share by Type: 2025 vs 2032
Figure 4. Pure Web / Cloud-based Platform Features
Figure 5. Web + Edge Hybrid Architecture Features
Figure 6. On-premise Web System Features
Figure 7. Private Cloud Web Platform Features
Figure 8. Multi-tenant SaaS Web Platform Features
Figure 9. Global Web-Based Indoor Location by Positioning Systems Market Size Comparison by Web Interface Type (US$ Million), 2021–2032
Figure 10. Web Dashboard & Monitoring Features
Figure 11. Web Map-based Visualization Features
Figure 12. Web Analytics & Heatmap Features
Figure 13. Web Navigation / Wayfinding Features
Figure 14. Others Features
Figure 15. Global Web-Based Indoor Location by Positioning Systems Market Size Comparison by Web Data Processing Model (US$ Million), 2021–2032
Figure 16. Real-time Streaming Features
Figure 17. Near Real-time Features
Figure 18. Others Features
Figure 19. Global Web-Based Indoor Location by Positioning Systems Market Size by Application (US$ Million), 2021–2032
Figure 20. Global Web-Based Indoor Location by Positioning Systems Market Share by Application: 2025 vs 2032
Figure 21. Healthcare & Senior Care Case Studies
Figure 22. Manufacturing & Industrial Case Studies
Figure 23. Retail, Shopping Mall & Commercial Space Case Studies
Figure 24. Transportation Hubs & Public Infrastructure Case Studies
Figure 25. Logistics, Warehouse & Cold Chain Case Studies
Figure 26. Smart Buildings & Corporate Campus Case Studies
Figure 27. Others Case Studies
Figure 28. Web-Based Indoor Location by Positioning Systems Report Years Considered
Figure 29. Global Web-Based Indoor Location by Positioning Systems Market Size (US$ Million), Year-over-Year: 2021–2032
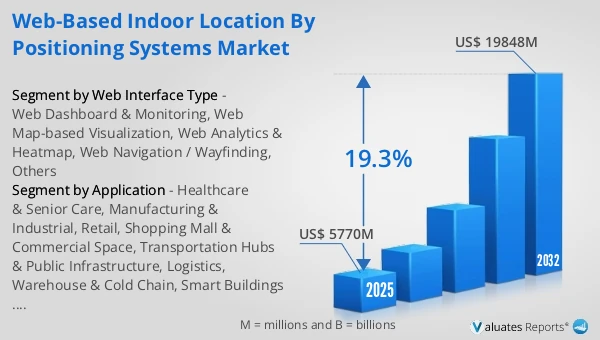
Figure 30. Global Web-Based Indoor Location by Positioning Systems Market Size, (US$ Million), 2021 vs 2025 vs 2032
Figure 31. Global Web-Based Indoor Location by Positioning Systems Market Share by Region: 2025 vs 2032
Figure 32. Global Web-Based Indoor Location by Positioning Systems Market Share by Players in 2025
Figure 33. Global Web-Based Indoor Location by Positioning Systems Market Share by Company Type (Tier 1, Tier 2, and Tier 3)
Figure 34. The Top 10 and 5 Players Market Share by Web-Based Indoor Location by Positioning Systems Revenue in 2025
Figure 35. North America Web-Based Indoor Location by Positioning Systems Market Size YoY Growth (US$ Million), 2021–2032
Figure 36. North America Web-Based Indoor Location by Positioning Systems Market Share by Country (2021–2032)
Figure 37. United States Web-Based Indoor Location by Positioning Systems Market Size YoY Growth (US$ Million), 2021–2032
Figure 38. Canada Web-Based Indoor Location by Positioning Systems Market Size YoY Growth (US$ Million), 2021–2032
Figure 39. Europe Web-Based Indoor Location by Positioning Systems Market Size YoY Growth (US$ Million), 2021–2032
Figure 40. Europe Web-Based Indoor Location by Positioning Systems Market Share by Country (2021–2032)
Figure 41. Germany Web-Based Indoor Location by Positioning Systems Market Size YoY Growth (US$ Million), 2021–2032
Figure 42. France Web-Based Indoor Location by Positioning Systems Market Size YoY Growth (US$ Million), 2021–2032
Figure 43. U.K. Web-Based Indoor Location by Positioning Systems Market Size YoY Growth (US$ Million), 2021–2032
Figure 44. Italy Web-Based Indoor Location by Positioning Systems Market Size YoY Growth (US$ Million), 2021–2032
Figure 45. Russia Web-Based Indoor Location by Positioning Systems Market Size YoY Growth (US$ Million), 2021–2032
Figure 46. Ireland Web-Based Indoor Location by Positioning Systems Market Size YoY Growth (US$ Million), 2021–2032
Figure 47. Asia-Pacific Web-Based Indoor Location by Positioning Systems Market Size YoY Growth (US$ Million), 2021–2032
Figure 48. Asia-Pacific Web-Based Indoor Location by Positioning Systems Market Share by Region (2021–2032)
Figure 49. China Web-Based Indoor Location by Positioning Systems Market Size YoY Growth (US$ Million), 2021–2032
Figure 50. Japan Web-Based Indoor Location by Positioning Systems Market Size YoY Growth (US$ Million), 2021–2032
Figure 51. South Korea Web-Based Indoor Location by Positioning Systems Market Size YoY Growth (US$ Million), 2021–2032
Figure 52. Southeast Asia Web-Based Indoor Location by Positioning Systems Market Size YoY Growth (US$ Million), 2021–2032
Figure 53. India Web-Based Indoor Location by Positioning Systems Market Size YoY Growth (US$ Million), 2021–2032
Figure 54. Australia & New Zealand Web-Based Indoor Location by Positioning Systems Market Size YoY Growth (US$ Million), 2021–2032
Figure 55. Latin America Web-Based Indoor Location by Positioning Systems Market Size YoY Growth (US$ Million), 2021–2032
Figure 56. Latin America Web-Based Indoor Location by Positioning Systems Market Share by Country (2021–2032)
Figure 57. Mexico Web-Based Indoor Location by Positioning Systems Market Size YoY Growth (US$ Million), 2021–2032
Figure 58. Brazil Web-Based Indoor Location by Positioning Systems Market Size YoY Growth (US$ Million), 2021–2032
Figure 59. Middle East & Africa Web-Based Indoor Location by Positioning Systems Market Size YoY Growth (US$ Million), 2021–2032
Figure 60. Middle East & Africa Web-Based Indoor Location by Positioning Systems Market Share by Country (2021–2032)
Figure 61. Israel Web-Based Indoor Location by Positioning Systems Market Size YoY Growth (US$ Million), 2021–2032
Figure 62. Saudi Arabia Web-Based Indoor Location by Positioning Systems Market Size YoY Growth (US$ Million), 2021–2032
Figure 63. UAE Web-Based Indoor Location by Positioning Systems Market Size YoY Growth (US$ Million), 2021–2032
Figure 64. Zebra Technologies Corp. Revenue Growth Rate in Web-Based Indoor Location by Positioning Systems Business (2021–2026)
Figure 65. Aruba(HPE Aruba) Revenue Growth Rate in Web-Based Indoor Location by Positioning Systems Business (2021–2026)
Figure 66. Acuity Brands Revenue Growth Rate in Web-Based Indoor Location by Positioning Systems Business (2021–2026)
Figure 67. CenTrak Revenue Growth Rate in Web-Based Indoor Location by Positioning Systems Business (2021–2026)
Figure 68. HID Global Revenue Growth Rate in Web-Based Indoor Location by Positioning Systems Business (2021–2026)
Figure 69. STANLEY Healthcare Revenue Growth Rate in Web-Based Indoor Location by Positioning Systems Business (2021–2026)
Figure 70. Ubisense Revenue Growth Rate in Web-Based Indoor Location by Positioning Systems Business (2021–2026)
Figure 71. Quuppa Revenue Growth Rate in Web-Based Indoor Location by Positioning Systems Business (2021–2026)
Figure 72. Mist Systems Revenue Growth Rate in Web-Based Indoor Location by Positioning Systems Business (2021–2026)
Figure 73. Inpixon Revenue Growth Rate in Web-Based Indoor Location by Positioning Systems Business (2021–2026)
Figure 74. Essensium Revenue Growth Rate in Web-Based Indoor Location by Positioning Systems Business (2021–2026)
Figure 75. Sewio Revenue Growth Rate in Web-Based Indoor Location by Positioning Systems Business (2021–2026)
Figure 76. TRX Systems Revenue Growth Rate in Web-Based Indoor Location by Positioning Systems Business (2021–2026)
Figure 77. Sonitor Revenue Growth Rate in Web-Based Indoor Location by Positioning Systems Business (2021–2026)
Figure 78. Pozyx Labs Revenue Growth Rate in Web-Based Indoor Location by Positioning Systems Business (2021–2026)
Figure 79. Advanced Realtime Tracking Revenue Growth Rate in Web-Based Indoor Location by Positioning Systems Business (2021–2026)
Figure 80. Cisco Revenue Growth Rate in Web-Based Indoor Location by Positioning Systems Business (2021–2026)
Figure 81. Siemens Revenue Growth Rate in Web-Based Indoor Location by Positioning Systems Business (2021–2026)
Figure 82. Extreme Networks Revenue Growth Rate in Web-Based Indoor Location by Positioning Systems Business (2021–2026)
Figure 83. Kontakt.io Revenue Growth Rate in Web-Based Indoor Location by Positioning Systems Business (2021–2026)
Figure 84. KINEXON Revenue Growth Rate in Web-Based Indoor Location by Positioning Systems Business (2021–2026)
Figure 85. SICK Revenue Growth Rate in Web-Based Indoor Location by Positioning Systems Business (2021–2026)
Figure 86. Honeywell Revenue Growth Rate in Web-Based Indoor Location by Positioning Systems Business (2021–2026)
Figure 87. Bottom-up and Top-down Approaches for This Report
Figure 88. Data Triangulation
Figure 89. Key Executives Interviewed