List of Tables
Table 1. Global Mobile Analysis Service (MAS) Market Size Growth Rate by Type (US$ Million): 2021 vs 2025 vs 2032
Table 2. Key Players of User Behavior and Product Analytics
Table 3. Key Players of Marketing Attribution and Advertising Analytics
Table 4. Key Players of Application Performance Management
Table 5. Key Players of Others
Table 6. Global Mobile Analysis Service (MAS) Market Size Growth Rate by Technical Architecture (US$ Million): 2021 vs 2025 vs 2032
Table 7. Key Players of Cloud-native Real-time Analytics
Table 8. Key Players of Hybrid Batch and Stream Processing
Table 9. Key Players of Edge Computing Analytics
Table 10. Key Players of Others
Table 11. Global Mobile Analysis Service (MAS) Market Size Growth Rate by Deployment Model (US$ Million): 2021 vs 2025 vs 2032
Table 12. Key Players of Public Cloud SaaS
Table 13. Key Players of Private Cloud and On-premises
Table 14. Key Players of Hybrid Deployment
Table 15. Global Mobile Analysis Service (MAS) Market Size Growth Rate by Downstream Industry (US$ Million): 2021 vs 2025 vs 2032
Table 16. Key Players of E-commerce and Retail
Table 17. Key Players of Gaming
Table 18. Key Players of Financial Technology and Services
Table 19. Key Players of Others
Table 20. Global Mobile Analysis Service (MAS) Market Size Growth by Application (US$ Million): 2021 vs 2025 vs 2032
Table 21. Global Mobile Analysis Service (MAS) Market Size by Region (US$ Million): 2021 vs 2025 vs 2032
Table 22. Global Mobile Analysis Service (MAS) Market Size by Region (US$ Million), 2021–2026
Table 23. Global Mobile Analysis Service (MAS) Market Share by Region (2021–2026)
Table 24. Global Mobile Analysis Service (MAS) Forecasted Market Size by Region (US$ Million), 2027–2032
Table 25. Global Mobile Analysis Service (MAS) Market Share by Region (2027–2032)
Table 26. Mobile Analysis Service (MAS) Market Trends
Table 27. Mobile Analysis Service (MAS) Market Drivers
Table 28. Mobile Analysis Service (MAS) Market Challenges
Table 29. Mobile Analysis Service (MAS) Market Restraints
Table 30. Global Mobile Analysis Service (MAS) Revenue by Players (US$ Million), 2021–2026
Table 31. Global Mobile Analysis Service (MAS) Market Share by Players (2021–2026)
Table 32. Global Top Mobile Analysis Service (MAS) Players by Tier (Tier 1, Tier 2, and Tier 3), based on Mobile Analysis Service (MAS) Revenue, 2025
Table 33. Ranking of Global Top Mobile Analysis Service (MAS) Companies by Revenue (US$ Million) in 2025
Table 34. Global 5 Largest Players Market Share by Mobile Analysis Service (MAS) Revenue (CR5 and HHI), 2021–2026
Table 35. Global Key Players of Mobile Analysis Service (MAS), Headquarters and Area Served
Table 36. Global Key Players of Mobile Analysis Service (MAS), Products and Applications
Table 37. Global Key Players of Mobile Analysis Service (MAS), Date of General Availability (GA)
Table 38. Mergers and Acquisitions, Expansion Plans
Table 39. Global Mobile Analysis Service (MAS) Market Size by Type (US$ Million), 2021–2026
Table 40. Global Mobile Analysis Service (MAS) Revenue Market Share by Type (2021–2026)
Table 41. Global Mobile Analysis Service (MAS) Forecasted Market Size by Type (US$ Million), 2027–2032
Table 42. Global Mobile Analysis Service (MAS) Revenue Market Share by Type (2027–2032)
Table 43. Global Mobile Analysis Service (MAS) Market Size by Application (US$ Million), 2021–2026
Table 44. Global Mobile Analysis Service (MAS) Revenue Market Share by Application (2021–2026)
Table 45. Global Mobile Analysis Service (MAS) Forecasted Market Size by Application (US$ Million), 2027–2032
Table 46. Global Mobile Analysis Service (MAS) Revenue Market Share by Application (2027–2032)
Table 47. North America Mobile Analysis Service (MAS) Market Size Growth Rate by Country (US$ Million): 2021 vs 2025 vs 2032
Table 48. North America Mobile Analysis Service (MAS) Market Size by Country (US$ Million), 2021–2026
Table 49. North America Mobile Analysis Service (MAS) Market Size by Country (US$ Million), 2027–2032
Table 50. Europe Mobile Analysis Service (MAS) Market Size Growth Rate by Country (US$ Million): 2021 vs 2025 vs 2032
Table 51. Europe Mobile Analysis Service (MAS) Market Size by Country (US$ Million), 2021–2026
Table 52. Europe Mobile Analysis Service (MAS) Market Size by Country (US$ Million), 2027–2032
Table 53. Asia-Pacific Mobile Analysis Service (MAS) Market Size Growth Rate by Region (US$ Million): 2021 vs 2025 vs 2032
Table 54. Asia-Pacific Mobile Analysis Service (MAS) Market Size by Region (US$ Million), 2021–2026
Table 55. Asia-Pacific Mobile Analysis Service (MAS) Market Size by Region (US$ Million), 2027–2032
Table 56. Latin America Mobile Analysis Service (MAS) Market Size Growth Rate by Country (US$ Million): 2021 vs 2025 vs 2032
Table 57. Latin America Mobile Analysis Service (MAS) Market Size by Country (US$ Million), 2021–2026
Table 58. Latin America Mobile Analysis Service (MAS) Market Size by Country (US$ Million), 2027–2032
Table 59. Middle East & Africa Mobile Analysis Service (MAS) Market Size Growth Rate by Country (US$ Million): 2021 vs 2025 vs 2032
Table 60. Middle East & Africa Mobile Analysis Service (MAS) Market Size by Country (US$ Million), 2021–2026
Table 61. Middle East & Africa Mobile Analysis Service (MAS) Market Size by Country (US$ Million), 2027–2032
Table 62. Accenture plc Company Details
Table 63. Accenture plc Business Overview
Table 64. Accenture plc Mobile Analysis Service (MAS) Product
Table 65. Accenture plc Revenue in Mobile Analysis Service (MAS) Business (US$ Million), 2021–2026
Table 66. Accenture plc Recent Development
Table 67. Deloitte Touche Tohmatsu Limited (Deloitte) Company Details
Table 68. Deloitte Touche Tohmatsu Limited (Deloitte) Business Overview
Table 69. Deloitte Touche Tohmatsu Limited (Deloitte) Mobile Analysis Service (MAS) Product
Table 70. Deloitte Touche Tohmatsu Limited (Deloitte) Revenue in Mobile Analysis Service (MAS) Business (US$ Million), 2021–2026
Table 71. Deloitte Touche Tohmatsu Limited (Deloitte) Recent Development
Table 72. Environics Analytics Company Details
Table 73. Environics Analytics Business Overview
Table 74. Environics Analytics Mobile Analysis Service (MAS) Product
Table 75. Environics Analytics Revenue in Mobile Analysis Service (MAS) Business (US$ Million), 2021–2026
Table 76. Environics Analytics Recent Development
Table 77. McGaw.io, LLC Company Details
Table 78. McGaw.io, LLC Business Overview
Table 79. McGaw.io, LLC Mobile Analysis Service (MAS) Product
Table 80. McGaw.io, LLC Revenue in Mobile Analysis Service (MAS) Business (US$ Million), 2021–2026
Table 81. McGaw.io, LLC Recent Development
Table 82. e-CENS FZ LLC Company Details
Table 83. e-CENS FZ LLC Business Overview
Table 84. e-CENS FZ LLC Mobile Analysis Service (MAS) Product
Table 85. e-CENS FZ LLC Revenue in Mobile Analysis Service (MAS) Business (US$ Million), 2021–2026
Table 86. e-CENS FZ LLC Recent Development
Table 87. QBurst Company Details
Table 88. QBurst Business Overview
Table 89. QBurst Mobile Analysis Service (MAS) Product
Table 90. QBurst Revenue in Mobile Analysis Service (MAS) Business (US$ Million), 2021–2026
Table 91. QBurst Recent Development
Table 92. TechAhead Company Details
Table 93. TechAhead Business Overview
Table 94. TechAhead Mobile Analysis Service (MAS) Product
Table 95. TechAhead Revenue in Mobile Analysis Service (MAS) Business (US$ Million), 2021–2026
Table 96. TechAhead Recent Development
Table 97. AppsChopper Company Details
Table 98. AppsChopper Business Overview
Table 99. AppsChopper Mobile Analysis Service (MAS) Product
Table 100. AppsChopper Revenue in Mobile Analysis Service (MAS) Business (US$ Million), 2021–2026
Table 101. AppsChopper Recent Development
Table 102. Conversion Agency Company Details
Table 103. Conversion Agency Business Overview
Table 104. Conversion Agency Mobile Analysis Service (MAS) Product
Table 105. Conversion Agency Revenue in Mobile Analysis Service (MAS) Business (US$ Million), 2021–2026
Table 106. Conversion Agency Recent Development
Table 107. Vaultalytics LLC Company Details
Table 108. Vaultalytics LLC Business Overview
Table 109. Vaultalytics LLC Mobile Analysis Service (MAS) Product
Table 110. Vaultalytics LLC Revenue in Mobile Analysis Service (MAS) Business (US$ Million), 2021–2026
Table 111. Vaultalytics LLC Recent Development
Table 112. TalkingData Company Details
Table 113. TalkingData Business Overview
Table 114. TalkingData Mobile Analysis Service (MAS) Product
Table 115. TalkingData Revenue in Mobile Analysis Service (MAS) Business (US$ Million), 2021–2026
Table 116. TalkingData Recent Development
Table 117. Umeng+ Company Details
Table 118. Umeng+ Business Overview
Table 119. Umeng+ Mobile Analysis Service (MAS) Product
Table 120. Umeng+ Revenue in Mobile Analysis Service (MAS) Business (US$ Million), 2021–2026
Table 121. Umeng+ Recent Development
Table 122. Sensors Data Company Details
Table 123. Sensors Data Business Overview
Table 124. Sensors Data Mobile Analysis Service (MAS) Product
Table 125. Sensors Data Revenue in Mobile Analysis Service (MAS) Business (US$ Million), 2021–2026
Table 126. Sensors Data Recent Development
Table 127. GrowingIO Company Details
Table 128. GrowingIO Business Overview
Table 129. GrowingIO Mobile Analysis Service (MAS) Product
Table 130. GrowingIO Revenue in Mobile Analysis Service (MAS) Business (US$ Million), 2021–2026
Table 131. GrowingIO Recent Development
Table 132. Research Programs/Design for This Report
Table 133. Key Data Information from Secondary Sources
Table 134. Key Data Information from Primary Sources
Table 135. Authors List of This Report
List of Figures
Figure 1. Mobile Analysis Service (MAS) Picture
Figure 2. Global Mobile Analysis Service (MAS) Market Size Comparison by Type (US$ Million), 2021–2032
Figure 3. Global Mobile Analysis Service (MAS) Market Share by Type: 2025 vs 2032
Figure 4. User Behavior and Product Analytics Features
Figure 5. Marketing Attribution and Advertising Analytics Features
Figure 6. Application Performance Management Features
Figure 7. Others Features
Figure 8. Global Mobile Analysis Service (MAS) Market Size Comparison by Technical Architecture (US$ Million), 2021–2032
Figure 9. Cloud-native Real-time Analytics Features
Figure 10. Hybrid Batch and Stream Processing Features
Figure 11. Edge Computing Analytics Features
Figure 12. Others Features
Figure 13. Global Mobile Analysis Service (MAS) Market Size Comparison by Deployment Model (US$ Million), 2021–2032
Figure 14. Public Cloud SaaS Features
Figure 15. Private Cloud and On-premises Features
Figure 16. Hybrid Deployment Features
Figure 17. Global Mobile Analysis Service (MAS) Market Size Comparison by Downstream Industry (US$ Million), 2021–2032
Figure 18. E-commerce and Retail Features
Figure 19. Gaming Features
Figure 20. Financial Technology and Services Features
Figure 21. Others Features
Figure 22. Global Mobile Analysis Service (MAS) Market Size by Application (US$ Million), 2021–2032
Figure 23. Global Mobile Analysis Service (MAS) Market Share by Application: 2025 vs 2032
Figure 24. Large and Enterprise Customers Case Studies
Figure 25. Mid-market Companies Case Studies
Figure 26. Small Businesses and Independent Developers Case Studies
Figure 27. Mobile Analysis Service (MAS) Report Years Considered
Figure 28. Global Mobile Analysis Service (MAS) Market Size (US$ Million), Year-over-Year: 2021–2032
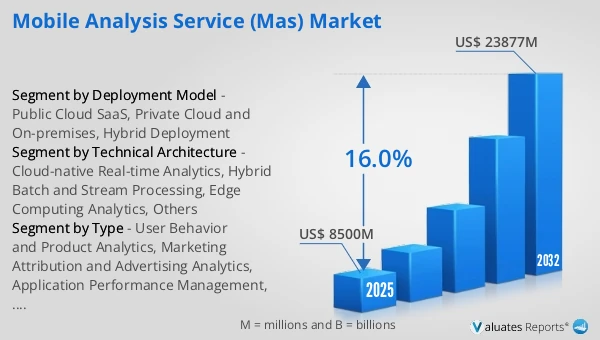
Figure 29. Global Mobile Analysis Service (MAS) Market Size, (US$ Million), 2021 vs 2025 vs 2032
Figure 30. Global Mobile Analysis Service (MAS) Market Share by Region: 2025 vs 2032
Figure 31. Global Mobile Analysis Service (MAS) Market Share by Players in 2025
Figure 32. Global Mobile Analysis Service (MAS) Market Share by Company Type (Tier 1, Tier 2, and Tier 3)
Figure 33. The Top 10 and 5 Players Market Share by Mobile Analysis Service (MAS) Revenue in 2025
Figure 34. North America Mobile Analysis Service (MAS) Market Size YoY Growth (US$ Million), 2021–2032
Figure 35. North America Mobile Analysis Service (MAS) Market Share by Country (2021–2032)
Figure 36. United States Mobile Analysis Service (MAS) Market Size YoY Growth (US$ Million), 2021–2032
Figure 37. Canada Mobile Analysis Service (MAS) Market Size YoY Growth (US$ Million), 2021–2032
Figure 38. Europe Mobile Analysis Service (MAS) Market Size YoY Growth (US$ Million), 2021–2032
Figure 39. Europe Mobile Analysis Service (MAS) Market Share by Country (2021–2032)
Figure 40. Germany Mobile Analysis Service (MAS) Market Size YoY Growth (US$ Million), 2021–2032
Figure 41. France Mobile Analysis Service (MAS) Market Size YoY Growth (US$ Million), 2021–2032
Figure 42. U.K. Mobile Analysis Service (MAS) Market Size YoY Growth (US$ Million), 2021–2032
Figure 43. Italy Mobile Analysis Service (MAS) Market Size YoY Growth (US$ Million), 2021–2032
Figure 44. Russia Mobile Analysis Service (MAS) Market Size YoY Growth (US$ Million), 2021–2032
Figure 45. Ireland Mobile Analysis Service (MAS) Market Size YoY Growth (US$ Million), 2021–2032
Figure 46. Asia-Pacific Mobile Analysis Service (MAS) Market Size YoY Growth (US$ Million), 2021–2032
Figure 47. Asia-Pacific Mobile Analysis Service (MAS) Market Share by Region (2021–2032)
Figure 48. China Mobile Analysis Service (MAS) Market Size YoY Growth (US$ Million), 2021–2032
Figure 49. Japan Mobile Analysis Service (MAS) Market Size YoY Growth (US$ Million), 2021–2032
Figure 50. South Korea Mobile Analysis Service (MAS) Market Size YoY Growth (US$ Million), 2021–2032
Figure 51. Southeast Asia Mobile Analysis Service (MAS) Market Size YoY Growth (US$ Million), 2021–2032
Figure 52. India Mobile Analysis Service (MAS) Market Size YoY Growth (US$ Million), 2021–2032
Figure 53. Australia & New Zealand Mobile Analysis Service (MAS) Market Size YoY Growth (US$ Million), 2021–2032
Figure 54. Latin America Mobile Analysis Service (MAS) Market Size YoY Growth (US$ Million), 2021–2032
Figure 55. Latin America Mobile Analysis Service (MAS) Market Share by Country (2021–2032)
Figure 56. Mexico Mobile Analysis Service (MAS) Market Size YoY Growth (US$ Million), 2021–2032
Figure 57. Brazil Mobile Analysis Service (MAS) Market Size YoY Growth (US$ Million), 2021–2032
Figure 58. Middle East & Africa Mobile Analysis Service (MAS) Market Size YoY Growth (US$ Million), 2021–2032
Figure 59. Middle East & Africa Mobile Analysis Service (MAS) Market Share by Country (2021–2032)
Figure 60. Israel Mobile Analysis Service (MAS) Market Size YoY Growth (US$ Million), 2021–2032
Figure 61. Saudi Arabia Mobile Analysis Service (MAS) Market Size YoY Growth (US$ Million), 2021–2032
Figure 62. UAE Mobile Analysis Service (MAS) Market Size YoY Growth (US$ Million), 2021–2032
Figure 63. Accenture plc Revenue Growth Rate in Mobile Analysis Service (MAS) Business (2021–2026)
Figure 64. Deloitte Touche Tohmatsu Limited (Deloitte) Revenue Growth Rate in Mobile Analysis Service (MAS) Business (2021–2026)
Figure 65. Environics Analytics Revenue Growth Rate in Mobile Analysis Service (MAS) Business (2021–2026)
Figure 66. McGaw.io, LLC Revenue Growth Rate in Mobile Analysis Service (MAS) Business (2021–2026)
Figure 67. e-CENS FZ LLC Revenue Growth Rate in Mobile Analysis Service (MAS) Business (2021–2026)
Figure 68. QBurst Revenue Growth Rate in Mobile Analysis Service (MAS) Business (2021–2026)
Figure 69. TechAhead Revenue Growth Rate in Mobile Analysis Service (MAS) Business (2021–2026)
Figure 70. AppsChopper Revenue Growth Rate in Mobile Analysis Service (MAS) Business (2021–2026)
Figure 71. Conversion Agency Revenue Growth Rate in Mobile Analysis Service (MAS) Business (2021–2026)
Figure 72. Vaultalytics LLC Revenue Growth Rate in Mobile Analysis Service (MAS) Business (2021–2026)
Figure 73. TalkingData Revenue Growth Rate in Mobile Analysis Service (MAS) Business (2021–2026)
Figure 74. Umeng+ Revenue Growth Rate in Mobile Analysis Service (MAS) Business (2021–2026)
Figure 75. Sensors Data Revenue Growth Rate in Mobile Analysis Service (MAS) Business (2021–2026)
Figure 76. GrowingIO Revenue Growth Rate in Mobile Analysis Service (MAS) Business (2021–2026)
Figure 77. Bottom-up and Top-down Approaches for This Report
Figure 78. Data Triangulation
Figure 79. Key Executives Interviewed