List of Tables
Table 1. Global Industrial Catalyst Market Value by Type (US$ Million), 2025 vs 2032
Table 2. Global Industrial Catalyst Market Value by Application (US$ Million), 2025 vs 2032
Table 3. Global Industrial Catalyst Production Capacity (K MT) by Manufacturers in 2025
Table 4. Global Industrial Catalyst Production by Manufacturers (K MT), 2021–2026
Table 5. Global Industrial Catalyst Production Market Share by Manufacturers (2021–2026)
Table 6. Global Industrial Catalyst Production Value by Manufacturers (US$ Million), 2021–2026
Table 7. Global Industrial Catalyst Production Value Share by Manufacturers (2021–2026)
Table 8. Global Key Players of Industrial Catalyst, Industry Ranking, 2024 vs 2025
Table 9. Classification of Companies by Tier (Tier 1, Tier 2, Tier 3), based on Industrial Catalyst Production Value, 2025
Table 10. Global Market Industrial Catalyst Average Price by Manufacturers (USD/MT), 2021–2026
Table 11. Global Key Manufacturers of Industrial Catalyst, Manufacturing Footprints and Headquarters
Table 12. Global Key Manufacturers of Industrial Catalyst, Product Offerings and Applications
Table 13. Global Key Manufacturers of Industrial Catalyst, Date of Entry into the Industry
Table 14. Global Industrial Catalyst Manufacturers Market Concentration Ratio (CR5 and HHI)
Table 15. Mergers & Acquisitions and Expansion Plans
Table 16. Global Industrial Catalyst Production Value by Region: 2021 vs 2025 vs 2032 (US$ Million)
Table 17. Global Industrial Catalyst Production Value (US$ Million) by Region (2021–2026)
Table 18. Global Industrial Catalyst Production Value Market Share by Region (2021–2026)
Table 19. Global Industrial Catalyst Production Value (US$ Million) Forecast by Region (2027–2032)
Table 20. Global Industrial Catalyst Production Value Market Share Forecast by Region (2027–2032)
Table 21. Global Industrial Catalyst Production Comparison by Region: 2021 vs 2025 vs 2032 (K MT)
Table 22. Global Industrial Catalyst Production (K MT) by Region (2021–2026)
Table 23. Global Industrial Catalyst Production Market Share by Region (2021–2026)
Table 24. Global Industrial Catalyst Production (K MT) Forecast by Region (2027–2032)
Table 25. Global Industrial Catalyst Production Market Share Forecast by Region (2027–2032)
Table 26. Global Industrial Catalyst Market Average Price (USD/MT) by Region (2021–2026)
Table 27. Global Industrial Catalyst Market Average Price (USD/MT) by Region (2027–2032)
Table 28. Global Industrial Catalyst Consumption Growth Rate by Region: 2021 vs 2025 vs 2032 (K MT)
Table 29. Global Industrial Catalyst Consumption by Region (K MT), 2021–2026
Table 30. Global Industrial Catalyst Consumption Market Share by Region (2021–2026)
Table 31. Global Industrial Catalyst Forecasted Consumption by Region (K MT), 2027–2032
Table 32. Global Industrial Catalyst Forecasted Consumption Market Share by Region (2027–2032)
Table 33. North America Industrial Catalyst Consumption Growth Rate by Country: 2021 vs 2025 vs 2032 (K MT)
Table 34. North America Industrial Catalyst Consumption by Country (K MT), 2021–2026
Table 35. North America Industrial Catalyst Consumption by Country (K MT), 2027–2032
Table 36. Europe Industrial Catalyst Consumption Growth Rate by Country: 2021 vs 2025 vs 2032 (K MT)
Table 37. Europe Industrial Catalyst Consumption by Country (K MT), 2021–2026
Table 38. Europe Industrial Catalyst Consumption by Country (K MT), 2027–2032
Table 39. Asia Pacific Industrial Catalyst Consumption Growth Rate by Region: 2021 vs 2025 vs 2032 (K MT)
Table 40. Asia Pacific Industrial Catalyst Consumption by Region (K MT), 2021–2026
Table 41. Asia Pacific Industrial Catalyst Consumption by Region (K MT), 2027–2032
Table 42. Latin America, Middle East & Africa Industrial Catalyst Consumption Growth Rate by Country: 2021 vs 2025 vs 2032 (K MT)
Table 43. Latin America, Middle East & Africa Industrial Catalyst Consumption by Country (K MT), 2021–2026
Table 44. Latin America, Middle East & Africa Industrial Catalyst Consumption by Country (K MT), 2027–2032
Table 45. Global Industrial Catalyst Production (K MT) by Type (2021–2026)
Table 46. Global Industrial Catalyst Production (K MT) by Type (2027–2032)
Table 47. Global Industrial Catalyst Production Market Share by Type (2021–2026)
Table 48. Global Industrial Catalyst Production Market Share by Type (2027–2032)
Table 49. Global Industrial Catalyst Production Value (US$ Million) by Type (2021–2026)
Table 50. Global Industrial Catalyst Production Value (US$ Million) by Type (2027–2032)
Table 51. Global Industrial Catalyst Production Value Market Share by Type (2021–2026)
Table 52. Global Industrial Catalyst Production Value Market Share by Type (2027–2032)
Table 53. Global Industrial Catalyst Price (USD/MT) by Type (2021–2026)
Table 54. Global Industrial Catalyst Price (USD/MT) by Type (2027–2032)
Table 55. Global Industrial Catalyst Production (K MT) by Application (2021–2026)
Table 56. Global Industrial Catalyst Production (K MT) by Application (2027–2032)
Table 57. Global Industrial Catalyst Production Market Share by Application (2021–2026)
Table 58. Global Industrial Catalyst Production Market Share by Application (2027–2032)
Table 59. Global Industrial Catalyst Production Value (US$ Million) by Application (2021–2026)
Table 60. Global Industrial Catalyst Production Value (US$ Million) by Application (2027–2032)
Table 61. Global Industrial Catalyst Production Value Market Share by Application (2021–2026)
Table 62. Global Industrial Catalyst Production Value Market Share by Application (2027–2032)
Table 63. Global Industrial Catalyst Price (USD/MT) by Application (2021–2026)
Table 64. Global Industrial Catalyst Price (USD/MT) by Application (2027–2032)
Table 65. BASF Industrial Catalyst Company Information
Table 66. BASF Industrial Catalyst Specification and Application
Table 67. BASF Industrial Catalyst Production (K MT), Value (US$ Million), Price (USD/MT) and Gross Margin (2021–2026)
Table 68. BASF Main Business and Markets Served
Table 69. BASF Recent Developments/Updates
Table 70. Johnson Matthey Industrial Catalyst Company Information
Table 71. Johnson Matthey Industrial Catalyst Specification and Application
Table 72. Johnson Matthey Industrial Catalyst Production (K MT), Value (US$ Million), Price (USD/MT) and Gross Margin (2021–2026)
Table 73. Johnson Matthey Main Business and Markets Served
Table 74. Johnson Matthey Recent Developments/Updates
Table 75. Clariant Industrial Catalyst Company Information
Table 76. Clariant Industrial Catalyst Specification and Application
Table 77. Clariant Industrial Catalyst Production (K MT), Value (US$ Million), Price (USD/MT) and Gross Margin (2021–2026)
Table 78. Clariant Main Business and Markets Served
Table 79. Clariant Recent Developments/Updates
Table 80. UOP Industrial Catalyst Company Information
Table 81. UOP Industrial Catalyst Specification and Application
Table 82. UOP Industrial Catalyst Production (K MT), Value (US$ Million), Price (USD/MT) and Gross Margin (2021–2026)
Table 83. UOP Main Business and Markets Served
Table 84. UOP Recent Developments/Updates
Table 85. Grace Industrial Catalyst Company Information
Table 86. Grace Industrial Catalyst Specification and Application
Table 87. Grace Industrial Catalyst Production (K MT), Value (US$ Million), Price (USD/MT) and Gross Margin (2021–2026)
Table 88. Grace Main Business and Markets Served
Table 89. Grace Recent Developments/Updates
Table 90. Evonik Industries Industrial Catalyst Company Information
Table 91. Evonik Industries Industrial Catalyst Specification and Application
Table 92. Evonik Industries Industrial Catalyst Production (K MT), Value (US$ Million), Price (USD/MT) and Gross Margin (2021–2026)
Table 93. Evonik Industries Main Business and Markets Served
Table 94. Evonik Industries Recent Developments/Updates
Table 95. Shell Catalysts & Technologies Industrial Catalyst Company Information
Table 96. Shell Catalysts & Technologies Industrial Catalyst Specification and Application
Table 97. Shell Catalysts & Technologies Industrial Catalyst Production (K MT), Value (US$ Million), Price (USD/MT) and Gross Margin (2021–2026)
Table 98. Shell Catalysts & Technologies Main Business and Markets Served
Table 99. Shell Catalysts & Technologies Recent Developments/Updates
Table 100. Sasol Industrial Catalyst Company Information
Table 101. Sasol Industrial Catalyst Specification and Application
Table 102. Sasol Industrial Catalyst Production (K MT), Value (US$ Million), Price (USD/MT) and Gross Margin (2021–2026)
Table 103. Sasol Main Business and Markets Served
Table 104. Sasol Recent Developments/Updates
Table 105. Axens Industrial Catalyst Company Information
Table 106. Axens Industrial Catalyst Specification and Application
Table 107. Axens Industrial Catalyst Production (K MT), Value (US$ Million), Price (USD/MT) and Gross Margin (2021–2026)
Table 108. Axens Main Business and Markets Served
Table 109. Axens Recent Developments/Updates
Table 110. Lyondell Basell Industries Industrial Catalyst Company Information
Table 111. Lyondell Basell Industries Industrial Catalyst Specification and Application
Table 112. Lyondell Basell Industries Industrial Catalyst Production (K MT), Value (US$ Million), Price (USD/MT) and Gross Margin (2021–2026)
Table 113. Lyondell Basell Industries Main Business and Markets Served
Table 114. Lyondell Basell Industries Recent Developments/Updates
Table 115. Ketjen Corporation Industrial Catalyst Company Information
Table 116. Ketjen Corporation Industrial Catalyst Specification and Application
Table 117. Ketjen Corporation Industrial Catalyst Production (K MT), Value (US$ Million), Price (USD/MT) and Gross Margin (2021–2026)
Table 118. Ketjen Corporation Main Business and Markets Served
Table 119. Ketjen Corporation Recent Developments/Updates
Table 120. Ineos Industrial Catalyst Company Information
Table 121. Ineos Industrial Catalyst Specification and Application
Table 122. Ineos Industrial Catalyst Production (K MT), Value (US$ Million), Price (USD/MT) and Gross Margin (2021–2026)
Table 123. Ineos Main Business and Markets Served
Table 124. Ineos Recent Developments/Updates
Table 125. JGC Catalysts and Chemicals Industrial Catalyst Company Information
Table 126. JGC Catalysts and Chemicals Industrial Catalyst Specification and Application
Table 127. JGC Catalysts and Chemicals Industrial Catalyst Production (K MT), Value (US$ Million), Price (USD/MT) and Gross Margin (2021–2026)
Table 128. JGC Catalysts and Chemicals Main Business and Markets Served
Table 129. JGC Catalysts and Chemicals Recent Developments/Updates
Table 130. Univation Technologies Industrial Catalyst Company Information
Table 131. Univation Technologies Industrial Catalyst Specification and Application
Table 132. Univation Technologies Industrial Catalyst Production (K MT), Value (US$ Million), Price (USD/MT) and Gross Margin (2021–2026)
Table 133. Univation Technologies Main Business and Markets Served
Table 134. Univation Technologies Recent Developments/Updates
Table 135. Heraeus Industrial Catalyst Company Information
Table 136. Heraeus Industrial Catalyst Specification and Application
Table 137. Heraeus Industrial Catalyst Production (K MT), Value (US$ Million), Price (USD/MT) and Gross Margin (2021–2026)
Table 138. Heraeus Main Business and Markets Served
Table 139. Heraeus Recent Developments/Updates
Table 140. TANAKA Precious Metal Industrial Catalyst Company Information
Table 141. TANAKA Precious Metal Industrial Catalyst Specification and Application
Table 142. TANAKA Precious Metal Industrial Catalyst Production (K MT), Value (US$ Million), Price (USD/MT) and Gross Margin (2021–2026)
Table 143. TANAKA Precious Metal Main Business and Markets Served
Table 144. TANAKA Precious Metal Recent Developments/Updates
Table 145. Umicore Industrial Catalyst Company Information
Table 146. Umicore Industrial Catalyst Specification and Application
Table 147. Umicore Industrial Catalyst Production (K MT), Value (US$ Million), Price (USD/MT) and Gross Margin (2021–2026)
Table 148. Umicore Main Business and Markets Served
Table 149. Umicore Recent Developments/Updates
Table 150. Dow Industrial Catalyst Company Information
Table 151. Dow Industrial Catalyst Specification and Application
Table 152. Dow Industrial Catalyst Production (K MT), Value (US$ Million), Price (USD/MT) and Gross Margin (2021–2026)
Table 153. Dow Main Business and Markets Served
Table 154. Dow Recent Developments/Updates
Table 155. Cormetech Industrial Catalyst Company Information
Table 156. Cormetech Industrial Catalyst Specification and Application
Table 157. Cormetech Industrial Catalyst Production (K MT), Value (US$ Million), Price (USD/MT) and Gross Margin (2021–2026)
Table 158. Cormetech Main Business and Markets Served
Table 159. Cormetech Recent Developments/Updates
Table 160. Hitachi Zosen Industrial Catalyst Company Information
Table 161. Hitachi Zosen Industrial Catalyst Specification and Application
Table 162. Hitachi Zosen Industrial Catalyst Production (K MT), Value (US$ Million), Price (USD/MT) and Gross Margin (2021–2026)
Table 163. Hitachi Zosen Main Business and Markets Served
Table 164. Hitachi Zosen Recent Developments/Updates
Table 165. Ceram-Ibiden Industrial Catalyst Company Information
Table 166. Ceram-Ibiden Industrial Catalyst Specification and Application
Table 167. Ceram-Ibiden Industrial Catalyst Production (K MT), Value (US$ Million), Price (USD/MT) and Gross Margin (2021–2026)
Table 168. Ceram-Ibiden Main Business and Markets Served
Table 169. Ceram-Ibiden Recent Developments/Updates
Table 170. Sinopec Industrial Catalyst Company Information
Table 171. Sinopec Industrial Catalyst Specification and Application
Table 172. Sinopec Industrial Catalyst Production (K MT), Value (US$ Million), Price (USD/MT) and Gross Margin (2021–2026)
Table 173. Sinopec Main Business and Markets Served
Table 174. Sinopec Recent Developments/Updates
Table 175. CNPC Industrial Catalyst Company Information
Table 176. CNPC Industrial Catalyst Specification and Application
Table 177. CNPC Industrial Catalyst Production (K MT), Value (US$ Million), Price (USD/MT) and Gross Margin (2021–2026)
Table 178. CNPC Main Business and Markets Served
Table 179. CNPC Recent Developments/Updates
Table 180. Kaili Catalyst New Materials Industrial Catalyst Company Information
Table 181. Kaili Catalyst New Materials Industrial Catalyst Specification and Application
Table 182. Kaili Catalyst New Materials Industrial Catalyst Production (K MT), Value (US$ Million), Price (USD/MT) and Gross Margin (2021–2026)
Table 183. Kaili Catalyst New Materials Main Business and Markets Served
Table 184. Kaili Catalyst New Materials Recent Developments/Updates
Table 185. Hcpect Industrial Catalyst Company Information
Table 186. Hcpect Industrial Catalyst Specification and Application
Table 187. Hcpect Industrial Catalyst Production (K MT), Value (US$ Million), Price (USD/MT) and Gross Margin (2021–2026)
Table 188. Hcpect Main Business and Markets Served
Table 189. Hcpect Recent Developments/Updates
Table 190. Yueyang Sciensun Chemical Industrial Catalyst Company Information
Table 191. Yueyang Sciensun Chemical Industrial Catalyst Specification and Application
Table 192. Yueyang Sciensun Chemical Industrial Catalyst Production (K MT), Value (US$ Million), Price (USD/MT) and Gross Margin (2021–2026)
Table 193. Yueyang Sciensun Chemical Main Business and Markets Served
Table 194. Yueyang Sciensun Chemical Recent Developments/Updates
Table 195. Rezel Catalysts Corporation Industrial Catalyst Company Information
Table 196. Rezel Catalysts Corporation Industrial Catalyst Specification and Application
Table 197. Rezel Catalysts Corporation Industrial Catalyst Production (K MT), Value (US$ Million), Price (USD/MT) and Gross Margin (2021–2026)
Table 198. Rezel Catalysts Corporation Main Business and Markets Served
Table 199. Rezel Catalysts Corporation Recent Developments/Updates
Table 200. Synfuels China Industrial Catalyst Company Information
Table 201. Synfuels China Industrial Catalyst Specification and Application
Table 202. Synfuels China Industrial Catalyst Production (K MT), Value (US$ Million), Price (USD/MT) and Gross Margin (2021–2026)
Table 203. Synfuels China Main Business and Markets Served
Table 204. Synfuels China Recent Developments/Updates
Table 205. Hebei Xinpeng Chemical Industry Industrial Catalyst Company Information
Table 206. Hebei Xinpeng Chemical Industry Industrial Catalyst Specification and Application
Table 207. Hebei Xinpeng Chemical Industry Industrial Catalyst Production (K MT), Value (US$ Million), Price (USD/MT) and Gross Margin (2021–2026)
Table 208. Hebei Xinpeng Chemical Industry Main Business and Markets Served
Table 209. Hebei Xinpeng Chemical Industry Recent Developments/Updates
Table 210. Sinochem Chemical Industrial Catalyst Company Information
Table 211. Sinochem Chemical Industrial Catalyst Specification and Application
Table 212. Sinochem Chemical Industrial Catalyst Production (K MT), Value (US$ Million), Price (USD/MT) and Gross Margin (2021–2026)
Table 213. Sinochem Chemical Main Business and Markets Served
Table 214. Sinochem Chemical Recent Developments/Updates
Table 215. Shandong Qilu Keli Chemical Institute Industrial Catalyst Company Information
Table 216. Shandong Qilu Keli Chemical Institute Industrial Catalyst Specification and Application
Table 217. Shandong Qilu Keli Chemical Institute Industrial Catalyst Production (K MT), Value (US$ Million), Price (USD/MT) and Gross Margin (2021–2026)
Table 218. Shandong Qilu Keli Chemical Institute Main Business and Markets Served
Table 219. Shandong Qilu Keli Chemical Institute Recent Developments/Updates
Table 220. Qingdao Lianxin Catalytic Materials Industrial Catalyst Company Information
Table 221. Qingdao Lianxin Catalytic Materials Industrial Catalyst Specification and Application
Table 222. Qingdao Lianxin Catalytic Materials Industrial Catalyst Production (K MT), Value (US$ Million), Price (USD/MT) and Gross Margin (2021–2026)
Table 223. Qingdao Lianxin Catalytic Materials Main Business and Markets Served
Table 224. Qingdao Lianxin Catalytic Materials Recent Developments/Updates
Table 225. ZiBo Luyuan Industrial Catalyst Industrial Catalyst Company Information
Table 226. ZiBo Luyuan Industrial Catalyst Industrial Catalyst Specification and Application
Table 227. ZiBo Luyuan Industrial Catalyst Industrial Catalyst Production (K MT), Value (US$ Million), Price (USD/MT) and Gross Margin (2021–2026)
Table 228. ZiBo Luyuan Industrial Catalyst Main Business and Markets Served
Table 229. ZiBo Luyuan Industrial Catalyst Recent Developments/Updates
Table 230. Haiso Technology Industrial Catalyst Company Information
Table 231. Haiso Technology Industrial Catalyst Specification and Application
Table 232. Haiso Technology Industrial Catalyst Production (K MT), Value (US$ Million), Price (USD/MT) and Gross Margin (2021–2026)
Table 233. Haiso Technology Main Business and Markets Served
Table 234. Haiso Technology Recent Developments/Updates
Table 235. Jiangxi Huihua Technology Industrial Catalyst Company Information
Table 236. Jiangxi Huihua Technology Industrial Catalyst Specification and Application
Table 237. Jiangxi Huihua Technology Industrial Catalyst Production (K MT), Value (US$ Million), Price (USD/MT) and Gross Margin (2021–2026)
Table 238. Jiangxi Huihua Technology Main Business and Markets Served
Table 239. Jiangxi Huihua Technology Recent Developments/Updates
Table 240. CAS KERRY Industrial Catalyst Company Information
Table 241. CAS KERRY Industrial Catalyst Specification and Application
Table 242. CAS KERRY Industrial Catalyst Production (K MT), Value (US$ Million), Price (USD/MT) and Gross Margin (2021–2026)
Table 243. CAS KERRY Main Business and Markets Served
Table 244. CAS KERRY Recent Developments/Updates
Table 245. Sichuan Shutai Industrial Catalyst Company Information
Table 246. Sichuan Shutai Industrial Catalyst Specification and Application
Table 247. Sichuan Shutai Industrial Catalyst Production (K MT), Value (US$ Million), Price (USD/MT) and Gross Margin (2021–2026)
Table 248. Sichuan Shutai Main Business and Markets Served
Table 249. Sichuan Shutai Recent Developments/Updates
Table 250. Dalian Kaitly Catalysis Industrial Catalyst Company Information
Table 251. Dalian Kaitly Catalysis Industrial Catalyst Specification and Application
Table 252. Dalian Kaitly Catalysis Industrial Catalyst Production (K MT), Value (US$ Million), Price (USD/MT) and Gross Margin (2021–2026)
Table 253. Dalian Kaitly Catalysis Main Business and Markets Served
Table 254. Dalian Kaitly Catalysis Recent Developments/Updates
Table 255. Xingyun Chem Industrial Catalyst Company Information
Table 256. Xingyun Chem Industrial Catalyst Specification and Application
Table 257. Xingyun Chem Industrial Catalyst Production (K MT), Value (US$ Million), Price (USD/MT) and Gross Margin (2021–2026)
Table 258. Xingyun Chem Main Business and Markets Served
Table 259. Xingyun Chem Recent Developments/Updates
Table 260. Key Raw Materials Lists
Table 261. Raw Materials Key Suppliers Lists
Table 262. Industrial Catalyst Distributors List
Table 263. Industrial Catalyst Customers List
Table 264. Industrial Catalyst Market Trends
Table 265. Industrial Catalyst Market Drivers
Table 266. Industrial Catalyst Market Challenges
Table 267. Industrial Catalyst Market Restraints
Table 268. Research Programs/Design for This Report
Table 269. Key Data Information from Secondary Sources
Table 270. Key Data Information from Primary Sources
Table 271. Authors List of This Report
List of Figures
Figure 1. Product Picture of Industrial Catalyst
Figure 2. Global Industrial Catalyst Market Value by Type (US$ Million), 2021–2032
Figure 3. Global Industrial Catalyst Market Share by Type: 2025 vs 2032
Figure 4. Metal Catalysts Product Picture
Figure 5. Composite Catalysts Product Picture
Figure 6. Organic Catalysts Product Picture
Figure 7. Solid Acid Catalysts Product Picture
Figure 8. Others Product Picture
Figure 9. Global Industrial Catalyst Market Value by Application (US$ Million), 2021–2032
Figure 10. Global Industrial Catalyst Market Share by Application: 2025 vs 2032
Figure 11. Petroleum Refining
Figure 12. Polyolefin
Figure 13. Chemical Synthesis
Figure 14. Coal Chemical
Figure 15. Environmental
Figure 16. Others
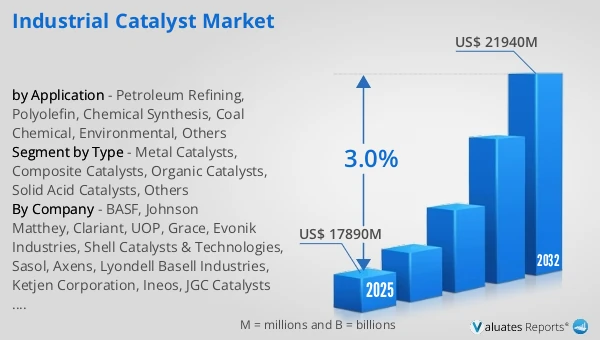
Figure 17. Global Industrial Catalyst Production Value (US$ Million), 2021 vs 2025 vs 2032
Figure 18. Global Industrial Catalyst Production Value (US$ Million), 2021–2032
Figure 19. Global Industrial Catalyst Production Capacity (K MT), 2021–2032
Figure 20. Global Industrial Catalyst Production (K MT), 2021–2032
Figure 21. Global Industrial Catalyst Average Price (USD/MT), 2021–2032
Figure 22. Industrial Catalyst Report Years Considered
Figure 23. Industrial Catalyst Production Share by Manufacturers in 2025
Figure 24. Global Industrial Catalyst Production Value Share by Manufacturers (2025)
Figure 25. Industrial Catalyst Market Share by Company Type (Tier 1, Tier 2, and Tier 3): 2021 vs 2025
Figure 26. Top 5 and Top 10 Global Players: Market Share by Industrial Catalyst Revenue in 2025
Figure 27. Global Industrial Catalyst Production Value by Region: 2021 vs 2025 vs 2032 (US$ Million)
Figure 28. Global Industrial Catalyst Production Value Market Share by Region: 2021 vs 2025 vs 2032
Figure 29. Global Industrial Catalyst Production Comparison by Region: 2021 vs 2025 vs 2032 (K MT)
Figure 30. Global Industrial Catalyst Production Market Share by Region: 2021 vs 2025 vs 2032
Figure 31. North America Industrial Catalyst Production Value (US$ Million) Growth Rate (2021–2032)
Figure 32. Europe Industrial Catalyst Production Value (US$ Million) Growth Rate (2021–2032)
Figure 33. China Industrial Catalyst Production Value (US$ Million) Growth Rate (2021–2032)
Figure 34. Japan Industrial Catalyst Production Value (US$ Million) Growth Rate (2021–2032)
Figure 35. Global Industrial Catalyst Consumption by Region: 2021 vs 2025 vs 2032 (K MT)
Figure 36. Global Industrial Catalyst Consumption Market Share by Region: 2021 vs 2025 vs 2032
Figure 37. North America Industrial Catalyst Consumption and Growth Rate (K MT), 2021–2032
Figure 38. North America Industrial Catalyst Consumption Market Share by Country (2021–2032)
Figure 39. U.S. Industrial Catalyst Consumption and Growth Rate (K MT), 2021–2032
Figure 40. Canada Industrial Catalyst Consumption and Growth Rate (K MT), 2021–2032
Figure 41. Europe Industrial Catalyst Consumption and Growth Rate (K MT), 2021–2032
Figure 42. Europe Industrial Catalyst Consumption Market Share by Country (2021–2032)
Figure 43. Germany Industrial Catalyst Consumption and Growth Rate (K MT), 2021–2032
Figure 44. France Industrial Catalyst Consumption and Growth Rate (K MT), 2021–2032
Figure 45. U.K. Industrial Catalyst Consumption and Growth Rate (K MT), 2021–2032
Figure 46. Italy Industrial Catalyst Consumption and Growth Rate (K MT), 2021–2032
Figure 47. Russia Industrial Catalyst Consumption and Growth Rate (K MT), 2021–2032
Figure 48. Asia Pacific Industrial Catalyst Consumption and Growth Rate (K MT), 2021–2032
Figure 49. Asia Pacific Industrial Catalyst Consumption Market Share by Region (2021–2032)
Figure 50. China Industrial Catalyst Consumption and Growth Rate (K MT), 2021–2032
Figure 51. Japan Industrial Catalyst Consumption and Growth Rate (K MT), 2021–2032
Figure 52. South Korea Industrial Catalyst Consumption and Growth Rate (K MT), 2021–2032
Figure 53. China Taiwan Industrial Catalyst Consumption and Growth Rate (K MT), 2021–2032
Figure 54. Southeast Asia Industrial Catalyst Consumption and Growth Rate (K MT), 2021–2032
Figure 55. India Industrial Catalyst Consumption and Growth Rate (K MT), 2021–2032
Figure 56. Latin America, Middle East & Africa Industrial Catalyst Consumption and Growth Rate (K MT), 2021–2032
Figure 57. Latin America, Middle East & Africa Industrial Catalyst Consumption Market Share by Country (2021–2032)
Figure 58. Mexico Industrial Catalyst Consumption and Growth Rate (K MT), 2021–2032
Figure 59. Brazil Industrial Catalyst Consumption and Growth Rate (K MT), 2021–2032
Figure 60. Turkey Industrial Catalyst Consumption and Growth Rate (K MT), 2021–2032
Figure 61. GCC Countries Industrial Catalyst Consumption and Growth Rate (K MT), 2021–2032
Figure 62. Global Production Market Share of Industrial Catalyst by Type (2021–2032)
Figure 63. Global Production Value Market Share of Industrial Catalyst by Type (2021–2032)
Figure 64. Global Industrial Catalyst Price (USD/MT) by Type (2021–2032)
Figure 65. Global Production Market Share of Industrial Catalyst by Application (2021–2032)
Figure 66. Global Production Value Market Share of Industrial Catalyst by Application (2021–2032)
Figure 67. Global Industrial Catalyst Price (USD/MT) by Application (2021–2032)
Figure 68. Industrial Catalyst Value Chain
Figure 69. Channels of Distribution (Direct Vs Distribution)
Figure 70. Bottom-up and Top-down Approaches for This Report
Figure 71. Data Triangulation