0
U.S. (TOLL FREE)
+1 (315) 215-3225
Automative

0
U.S. (TOLL FREE)
+1 (315) 215-3225
Track Inspection System - Global Market Share and Ranking, Overall Sales and Demand Forecast 2024-2030
Published Date: November 2024
|
Report Code: QYRE-Auto-10L5931
Home | Market Reports | Computers & Electronics| Software
Global Track Inspection System Market Size Status and Forecast 2021 2027
BUY CHAPTERS

Track Inspection System - Global Market Share and Ranking, Overall Sales and Demand Forecast 2024-2030

Code: QYRE-Auto-10L5931
Report
November 2024
Pages:122
QYResearch
Buy Now with 15% Discount
DESCRIPTION
TABLE OF CONTENT
TABLES & FIGURES

Track Inspection System - Market Size

The global market for Track Inspection System was estimated to be worth US$ 722 million in 2023 and is forecast to a readjusted size of US$ 957.4 million by 2030 with a CAGR of 4.6% during the forecast period 2024-2030

Track Inspection System - Market

Track Inspection System - Market

Track Inspection System enables railroads to measure how the track structure performs under the load of a train. ATI systems use lasers and cameras mounted onto locomotives or rail cars and inspect track as the train travels across the network. The system tests each foot of track under the same force as exerted by a loaded train.
North American market for Track Inspection System was valued at $ million in 2023 and will reach $ million by 2030, at a CAGR of % during the forecast period of 2024 through 2030.
Asia-Pacific market for Track Inspection System was valued at $ million in 2023 and will reach $ million by 2030, at a CAGR of % during the forecast period of 2024 through 2030.
Europe market for Track Inspection System was valued at $ million in 2023 and will reach $ million by 2030, at a CAGR of % during the forecast period of 2024 through 2030.
The global key companies of Track Inspection System include Amberg Technologies, Trimble Railway GmbH, ENSCO, MERMEC, Plasser & Theurer, Harsco Rail, Fugro, Holland LP and GRAW, etc. In 2023, the global five largest players hold a share approximately % in terms of revenue.

Report Scope

This report aims to provide a comprehensive presentation of the global market for Track Inspection System, focusing on the total sales revenue, key companies market share and ranking, together with an analysis of Track Inspection System by region & country, by Type, and by Application.
The Track Inspection System market size, estimations, and forecasts are provided in terms of sales revenue ($ millions), considering 2023 as the base year, with history and forecast data for the period from 2019 to 2030. With both quantitative and qualitative analysis, to help readers develop business/growth strategies, assess the market competitive situation, analyze their position in the current marketplace, and make informed business decisions regarding Track Inspection System.
Market Segmentation

Scope of Track Inspection System - Market Report

Report Metric Details
Report Name Track Inspection System - Market
Forecasted market size in 2030 US$ 957.4 million
CAGR 4.6%
Forecasted years 2024 - 2030
Segment by Type:
Segment by Application
By Region
  • North America (United States, Canada)
  • Europe (Germany, France, UK, Italy, Russia) Rest of Europe
  • Nordic Countries
  • Asia-Pacific (China, Japan, South Korea)
  • Southeast Asia (India, Australia)
  • Rest of Asia
  • Latin America (Mexico, Brazil)
  • Rest of Latin America
  • Middle East & Africa (Turkey, Saudi Arabia, UAE, Rest of MEA)
By Company Amberg Technologies, Trimble Railway GmbH, ENSCO, MERMEC, Plasser & Theurer, Harsco Rail, Fugro, Holland LP, GRAW, MRX Technologies, Jiangxi Everbright, Southsurvey, R.Bance & Co Ltd, Rail Vision, ESIM, DMA, Beena Vision, KZV
Forecast units USD million in value
Report coverage Revenue and volume forecast, company share, competitive landscape, growth factors and trends

Chapter Outline

  • Chapter 1: Introduces the report scope of the report, global total market size. This chapter also provides the market dynamics, latest developments of the market, the driving factors and restrictive factors of the market, the challenges and risks faced by manufacturers in the industry, and the analysis of relevant policies in the industry.
  • Chapter 2: Detailed analysis of Track Inspection System manufacturers competitive landscape, revenue market share, latest development plan, merger, and acquisition information, etc.
  • Chapter 3: Provides the analysis of various market segments by Type, covering the market size and development potential of each market segment, to help readers find the blue ocean market in different market segments.
  • Chapter 4: Provides the analysis of various market segments by Application, covering the market size and development potential of each market segment, to help readers find the blue ocean market in different downstream markets.
  • Chapter 5: Revenue of Track Inspection System in regional level. It provides a quantitative analysis of the market size and development potential of each region and introduces the market development, future development prospects, market space, and market size of each country in the world.
  • Chapter 6: Revenue of Track Inspection System in country level. It provides sigmate data by Type, and by Application for each country/region.
  • Chapter 7: Provides profiles of key players, introducing the basic situation of the main companies in the market in detail, including product revenue, gross margin, product introduction, recent development, etc.
  • Chapter 8: Analysis of industrial chain, including the upstream and downstream of the industry.
  • Chapter 9: Conclusion.

FAQ for this report

What is the Track Inspection System - Market size in 2030?

Ans: The Track Inspection System - Market size in 2030 will be US$ 957.4 million.

Who are the main players in the Track Inspection System - Market report?

Ans: The main players in the Track Inspection System - Market are Amberg Technologies, Trimble Railway GmbH, ENSCO, MERMEC, Plasser & Theurer, Harsco Rail, Fugro, Holland LP, GRAW, MRX Technologies, Jiangxi Everbright, Southsurvey, R.Bance & Co Ltd, Rail Vision, ESIM, DMA, Beena Vision, KZV

What are the Application segmentation covered in the Track Inspection System - Market report?

Ans: The Applications covered in the Track Inspection System - Market report are High-Speed Railway, Heavy Haul Railway, Conventional Railway, Urban Transport

What are the Type segmentation covered in the Track Inspection System - Market report?

Ans: The Types covered in the Track Inspection System - Market report are Autonomous Track Inspection Systems, Manual Track Inspection Systems

Recommended Reports

Inspection Systems

Rail & Track

Electronics Inspection

1 Market Overview
1.1 Track Inspection System Product Introduction
1.2 Global Track Inspection System Market Size Forecast
1.3 Track Inspection System Market Trends & Drivers
1.3.1 Track Inspection System Industry Trends
1.3.2 Track Inspection System Market Drivers & Opportunity
1.3.3 Track Inspection System Market Challenges
1.3.4 Track Inspection System Market Restraints
1.4 Assumptions and Limitations
1.5 Study Objectives
1.6 Years Considered
2 Competitive Analysis by Company
2.1 Global Track Inspection System Players Revenue Ranking (2023)
2.2 Global Track Inspection System Revenue by Company (2019-2024)
2.3 Key Companies Track Inspection System Manufacturing Base Distribution and Headquarters
2.4 Key Companies Track Inspection System Product Offered
2.5 Key Companies Time to Begin Mass Production of Track Inspection System
2.6 Track Inspection System Market Competitive Analysis
2.6.1 Track Inspection System Market Concentration Rate (2019-2024)
2.6.2 Global 5 and 10 Largest Companies by Track Inspection System Revenue in 2023
2.6.3 Global Top Companies by Company Type (Tier 1, Tier 2, and Tier 3) & (based on the Revenue in Track Inspection System as of 2023)
2.7 Mergers & Acquisitions, Expansion
3 Segmentation by Type
3.1 Introduction by Type
3.1.1 Autonomous Track Inspection Systems
3.1.2 Manual Track Inspection Systems
3.2 Global Track Inspection System Sales Value by Type
3.2.1 Global Track Inspection System Sales Value by Type (2019 VS 2023 VS 2030)
3.2.2 Global Track Inspection System Sales Value, by Type (2019-2030)
3.2.3 Global Track Inspection System Sales Value, by Type (%) (2019-2030)
4 Segmentation by Application
4.1 Introduction by Application
4.1.1 High-Speed Railway
4.1.2 Heavy Haul Railway
4.1.3 Conventional Railway
4.1.4 Urban Transport
4.2 Global Track Inspection System Sales Value by Application
4.2.1 Global Track Inspection System Sales Value by Application (2019 VS 2023 VS 2030)
4.2.2 Global Track Inspection System Sales Value, by Application (2019-2030)
4.2.3 Global Track Inspection System Sales Value, by Application (%) (2019-2030)
5 Segmentation by Region
5.1 Global Track Inspection System Sales Value by Region
5.1.1 Global Track Inspection System Sales Value by Region: 2019 VS 2023 VS 2030
5.1.2 Global Track Inspection System Sales Value by Region (2019-2024)
5.1.3 Global Track Inspection System Sales Value by Region (2025-2030)
5.1.4 Global Track Inspection System Sales Value by Region (%), (2019-2030)
5.2 North America
5.2.1 North America Track Inspection System Sales Value, 2019-2030
5.2.2 North America Track Inspection System Sales Value by Country (%), 2023 VS 2030
5.3 Europe
5.3.1 Europe Track Inspection System Sales Value, 2019-2030
5.3.2 Europe Track Inspection System Sales Value by Country (%), 2023 VS 2030
5.4 Asia Pacific
5.4.1 Asia Pacific Track Inspection System Sales Value, 2019-2030
5.4.2 Asia Pacific Track Inspection System Sales Value by Country (%), 2023 VS 2030
5.5 South America
5.5.1 South America Track Inspection System Sales Value, 2019-2030
5.5.2 South America Track Inspection System Sales Value by Country (%), 2023 VS 2030
5.6 Middle East & Africa
5.6.1 Middle East & Africa Track Inspection System Sales Value, 2019-2030
5.6.2 Middle East & Africa Track Inspection System Sales Value by Country (%), 2023 VS 2030
6 Segmentation by Key Countries/Regions
6.1 Key Countries/Regions Track Inspection System Sales Value Growth Trends, 2019 VS 2023 VS 2030
6.2 Key Countries/Regions Track Inspection System Sales Value
6.3 United States
6.3.1 United States Track Inspection System Sales Value, 2019-2030
6.3.2 United States Track Inspection System Sales Value by Type (%), 2023 VS 2030
6.3.3 United States Track Inspection System Sales Value by Application, 2023 VS 2030
6.4 Europe
6.4.1 Europe Track Inspection System Sales Value, 2019-2030
6.4.2 Europe Track Inspection System Sales Value by Type (%), 2023 VS 2030
6.4.3 Europe Track Inspection System Sales Value by Application, 2023 VS 2030
6.5 China
6.5.1 China Track Inspection System Sales Value, 2019-2030
6.5.2 China Track Inspection System Sales Value by Type (%), 2023 VS 2030
6.5.3 China Track Inspection System Sales Value by Application, 2023 VS 2030
6.6 Japan
6.6.1 Japan Track Inspection System Sales Value, 2019-2030
6.6.2 Japan Track Inspection System Sales Value by Type (%), 2023 VS 2030
6.6.3 Japan Track Inspection System Sales Value by Application, 2023 VS 2030
6.7 South Korea
6.7.1 South Korea Track Inspection System Sales Value, 2019-2030
6.7.2 South Korea Track Inspection System Sales Value by Type (%), 2023 VS 2030
6.7.3 South Korea Track Inspection System Sales Value by Application, 2023 VS 2030
6.8 Southeast Asia
6.8.1 Southeast Asia Track Inspection System Sales Value, 2019-2030
6.8.2 Southeast Asia Track Inspection System Sales Value by Type (%), 2023 VS 2030
6.8.3 Southeast Asia Track Inspection System Sales Value by Application, 2023 VS 2030
6.9 India
6.9.1 India Track Inspection System Sales Value, 2019-2030
6.9.2 India Track Inspection System Sales Value by Type (%), 2023 VS 2030
6.9.3 India Track Inspection System Sales Value by Application, 2023 VS 2030
7 Company Profiles
7.1 Amberg Technologies
7.1.1 Amberg Technologies Profile
7.1.2 Amberg Technologies Main Business
7.1.3 Amberg Technologies Track Inspection System Products, Services and Solutions
7.1.4 Amberg Technologies Track Inspection System Revenue (US$ Million) & (2019-2024)
7.1.5 Amberg Technologies Recent Developments
7.2 Trimble Railway GmbH
7.2.1 Trimble Railway GmbH Profile
7.2.2 Trimble Railway GmbH Main Business
7.2.3 Trimble Railway GmbH Track Inspection System Products, Services and Solutions
7.2.4 Trimble Railway GmbH Track Inspection System Revenue (US$ Million) & (2019-2024)
7.2.5 Trimble Railway GmbH Recent Developments
7.3 ENSCO
7.3.1 ENSCO Profile
7.3.2 ENSCO Main Business
7.3.3 ENSCO Track Inspection System Products, Services and Solutions
7.3.4 ENSCO Track Inspection System Revenue (US$ Million) & (2019-2024)
7.3.5 MERMEC Recent Developments
7.4 MERMEC
7.4.1 MERMEC Profile
7.4.2 MERMEC Main Business
7.4.3 MERMEC Track Inspection System Products, Services and Solutions
7.4.4 MERMEC Track Inspection System Revenue (US$ Million) & (2019-2024)
7.4.5 MERMEC Recent Developments
7.5 Plasser & Theurer
7.5.1 Plasser & Theurer Profile
7.5.2 Plasser & Theurer Main Business
7.5.3 Plasser & Theurer Track Inspection System Products, Services and Solutions
7.5.4 Plasser & Theurer Track Inspection System Revenue (US$ Million) & (2019-2024)
7.5.5 Plasser & Theurer Recent Developments
7.6 Harsco Rail
7.6.1 Harsco Rail Profile
7.6.2 Harsco Rail Main Business
7.6.3 Harsco Rail Track Inspection System Products, Services and Solutions
7.6.4 Harsco Rail Track Inspection System Revenue (US$ Million) & (2019-2024)
7.6.5 Harsco Rail Recent Developments
7.7 Fugro
7.7.1 Fugro Profile
7.7.2 Fugro Main Business
7.7.3 Fugro Track Inspection System Products, Services and Solutions
7.7.4 Fugro Track Inspection System Revenue (US$ Million) & (2019-2024)
7.7.5 Fugro Recent Developments
7.8 Holland LP
7.8.1 Holland LP Profile
7.8.2 Holland LP Main Business
7.8.3 Holland LP Track Inspection System Products, Services and Solutions
7.8.4 Holland LP Track Inspection System Revenue (US$ Million) & (2019-2024)
7.8.5 Holland LP Recent Developments
7.9 GRAW
7.9.1 GRAW Profile
7.9.2 GRAW Main Business
7.9.3 GRAW Track Inspection System Products, Services and Solutions
7.9.4 GRAW Track Inspection System Revenue (US$ Million) & (2019-2024)
7.9.5 GRAW Recent Developments
7.10 MRX Technologies
7.10.1 MRX Technologies Profile
7.10.2 MRX Technologies Main Business
7.10.3 MRX Technologies Track Inspection System Products, Services and Solutions
7.10.4 MRX Technologies Track Inspection System Revenue (US$ Million) & (2019-2024)
7.10.5 MRX Technologies Recent Developments
7.11 Jiangxi Everbright
7.11.1 Jiangxi Everbright Profile
7.11.2 Jiangxi Everbright Main Business
7.11.3 Jiangxi Everbright Track Inspection System Products, Services and Solutions
7.11.4 Jiangxi Everbright Track Inspection System Revenue (US$ Million) & (2019-2024)
7.11.5 Jiangxi Everbright Recent Developments
7.12 Southsurvey
7.12.1 Southsurvey Profile
7.12.2 Southsurvey Main Business
7.12.3 Southsurvey Track Inspection System Products, Services and Solutions
7.12.4 Southsurvey Track Inspection System Revenue (US$ Million) & (2019-2024)
7.12.5 Southsurvey Recent Developments
7.13 R.Bance & Co Ltd
7.13.1 R.Bance & Co Ltd Profile
7.13.2 R.Bance & Co Ltd Main Business
7.13.3 R.Bance & Co Ltd Track Inspection System Products, Services and Solutions
7.13.4 R.Bance & Co Ltd Track Inspection System Revenue (US$ Million) & (2019-2024)
7.13.5 R.Bance & Co Ltd Recent Developments
7.14 Rail Vision
7.14.1 Rail Vision Profile
7.14.2 Rail Vision Main Business
7.14.3 Rail Vision Track Inspection System Products, Services and Solutions
7.14.4 Rail Vision Track Inspection System Revenue (US$ Million) & (2019-2024)
7.14.5 Rail Vision Recent Developments
7.15 ESIM
7.15.1 ESIM Profile
7.15.2 ESIM Main Business
7.15.3 ESIM Track Inspection System Products, Services and Solutions
7.15.4 ESIM Track Inspection System Revenue (US$ Million) & (2019-2024)
7.15.5 ESIM Recent Developments
7.16 DMA
7.16.1 DMA Profile
7.16.2 DMA Main Business
7.16.3 DMA Track Inspection System Products, Services and Solutions
7.16.4 DMA Track Inspection System Revenue (US$ Million) & (2019-2024)
7.16.5 DMA Recent Developments
7.17 Beena Vision
7.17.1 Beena Vision Profile
7.17.2 Beena Vision Main Business
7.17.3 Beena Vision Track Inspection System Products, Services and Solutions
7.17.4 Beena Vision Track Inspection System Revenue (US$ Million) & (2019-2024)
7.17.5 Beena Vision Recent Developments
7.18 KZV
7.18.1 KZV Profile
7.18.2 KZV Main Business
7.18.3 KZV Track Inspection System Products, Services and Solutions
7.18.4 KZV Track Inspection System Revenue (US$ Million) & (2019-2024)
7.18.5 KZV Recent Developments
8 Industry Chain Analysis
8.1 Track Inspection System Industrial Chain
8.2 Track Inspection System Upstream Analysis
8.2.1 Key Raw Materials
8.2.2 Raw Materials Key Suppliers
8.2.3 Manufacturing Cost Structure
8.3 Midstream Analysis
8.4 Downstream Analysis (Customers Analysis)
8.5 Sales Model and Sales Channels
8.5.1 Track Inspection System Sales Model
8.5.2 Sales Channel
8.5.3 Track Inspection System Distributors
9 Research Findings and Conclusion
10 Appendix
10.1 Research Methodology
10.1.1 Methodology/Research Approach
10.1.2 Data Source
10.2 Author Details
10.3 Disclaimer
List of Tables
    Table 1. Track Inspection System Market Trends
    Table 2. Track Inspection System Market Drivers & Opportunity
    Table 3. Track Inspection System Market Challenges
    Table 4. Track Inspection System Market Restraints
    Table 5. Global Track Inspection System Revenue by Company (2019-2024) & (US$ Million)
    Table 6. Global Track Inspection System Revenue Market Share by Company (2019-2024)
    Table 7. Key Companies Track Inspection System Manufacturing Base Distribution and Headquarters
    Table 8. Key Companies Track Inspection System Product Type
    Table 9. Key Companies Time to Begin Mass Production of Track Inspection System
    Table 10. Global Track Inspection System Companies Market Concentration Ratio (CR5 and HHI)
    Table 11. Global Top Companies Market Share by Company Type (Tier 1, Tier 2, and Tier 3) & (based on the Revenue in Track Inspection System as of 2023)
    Table 12. Mergers & Acquisitions, Expansion Plans
    Table 13. Global Track Inspection System Sales Value by Type: 2019 VS 2023 VS 2030 (US$ Million)
    Table 14. Global Track Inspection System Sales Value by Type (2019-2024) & (US$ Million)
    Table 15. Global Track Inspection System Sales Value by Type (2025-2030) & (US$ Million)
    Table 16. Global Track Inspection System Sales Market Share in Value by Type (2019-2024) & (%)
    Table 17. Global Track Inspection System Sales Market Share in Value by Type (2025-2030) & (%)
    Table 18. Global Track Inspection System Sales Value by Application: 2019 VS 2023 VS 2030 (US$ Million)
    Table 19. Global Track Inspection System Sales Value by Application (2019-2024) & (US$ Million)
    Table 20. Global Track Inspection System Sales Value by Application (2025-2030) & (US$ Million)
    Table 21. Global Track Inspection System Sales Market Share in Value by Application (2019-2024) & (%)
    Table 22. Global Track Inspection System Sales Market Share in Value by Application (2025-2030) & (%)
    Table 23. Global Track Inspection System Sales Value by Region: 2019 VS 2023 VS 2030 (US$ Million)
    Table 24. Global Track Inspection System Sales Value by Region (2019-2024) & (US$ Million)
    Table 25. Global Track Inspection System Sales Value by Region (2025-2030) & (US$ Million)
    Table 26. Global Track Inspection System Sales Value by Region (2019-2024) & (%)
    Table 27. Global Track Inspection System Sales Value by Region (2025-2030) & (%)
    Table 28. Key Countries/Regions Track Inspection System Sales Value Growth Trends, (US$ Million): 2019 VS 2023 VS 2030
    Table 29. Key Countries/Regions Track Inspection System Sales Value, (2019-2024) & (US$ Million)
    Table 30. Key Countries/Regions Track Inspection System Sales Value, (2025-2030) & (US$ Million)
    Table 31. Amberg Technologies Basic Information List
    Table 32. Amberg Technologies Description and Business Overview
    Table 33. Amberg Technologies Track Inspection System Products, Services and Solutions
    Table 34. Revenue (US$ Million) in Track Inspection System Business of Amberg Technologies (2019-2024)
    Table 35. Amberg Technologies Recent Developments
    Table 36. Trimble Railway GmbH Basic Information List
    Table 37. Trimble Railway GmbH Description and Business Overview
    Table 38. Trimble Railway GmbH Track Inspection System Products, Services and Solutions
    Table 39. Revenue (US$ Million) in Track Inspection System Business of Trimble Railway GmbH (2019-2024)
    Table 40. Trimble Railway GmbH Recent Developments
    Table 41. ENSCO Basic Information List
    Table 42. ENSCO Description and Business Overview
    Table 43. ENSCO Track Inspection System Products, Services and Solutions
    Table 44. Revenue (US$ Million) in Track Inspection System Business of ENSCO (2019-2024)
    Table 45. ENSCO Recent Developments
    Table 46. MERMEC Basic Information List
    Table 47. MERMEC Description and Business Overview
    Table 48. MERMEC Track Inspection System Products, Services and Solutions
    Table 49. Revenue (US$ Million) in Track Inspection System Business of MERMEC (2019-2024)
    Table 50. MERMEC Recent Developments
    Table 51. Plasser & Theurer Basic Information List
    Table 52. Plasser & Theurer Description and Business Overview
    Table 53. Plasser & Theurer Track Inspection System Products, Services and Solutions
    Table 54. Revenue (US$ Million) in Track Inspection System Business of Plasser & Theurer (2019-2024)
    Table 55. Plasser & Theurer Recent Developments
    Table 56. Harsco Rail Basic Information List
    Table 57. Harsco Rail Description and Business Overview
    Table 58. Harsco Rail Track Inspection System Products, Services and Solutions
    Table 59. Revenue (US$ Million) in Track Inspection System Business of Harsco Rail (2019-2024)
    Table 60. Harsco Rail Recent Developments
    Table 61. Fugro Basic Information List
    Table 62. Fugro Description and Business Overview
    Table 63. Fugro Track Inspection System Products, Services and Solutions
    Table 64. Revenue (US$ Million) in Track Inspection System Business of Fugro (2019-2024)
    Table 65. Fugro Recent Developments
    Table 66. Holland LP Basic Information List
    Table 67. Holland LP Description and Business Overview
    Table 68. Holland LP Track Inspection System Products, Services and Solutions
    Table 69. Revenue (US$ Million) in Track Inspection System Business of Holland LP (2019-2024)
    Table 70. Holland LP Recent Developments
    Table 71. GRAW Basic Information List
    Table 72. GRAW Description and Business Overview
    Table 73. GRAW Track Inspection System Products, Services and Solutions
    Table 74. Revenue (US$ Million) in Track Inspection System Business of GRAW (2019-2024)
    Table 75. GRAW Recent Developments
    Table 76. MRX Technologies Basic Information List
    Table 77. MRX Technologies Description and Business Overview
    Table 78. MRX Technologies Track Inspection System Products, Services and Solutions
    Table 79. Revenue (US$ Million) in Track Inspection System Business of MRX Technologies (2019-2024)
    Table 80. MRX Technologies Recent Developments
    Table 81. Jiangxi Everbright Basic Information List
    Table 82. Jiangxi Everbright Description and Business Overview
    Table 83. Jiangxi Everbright Track Inspection System Products, Services and Solutions
    Table 84. Revenue (US$ Million) in Track Inspection System Business of Jiangxi Everbright (2019-2024)
    Table 85. Jiangxi Everbright Recent Developments
    Table 86. Southsurvey Basic Information List
    Table 87. Southsurvey Description and Business Overview
    Table 88. Southsurvey Track Inspection System Products, Services and Solutions
    Table 89. Revenue (US$ Million) in Track Inspection System Business of Southsurvey (2019-2024)
    Table 90. Southsurvey Recent Developments
    Table 91. R.Bance & Co Ltd Basic Information List
    Table 92. R.Bance & Co Ltd Description and Business Overview
    Table 93. R.Bance & Co Ltd Track Inspection System Products, Services and Solutions
    Table 94. Revenue (US$ Million) in Track Inspection System Business of R.Bance & Co Ltd (2019-2024)
    Table 95. R.Bance & Co Ltd Recent Developments
    Table 96. Rail Vision Basic Information List
    Table 97. Rail Vision Description and Business Overview
    Table 98. Rail Vision Track Inspection System Products, Services and Solutions
    Table 99. Revenue (US$ Million) in Track Inspection System Business of Rail Vision (2019-2024)
    Table 100. Rail Vision Recent Developments
    Table 101. ESIM Basic Information List
    Table 102. ESIM Description and Business Overview
    Table 103. ESIM Track Inspection System Products, Services and Solutions
    Table 104. Revenue (US$ Million) in Track Inspection System Business of ESIM (2019-2024)
    Table 105. ESIM Recent Developments
    Table 106. DMA Basic Information List
    Table 107. DMA Description and Business Overview
    Table 108. DMA Track Inspection System Products, Services and Solutions
    Table 109. Revenue (US$ Million) in Track Inspection System Business of DMA (2019-2024)
    Table 110. DMA Recent Developments
    Table 111. Beena Vision Basic Information List
    Table 112. Beena Vision Description and Business Overview
    Table 113. Beena Vision Track Inspection System Products, Services and Solutions
    Table 114. Revenue (US$ Million) in Track Inspection System Business of Beena Vision (2019-2024)
    Table 115. Beena Vision Recent Developments
    Table 116. KZV Basic Information List
    Table 117. KZV Description and Business Overview
    Table 118. KZV Track Inspection System Products, Services and Solutions
    Table 119. Revenue (US$ Million) in Track Inspection System Business of KZV (2019-2024)
    Table 120. KZV Recent Developments
    Table 121. Key Raw Materials Lists
    Table 122. Raw Materials Key Suppliers Lists
    Table 123. Track Inspection System Downstream Customers
    Table 124. Track Inspection System Distributors List
    Table 125. Research Programs/Design for This Report
    Table 126. Key Data Information from Secondary Sources
    Table 127. Key Data Information from Primary Sources
    Table 128. Business Unit and Senior & Team Lead Analysts
List of Figures
    Figure 1. Track Inspection System Product Picture
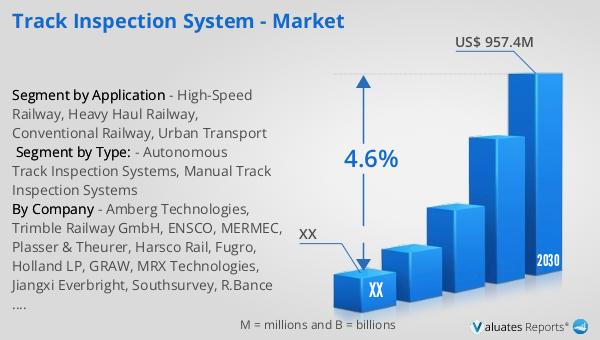
    Figure 2. Global Track Inspection System Sales Value, 2019 VS 2023 VS 2030 (US$ Million)
    Figure 3. Global Track Inspection System Sales Value (2019-2030) & (US$ Million)
    Figure 4. Track Inspection System Report Years Considered
    Figure 5. Global Track Inspection System Players Revenue Ranking (2023) & (US$ Million)
    Figure 6. The 5 and 10 Largest Manufacturers in the World: Market Share by Track Inspection System Revenue in 2023
    Figure 7. Track Inspection System Market Share by Company Type (Tier 1, Tier 2, and Tier 3): 2019 VS 2023
    Figure 8. Autonomous Track Inspection Systems Picture
    Figure 9. Manual Track Inspection Systems Picture
    Figure 10. Global Track Inspection System Sales Value by Type (2019 VS 2023 VS 2030) & (US$ Million)
    Figure 11. Global Track Inspection System Sales Value Market Share by Type, 2023 & 2030
    Figure 12. Product Picture of High-Speed Railway
    Figure 13. Product Picture of Heavy Haul Railway
    Figure 14. Product Picture of Conventional Railway
    Figure 15. Product Picture of Urban Transport
    Figure 16. Global Track Inspection System Sales Value by Application (2019 VS 2023 VS 2030) & (US$ Million)
    Figure 17. Global Track Inspection System Sales Value Market Share by Application, 2023 & 2030
    Figure 18. North America Track Inspection System Sales Value (2019-2030) & (US$ Million)
    Figure 19. North America Track Inspection System Sales Value by Country (%), 2023 VS 2030
    Figure 20. Europe Track Inspection System Sales Value (2019-2030) & (US$ Million)
    Figure 21. Europe Track Inspection System Sales Value by Country (%), 2023 VS 2030
    Figure 22. Asia Pacific Track Inspection System Sales Value (2019-2030) & (US$ Million)
    Figure 23. Asia Pacific Track Inspection System Sales Value by Country (%), 2023 VS 2030
    Figure 24. South America Track Inspection System Sales Value (2019-2030) & (US$ Million)
    Figure 25. South America Track Inspection System Sales Value by Country (%), 2023 VS 2030
    Figure 26. Middle East & Africa Track Inspection System Sales Value (2019-2030) & (US$ Million)
    Figure 27. Middle East & Africa Track Inspection System Sales Value by Country (%), 2023 VS 2030
    Figure 28. Key Countries/Regions Track Inspection System Sales Value (%), (2019-2030)
    Figure 29. United States Track Inspection System Sales Value, (2019-2030) & (US$ Million)
    Figure 30. United States Track Inspection System Sales Value by Type (%), 2023 VS 2030
    Figure 31. United States Track Inspection System Sales Value by Application (%), 2023 VS 2030
    Figure 32. Europe Track Inspection System Sales Value, (2019-2030) & (US$ Million)
    Figure 33. Europe Track Inspection System Sales Value by Type (%), 2023 VS 2030
    Figure 34. Europe Track Inspection System Sales Value by Application (%), 2023 VS 2030
    Figure 35. China Track Inspection System Sales Value, (2019-2030) & (US$ Million)
    Figure 36. China Track Inspection System Sales Value by Type (%), 2023 VS 2030
    Figure 37. China Track Inspection System Sales Value by Application (%), 2023 VS 2030
    Figure 38. Japan Track Inspection System Sales Value, (2019-2030) & (US$ Million)
    Figure 39. Japan Track Inspection System Sales Value by Type (%), 2023 VS 2030
    Figure 40. Japan Track Inspection System Sales Value by Application (%), 2023 VS 2030
    Figure 41. South Korea Track Inspection System Sales Value, (2019-2030) & (US$ Million)
    Figure 42. South Korea Track Inspection System Sales Value by Type (%), 2023 VS 2030
    Figure 43. South Korea Track Inspection System Sales Value by Application (%), 2023 VS 2030
    Figure 44. Southeast Asia Track Inspection System Sales Value, (2019-2030) & (US$ Million)
    Figure 45. Southeast Asia Track Inspection System Sales Value by Type (%), 2023 VS 2030
    Figure 46. Southeast Asia Track Inspection System Sales Value by Application (%), 2023 VS 2030
    Figure 47. India Track Inspection System Sales Value, (2019-2030) & (US$ Million)
    Figure 48. India Track Inspection System Sales Value by Type (%), 2023 VS 2030
    Figure 49. India Track Inspection System Sales Value by Application (%), 2023 VS 2030
    Figure 50. Track Inspection System Industrial Chain
    Figure 51. Track Inspection System Manufacturing Cost Structure
    Figure 52. Channels of Distribution (Direct Sales, and Distribution)
    Figure 53. Bottom-up and Top-down Approaches for This Report
    Figure 54. Data Triangulation
SELECT A FORMAT
Added to Cart
Electronic (PDF)

$3950

This license allows only one user to access the PDF.
Electronic (PDF)

$5925

This license allows 1 - 5 user to access the PDF, license is suitable for small groups of 5 users working together
Electronic (PDF)

$7900

This license allows users/teams in a same Enterprise to use this report, various departments within an enterpise can use this report
Add to Cart
Buy Now (15% Discount)

OUR CUSTOMER

Nano Dimension

RELATED REPORTS

Global Failure Analysis and Investigation Services Market Research Report 2025

120 Pages
Type: Report
Code: QYRE-Auto-25S19602
Tue Sep 16 00:00:00 UTC 2025

Add to Cart

Global Mine Schedule Software Market Research Report 2025

120 Pages
Type: Report
Code: QYRE-Auto-14P19942
Tue Sep 16 00:00:00 UTC 2025

Add to Cart

Global Mine Survey Software Market Research Report 2025

120 Pages
Type: Report
Code: QYRE-Auto-1N19842
Tue Sep 16 00:00:00 UTC 2025

Add to Cart

Global Cotton ERP System Market Research Report 2025

120 Pages
Type: Report
Code: QYRE-Auto-6T20027
Tue Sep 16 00:00:00 UTC 2025

Add to Cart