List of Tables
Table 1. Global Cross Trading Service Market Size Growth Rate by Type (US$ Million): 2021 vs 2025 vs 2032
Table 2. Key Players of Sea Freight
Table 3. Key Players of Air Freight
Table 4. Key Players of Land Freight
Table 5. Key Players of Others
Table 6. Global Cross Trading Service Market Size Growth Rate by Service Component (US$ Million): 2021 vs 2025 vs 2032
Table 7. Key Players of Trade Execution
Table 8. Key Players of Trade Finance
Table 9. Key Players of Logistics Orchestration
Table 10. Key Players of Compliance & Regulatory
Table 11. Key Players of Settlement & Accounting
Table 12. Global Cross Trading Service Market Size Growth Rate by Transaction Structure (US$ Million): 2021 vs 2025 vs 2032
Table 13. Key Players of Triangular Trade
Table 14. Key Players of Back-to-Back
Table 15. Key Players of Merchant Trading
Table 16. Key Players of Agency/Commission
Table 17. Key Players of Transit/Entrepôt
Table 18. Global Cross Trading Service Market Size Growth by Application (US$ Million): 2021 vs 2025 vs 2032
Table 19. Global Cross Trading Service Market Size by Region (US$ Million): 2021 vs 2025 vs 2032
Table 20. Global Cross Trading Service Market Size by Region (US$ Million), 2021–2026
Table 21. Global Cross Trading Service Market Share by Region (2021–2026)
Table 22. Global Cross Trading Service Forecasted Market Size by Region (US$ Million), 2027–2032
Table 23. Global Cross Trading Service Market Share by Region (2027–2032)
Table 24. Cross Trading Service Market Trends
Table 25. Cross Trading Service Market Drivers
Table 26. Cross Trading Service Market Challenges
Table 27. Cross Trading Service Market Restraints
Table 28. Global Cross Trading Service Revenue by Players (US$ Million), 2021–2026
Table 29. Global Cross Trading Service Market Share by Players (2021–2026)
Table 30. Global Top Cross Trading Service Players by Tier (Tier 1, Tier 2, and Tier 3), based on Cross Trading Service Revenue, 2025
Table 31. Ranking of Global Top Cross Trading Service Companies by Revenue (US$ Million) in 2025
Table 32. Global 5 Largest Players Market Share by Cross Trading Service Revenue (CR5 and HHI), 2021–2026
Table 33. Global Key Players of Cross Trading Service, Headquarters and Area Served
Table 34. Global Key Players of Cross Trading Service, Products and Applications
Table 35. Global Key Players of Cross Trading Service, Date of General Availability (GA)
Table 36. Mergers and Acquisitions, Expansion Plans
Table 37. Global Cross Trading Service Market Size by Type (US$ Million), 2021–2026
Table 38. Global Cross Trading Service Revenue Market Share by Type (2021–2026)
Table 39. Global Cross Trading Service Forecasted Market Size by Type (US$ Million), 2027–2032
Table 40. Global Cross Trading Service Revenue Market Share by Type (2027–2032)
Table 41. Global Cross Trading Service Market Size by Application (US$ Million), 2021–2026
Table 42. Global Cross Trading Service Revenue Market Share by Application (2021–2026)
Table 43. Global Cross Trading Service Forecasted Market Size by Application (US$ Million), 2027–2032
Table 44. Global Cross Trading Service Revenue Market Share by Application (2027–2032)
Table 45. North America Cross Trading Service Market Size Growth Rate by Country (US$ Million): 2021 vs 2025 vs 2032
Table 46. North America Cross Trading Service Market Size by Country (US$ Million), 2021–2026
Table 47. North America Cross Trading Service Market Size by Country (US$ Million), 2027–2032
Table 48. Europe Cross Trading Service Market Size Growth Rate by Country (US$ Million): 2021 vs 2025 vs 2032
Table 49. Europe Cross Trading Service Market Size by Country (US$ Million), 2021–2026
Table 50. Europe Cross Trading Service Market Size by Country (US$ Million), 2027–2032
Table 51. Asia-Pacific Cross Trading Service Market Size Growth Rate by Region (US$ Million): 2021 vs 2025 vs 2032
Table 52. Asia-Pacific Cross Trading Service Market Size by Region (US$ Million), 2021–2026
Table 53. Asia-Pacific Cross Trading Service Market Size by Region (US$ Million), 2027–2032
Table 54. Latin America Cross Trading Service Market Size Growth Rate by Country (US$ Million): 2021 vs 2025 vs 2032
Table 55. Latin America Cross Trading Service Market Size by Country (US$ Million), 2021–2026
Table 56. Latin America Cross Trading Service Market Size by Country (US$ Million), 2027–2032
Table 57. Middle East & Africa Cross Trading Service Market Size Growth Rate by Country (US$ Million): 2021 vs 2025 vs 2032
Table 58. Middle East & Africa Cross Trading Service Market Size by Country (US$ Million), 2021–2026
Table 59. Middle East & Africa Cross Trading Service Market Size by Country (US$ Million), 2027–2032
Table 60. Alliance Company Details
Table 61. Alliance Business Overview
Table 62. Alliance Cross Trading Service Product
Table 63. Alliance Revenue in Cross Trading Service Business (US$ Million), 2021–2026
Table 64. Alliance Recent Development
Table 65. Global Freight Company Details
Table 66. Global Freight Business Overview
Table 67. Global Freight Cross Trading Service Product
Table 68. Global Freight Revenue in Cross Trading Service Business (US$ Million), 2021–2026
Table 69. Global Freight Recent Development
Table 70. ICE Cargo Company Details
Table 71. ICE Cargo Business Overview
Table 72. ICE Cargo Cross Trading Service Product
Table 73. ICE Cargo Revenue in Cross Trading Service Business (US$ Million), 2021–2026
Table 74. ICE Cargo Recent Development
Table 75. Spatial Globals Company Details
Table 76. Spatial Globals Business Overview
Table 77. Spatial Globals Cross Trading Service Product
Table 78. Spatial Globals Revenue in Cross Trading Service Business (US$ Million), 2021–2026
Table 79. Spatial Globals Recent Development
Table 80. Ital Logistics Company Details
Table 81. Ital Logistics Business Overview
Table 82. Ital Logistics Cross Trading Service Product
Table 83. Ital Logistics Revenue in Cross Trading Service Business (US$ Million), 2021–2026
Table 84. Ital Logistics Recent Development
Table 85. Wallis Shipping Company Details
Table 86. Wallis Shipping Business Overview
Table 87. Wallis Shipping Cross Trading Service Product
Table 88. Wallis Shipping Revenue in Cross Trading Service Business (US$ Million), 2021–2026
Table 89. Wallis Shipping Recent Development
Table 90. Elite Logistics Company Details
Table 91. Elite Logistics Business Overview
Table 92. Elite Logistics Cross Trading Service Product
Table 93. Elite Logistics Revenue in Cross Trading Service Business (US$ Million), 2021–2026
Table 94. Elite Logistics Recent Development
Table 95. Cosco Carriers Company Details
Table 96. Cosco Carriers Business Overview
Table 97. Cosco Carriers Cross Trading Service Product
Table 98. Cosco Carriers Revenue in Cross Trading Service Business (US$ Million), 2021–2026
Table 99. Cosco Carriers Recent Development
Table 100. Cargo Movers Company Details
Table 101. Cargo Movers Business Overview
Table 102. Cargo Movers Cross Trading Service Product
Table 103. Cargo Movers Revenue in Cross Trading Service Business (US$ Million), 2021–2026
Table 104. Cargo Movers Recent Development
Table 105. Euro-Rijn Company Details
Table 106. Euro-Rijn Business Overview
Table 107. Euro-Rijn Cross Trading Service Product
Table 108. Euro-Rijn Revenue in Cross Trading Service Business (US$ Million), 2021–2026
Table 109. Euro-Rijn Recent Development
Table 110. ATC Cargo Company Details
Table 111. ATC Cargo Business Overview
Table 112. ATC Cargo Cross Trading Service Product
Table 113. ATC Cargo Revenue in Cross Trading Service Business (US$ Million), 2021–2026
Table 114. ATC Cargo Recent Development
Table 115. JWS Shipping Company Details
Table 116. JWS Shipping Business Overview
Table 117. JWS Shipping Cross Trading Service Product
Table 118. JWS Shipping Revenue in Cross Trading Service Business (US$ Million), 2021–2026
Table 119. JWS Shipping Recent Development
Table 120. ANC Shipping Company Details
Table 121. ANC Shipping Business Overview
Table 122. ANC Shipping Cross Trading Service Product
Table 123. ANC Shipping Revenue in Cross Trading Service Business (US$ Million), 2021–2026
Table 124. ANC Shipping Recent Development
Table 125. MED Lloyd Lines Company Details
Table 126. MED Lloyd Lines Business Overview
Table 127. MED Lloyd Lines Cross Trading Service Product
Table 128. MED Lloyd Lines Revenue in Cross Trading Service Business (US$ Million), 2021–2026
Table 129. MED Lloyd Lines Recent Development
Table 130. ILS Company Details
Table 131. ILS Business Overview
Table 132. ILS Cross Trading Service Product
Table 133. ILS Revenue in Cross Trading Service Business (US$ Million), 2021–2026
Table 134. ILS Recent Development
Table 135. Carry Cargo Company Details
Table 136. Carry Cargo Business Overview
Table 137. Carry Cargo Cross Trading Service Product
Table 138. Carry Cargo Revenue in Cross Trading Service Business (US$ Million), 2021–2026
Table 139. Carry Cargo Recent Development
Table 140. Everfast Freight Company Details
Table 141. Everfast Freight Business Overview
Table 142. Everfast Freight Cross Trading Service Product
Table 143. Everfast Freight Revenue in Cross Trading Service Business (US$ Million), 2021–2026
Table 144. Everfast Freight Recent Development
Table 145. PTBOS Company Details
Table 146. PTBOS Business Overview
Table 147. PTBOS Cross Trading Service Product
Table 148. PTBOS Revenue in Cross Trading Service Business (US$ Million), 2021–2026
Table 149. PTBOS Recent Development
Table 150. Gemini Freight Company Details
Table 151. Gemini Freight Business Overview
Table 152. Gemini Freight Cross Trading Service Product
Table 153. Gemini Freight Revenue in Cross Trading Service Business (US$ Million), 2021–2026
Table 154. Gemini Freight Recent Development
Table 155. IMS Company Details
Table 156. IMS Business Overview
Table 157. IMS Cross Trading Service Product
Table 158. IMS Revenue in Cross Trading Service Business (US$ Million), 2021–2026
Table 159. IMS Recent Development
Table 160. SeaRates Company Details
Table 161. SeaRates Business Overview
Table 162. SeaRates Cross Trading Service Product
Table 163. SeaRates Revenue in Cross Trading Service Business (US$ Million), 2021–2026
Table 164. SeaRates Recent Development
Table 165. Trust Forwarding Company Details
Table 166. Trust Forwarding Business Overview
Table 167. Trust Forwarding Cross Trading Service Product
Table 168. Trust Forwarding Revenue in Cross Trading Service Business (US$ Million), 2021–2026
Table 169. Trust Forwarding Recent Development
Table 170. CrossTrade Shipping Company Details
Table 171. CrossTrade Shipping Business Overview
Table 172. CrossTrade Shipping Cross Trading Service Product
Table 173. CrossTrade Shipping Revenue in Cross Trading Service Business (US$ Million), 2021–2026
Table 174. CrossTrade Shipping Recent Development
Table 175. IFE Global Digital Logistics Company Details
Table 176. IFE Global Digital Logistics Business Overview
Table 177. IFE Global Digital Logistics Cross Trading Service Product
Table 178. IFE Global Digital Logistics Revenue in Cross Trading Service Business (US$ Million), 2021–2026
Table 179. IFE Global Digital Logistics Recent Development
Table 180. Radius Company Details
Table 181. Radius Business Overview
Table 182. Radius Cross Trading Service Product
Table 183. Radius Revenue in Cross Trading Service Business (US$ Million), 2021–2026
Table 184. Radius Recent Development
Table 185. Airsupply Shipping Company Details
Table 186. Airsupply Shipping Business Overview
Table 187. Airsupply Shipping Cross Trading Service Product
Table 188. Airsupply Shipping Revenue in Cross Trading Service Business (US$ Million), 2021–2026
Table 189. Airsupply Shipping Recent Development
Table 190. JAG UFS Company Details
Table 191. JAG UFS Business Overview
Table 192. JAG UFS Cross Trading Service Product
Table 193. JAG UFS Revenue in Cross Trading Service Business (US$ Million), 2021–2026
Table 194. JAG UFS Recent Development
Table 195. Alpha Associates Company Details
Table 196. Alpha Associates Business Overview
Table 197. Alpha Associates Cross Trading Service Product
Table 198. Alpha Associates Revenue in Cross Trading Service Business (US$ Million), 2021–2026
Table 199. Alpha Associates Recent Development
Table 200. Alpha Star Company Details
Table 201. Alpha Star Business Overview
Table 202. Alpha Star Cross Trading Service Product
Table 203. Alpha Star Revenue in Cross Trading Service Business (US$ Million), 2021–2026
Table 204. Alpha Star Recent Development
Table 205. Estelle Shipping Company Details
Table 206. Estelle Shipping Business Overview
Table 207. Estelle Shipping Cross Trading Service Product
Table 208. Estelle Shipping Revenue in Cross Trading Service Business (US$ Million), 2021–2026
Table 209. Estelle Shipping Recent Development
Table 210. RJJ Freight Company Details
Table 211. RJJ Freight Business Overview
Table 212. RJJ Freight Cross Trading Service Product
Table 213. RJJ Freight Revenue in Cross Trading Service Business (US$ Million), 2021–2026
Table 214. RJJ Freight Recent Development
Table 215. OceanBlue Logistics Company Details
Table 216. OceanBlue Logistics Business Overview
Table 217. OceanBlue Logistics Cross Trading Service Product
Table 218. OceanBlue Logistics Revenue in Cross Trading Service Business (US$ Million), 2021–2026
Table 219. OceanBlue Logistics Recent Development
Table 220. Research Programs/Design for This Report
Table 221. Key Data Information from Secondary Sources
Table 222. Key Data Information from Primary Sources
Table 223. Authors List of This Report
List of Figures
Figure 1. Cross Trading Service Picture
Figure 2. Global Cross Trading Service Market Size Comparison by Type (US$ Million), 2021–2032
Figure 3. Global Cross Trading Service Market Share by Type: 2025 vs 2032
Figure 4. Sea Freight Features
Figure 5. Air Freight Features
Figure 6. Land Freight Features
Figure 7. Others Features
Figure 8. Global Cross Trading Service Market Size Comparison by Service Component (US$ Million), 2021–2032
Figure 9. Trade Execution Features
Figure 10. Trade Finance Features
Figure 11. Logistics Orchestration Features
Figure 12. Compliance & Regulatory Features
Figure 13. Settlement & Accounting Features
Figure 14. Global Cross Trading Service Market Size Comparison by Transaction Structure (US$ Million), 2021–2032
Figure 15. Triangular Trade Features
Figure 16. Back-to-Back Features
Figure 17. Merchant Trading Features
Figure 18. Agency/Commission Features
Figure 19. Transit/Entrepôt Features
Figure 20. Global Cross Trading Service Market Size by Application (US$ Million), 2021–2032
Figure 21. Global Cross Trading Service Market Share by Application: 2025 vs 2032
Figure 22. Food Industry Case Studies
Figure 23. Medical Industry Case Studies
Figure 24. Chemical Industry Case Studies
Figure 25. Automobile Industry Case Studies
Figure 26. Others Case Studies
Figure 27. Cross Trading Service Report Years Considered
Figure 28. Global Cross Trading Service Market Size (US$ Million), Year-over-Year: 2021–2032
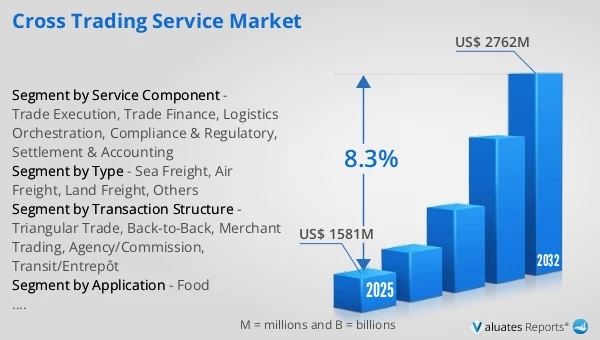
Figure 29. Global Cross Trading Service Market Size, (US$ Million), 2021 vs 2025 vs 2032
Figure 30. Global Cross Trading Service Market Share by Region: 2025 vs 2032
Figure 31. Global Cross Trading Service Market Share by Players in 2025
Figure 32. Global Cross Trading Service Market Share by Company Type (Tier 1, Tier 2, and Tier 3)
Figure 33. The Top 10 and 5 Players Market Share by Cross Trading Service Revenue in 2025
Figure 34. North America Cross Trading Service Market Size YoY Growth (US$ Million), 2021–2032
Figure 35. North America Cross Trading Service Market Share by Country (2021–2032)
Figure 36. United States Cross Trading Service Market Size YoY Growth (US$ Million), 2021–2032
Figure 37. Canada Cross Trading Service Market Size YoY Growth (US$ Million), 2021–2032
Figure 38. Europe Cross Trading Service Market Size YoY Growth (US$ Million), 2021–2032
Figure 39. Europe Cross Trading Service Market Share by Country (2021–2032)
Figure 40. Germany Cross Trading Service Market Size YoY Growth (US$ Million), 2021–2032
Figure 41. France Cross Trading Service Market Size YoY Growth (US$ Million), 2021–2032
Figure 42. U.K. Cross Trading Service Market Size YoY Growth (US$ Million), 2021–2032
Figure 43. Italy Cross Trading Service Market Size YoY Growth (US$ Million), 2021–2032
Figure 44. Russia Cross Trading Service Market Size YoY Growth (US$ Million), 2021–2032
Figure 45. Ireland Cross Trading Service Market Size YoY Growth (US$ Million), 2021–2032
Figure 46. Asia-Pacific Cross Trading Service Market Size YoY Growth (US$ Million), 2021–2032
Figure 47. Asia-Pacific Cross Trading Service Market Share by Region (2021–2032)
Figure 48. China Cross Trading Service Market Size YoY Growth (US$ Million), 2021–2032
Figure 49. Japan Cross Trading Service Market Size YoY Growth (US$ Million), 2021–2032
Figure 50. South Korea Cross Trading Service Market Size YoY Growth (US$ Million), 2021–2032
Figure 51. Southeast Asia Cross Trading Service Market Size YoY Growth (US$ Million), 2021–2032
Figure 52. India Cross Trading Service Market Size YoY Growth (US$ Million), 2021–2032
Figure 53. Australia & New Zealand Cross Trading Service Market Size YoY Growth (US$ Million), 2021–2032
Figure 54. Latin America Cross Trading Service Market Size YoY Growth (US$ Million), 2021–2032
Figure 55. Latin America Cross Trading Service Market Share by Country (2021–2032)
Figure 56. Mexico Cross Trading Service Market Size YoY Growth (US$ Million), 2021–2032
Figure 57. Brazil Cross Trading Service Market Size YoY Growth (US$ Million), 2021–2032
Figure 58. Middle East & Africa Cross Trading Service Market Size YoY Growth (US$ Million), 2021–2032
Figure 59. Middle East & Africa Cross Trading Service Market Share by Country (2021–2032)
Figure 60. Israel Cross Trading Service Market Size YoY Growth (US$ Million), 2021–2032
Figure 61. Saudi Arabia Cross Trading Service Market Size YoY Growth (US$ Million), 2021–2032
Figure 62. UAE Cross Trading Service Market Size YoY Growth (US$ Million), 2021–2032
Figure 63. Alliance Revenue Growth Rate in Cross Trading Service Business (2021–2026)
Figure 64. Global Freight Revenue Growth Rate in Cross Trading Service Business (2021–2026)
Figure 65. ICE Cargo Revenue Growth Rate in Cross Trading Service Business (2021–2026)
Figure 66. Spatial Globals Revenue Growth Rate in Cross Trading Service Business (2021–2026)
Figure 67. Ital Logistics Revenue Growth Rate in Cross Trading Service Business (2021–2026)
Figure 68. Wallis Shipping Revenue Growth Rate in Cross Trading Service Business (2021–2026)
Figure 69. Elite Logistics Revenue Growth Rate in Cross Trading Service Business (2021–2026)
Figure 70. Cosco Carriers Revenue Growth Rate in Cross Trading Service Business (2021–2026)
Figure 71. Cargo Movers Revenue Growth Rate in Cross Trading Service Business (2021–2026)
Figure 72. Euro-Rijn Revenue Growth Rate in Cross Trading Service Business (2021–2026)
Figure 73. ATC Cargo Revenue Growth Rate in Cross Trading Service Business (2021–2026)
Figure 74. JWS Shipping Revenue Growth Rate in Cross Trading Service Business (2021–2026)
Figure 75. ANC Shipping Revenue Growth Rate in Cross Trading Service Business (2021–2026)
Figure 76. MED Lloyd Lines Revenue Growth Rate in Cross Trading Service Business (2021–2026)
Figure 77. ILS Revenue Growth Rate in Cross Trading Service Business (2021–2026)
Figure 78. Carry Cargo Revenue Growth Rate in Cross Trading Service Business (2021–2026)
Figure 79. Everfast Freight Revenue Growth Rate in Cross Trading Service Business (2021–2026)
Figure 80. PTBOS Revenue Growth Rate in Cross Trading Service Business (2021–2026)
Figure 81. Gemini Freight Revenue Growth Rate in Cross Trading Service Business (2021–2026)
Figure 82. IMS Revenue Growth Rate in Cross Trading Service Business (2021–2026)
Figure 83. SeaRates Revenue Growth Rate in Cross Trading Service Business (2021–2026)
Figure 84. Trust Forwarding Revenue Growth Rate in Cross Trading Service Business (2021–2026)
Figure 85. CrossTrade Shipping Revenue Growth Rate in Cross Trading Service Business (2021–2026)
Figure 86. IFE Global Digital Logistics Revenue Growth Rate in Cross Trading Service Business (2021–2026)
Figure 87. Radius Revenue Growth Rate in Cross Trading Service Business (2021–2026)
Figure 88. Airsupply Shipping Revenue Growth Rate in Cross Trading Service Business (2021–2026)
Figure 89. JAG UFS Revenue Growth Rate in Cross Trading Service Business (2021–2026)
Figure 90. Alpha Associates Revenue Growth Rate in Cross Trading Service Business (2021–2026)
Figure 91. Alpha Star Revenue Growth Rate in Cross Trading Service Business (2021–2026)
Figure 92. Estelle Shipping Revenue Growth Rate in Cross Trading Service Business (2021–2026)
Figure 93. RJJ Freight Revenue Growth Rate in Cross Trading Service Business (2021–2026)
Figure 94. OceanBlue Logistics Revenue Growth Rate in Cross Trading Service Business (2021–2026)
Figure 95. Bottom-up and Top-down Approaches for This Report
Figure 96. Data Triangulation
Figure 97. Key Executives Interviewed