0
U.S. (TOLL FREE)
+1 (315) 215-3225
Automative

0
U.S. (TOLL FREE)
+1 (315) 215-3225
Global and India Ostomy Market Report & Forecast 2023-2029
Published Date: November 2023
|
Report Code: QYRE-Auto-10Q15950
Home | Market Reports | Health| Medical Facilities & Services| Medical Procedures
Global and India Ostomy Market Report Forecast 2023 2029
BUY CHAPTERS

Global and India Ostomy Market Report & Forecast 2023-2029

Code: QYRE-Auto-10Q15950
Report
November 2023
Pages:72
QYResearch
Buy Now with 15% Discount
DESCRIPTION
TABLE OF CONTENT
TABLES & FIGURES

and India Ostomy Market Size

The global Ostomy revenue was US$ 3370 million in 2022 and is forecast to a readjusted size of US$ 4602.9 million by 2029 with a CAGR of 4.5% during the review period (2023-2029).

and India Ostomy Market

and India Ostomy Market

An ostomy is a surgical procedure undertaken to create an opening or stoma on the abdominal wall for waste products to move out of the body. It is useful in case of certain diseases of the digestive and urinary system. Ostomy can either be temporary or permanent depending on the purpose for which it is undertaken. A temporary ostomy gives an organ time to heal while a permanent ostomy acts as a mode of waste excretion for life. Depending on the area that is operated upon, ostomy can be classified into three types namely colostomy, ileostomy and urostomy.
In India, the Ostomy revenue is expected to grow from US$ million in 2022 to US$ million by 2029, at a CAGR of % during the forecast period 2023-2029.
Global Ostomy key players include Coloplast, Hollister, ConvaTec, etc. Global top three manufacturers hold a share about 75%.
Europe is the largest market, with a share about 40%, followed by North America and Emerging Economies, both have a share about 60 percent.
In terms of product, Colostomy is the largest segment, with a share about 65%. And in terms of application, the largest application is Pouches, followed by Accessories.
This report focuses on global and India Ostomy market, also covers the segmentation data of other regions in regional level and county level.
India is now the world’s most populous country. According to IMF (its July update to its World Economic Outlook), India’s GDP growth is projected at 6.1% in 2023, powered by domestic investment. First and foremost, the key factor in India's rapid economic growth is the huge supply and demand from a large population base. Demand and supply sides working in both directions to support India's economic stability.
India is a market full of opportunities, and the demand for Ostomy will continue to grow rapidly in the future.
Global Ostomy Scope and Market Size
Ostomy market is segmented in regional and country level, by players, by Type and by Application. Companies, stakeholders, and other participants in the global Ostomy market will be able to gain the upper hand as they use the report as a powerful resource. The segmental analysis focuses on revenue and forecast by Type and by Application for the period 2018-2029.
For India market, this report focuses on the Ostomy market size by players, by Type and by Application, for the period 2018-2029. The key players include the global and local players, which play important roles in India.

Scope of and India Ostomy Market Report

Report Metric Details
Report Name and India Ostomy Market
Forecasted market size in 2029 US$ 4602.9 million
CAGR 4.5%
Forecasted years 2023 - 2029
Segment by Type
  • Colostomy
  • Ileostomy
  • Urostomy
Segment by Application
  • Pouches
  • Accessories
By Region
  • North America (United States, Canada)
  • Europe (Germany, France, UK, Italy, Russia) Rest of Europe
  • Nordic Countries
  • Asia-Pacific (China, Japan, South Korea)
  • Southeast Asia (India, Australia)
  • Rest of Asia
  • Latin America (Mexico, Brazil)
  • Rest of Latin America
  • Middle East & Africa (Turkey, Saudi Arabia, UAE, Rest of MEA)
By Company Coloplast, Hollister, ConvaTec, B. Braun
Forecast units USD million in value
Report coverage Revenue and volume forecast, company share, competitive landscape, growth factors and trends

FAQ for this report

What is the and India Ostomy Market size in 2029?

Ans: The and India Ostomy Market size in 2029 will be US$ 4602.9 million.

What is the market share of major companies in and India Ostomy Market?

Ans: Global top three manufacturers hold a share about 75%.

What is the and India Ostomy Market share by type?

Ans: In terms of product, Colostomy is the largest segment, with a share about 65%.

What is the and India Ostomy Market share by region?

Ans: According to IMF (its July update to its World Economic Outlook), India’s GDP growth is projected at 6.1% in 2023, powered by domestic investment.

Who are the main players in the and India Ostomy Market report?

Ans: The main players in the and India Ostomy Market are Coloplast, Hollister, ConvaTec, B. Braun

What are the Application segmentation covered in the and India Ostomy Market report?

Ans: The Applications covered in the and India Ostomy Market report are Pouches, Accessories

What are the Type segmentation covered in the and India Ostomy Market report?

Ans: The Types covered in the and India Ostomy Market report are Colostomy, Ileostomy, Urostomy

1 Study Coverage
1.1 Ostomy Product Introduction
1.2 Global Ostomy Outlook 2018 VS 2022 VS 2029
1.2.1 Global Ostomy Market Size for the Year 2018-2029
1.2.2 India Ostomy Market Size for the Year 2018-2029
1.3 Ostomy Market Size, India VS Global, 2018 VS 2022 VS 2029
1.3.1 The Market Share of India Ostomy in Global, 2018 VS 2022 VS 2029
1.3.2 The Growth Rate of Ostomy Market Size, India VS Global, 2018 VS 2022 VS 2029
1.4 Ostomy Market Dynamics
1.4.1 Ostomy Industry Trends
1.4.2 Ostomy Market Drivers
1.4.3 Ostomy Market Challenges
1.4.4 Ostomy Market Restraints
1.5 Assumptions and Limitations
1.6 Study Objectives
1.7 Years Considered
2 Ostomy by Type
2.1 Ostomy Market Segment by Type
2.1.1 Colostomy
2.1.2 Ileostomy
2.1.3 Urostomy
2.2 Global Ostomy Market Size by Type (2018, 2022 & 2029)
2.3 Global Ostomy Market Size by Type (2018-2029)
2.4 India Ostomy Market Size by Type (2018, 2022 & 2029)
2.5 India Ostomy Market Size by Type (2018-2029)
3 Ostomy by Application
3.1 Ostomy Market Segment by Application
3.1.1 Pouches
3.1.2 Accessories
3.2 Global Ostomy Market Size by Application (2018, 2022 & 2029)
3.3 Global Ostomy Market Size by Application (2018-2029)
3.4 India Ostomy Market Size by Application (2018, 2022 & 2029)
3.5 India Ostomy Market Size by Application (2018-2029)
4 Global Ostomy Competitor Landscape by Company
4.1 Global Ostomy Market Size by Company
4.1.1 Global Key Companies of Ostomy, Ranked by Revenue (2022)
4.1.2 Global Ostomy Revenue by Player (2018-2023)
4.2 Global Ostomy Concentration Ratio (CR)
4.2.1 Ostomy Market Concentration Ratio (CR) (2018-2023)
4.2.2 Global Top 5 and Top 10 Largest Companies of Ostomy in 2022
4.2.3 Global Ostomy Market Share by Company Type (Tier 1, Tier 2, and Tier 3)
4.3 Global Key Players of Ostomy Head office and Area Served
4.4 Global Key Players of Ostomy, Product and Application
4.5 Global Key Players of Ostomy, Date of Enter into This Industry
4.6 Companies Mergers & Acquisitions, Expansion Plans
4.7 India Ostomy Market Size by Company
4.7.1 Key Players of Ostomy in India, Ranked by Revenue (2022)
4.7.2 India Ostomy Revenue by Players (2021, 2022 & 2023)
5 Global Ostomy Market Size by Region
5.1 Global Ostomy Market Size by Region: 2018 VS 2022 VS 2029
5.2 Global Ostomy Market Size by Region (2018-2029)
5.2.1 Global Ostomy Market Size by Region: 2018-2023
5.2.2 Global Ostomy Market Size by Region (2024-2029)
6 Americas
6.1 Americas Ostomy Market Size YoY Growth 2018-2029
6.2 Americas Ostomy Market Size by Type
6.2.1 Americas Ostomy Market Size by Type (2018-2023)
6.2.2 Americas Ostomy Market Size by Type (2024-2029)
6.2.3 Americas Ostomy Market Share by Type (2018-2029)
6.3 Americas Ostomy Market Size by Application
6.3.1 Americas Ostomy Market Size by Application (2018-2023)
6.3.2 Americas Ostomy Market Size by Application (2024-2029)
6.3.3 Americas Ostomy Market Share by Application (2018-2029)
6.4 Americas Ostomy Market Facts & Figures by Country (2018, 2022 & 2029)
6.4.1 United States
6.4.2 Canada
6.4.3 Mexico
6.4.4 Brazil
7 EMEA
7.1 EMEA Ostomy Market Size YoY Growth 2018-2029
7.2 EMEA Ostomy Market Size by Type
7.2.1 EMEA Ostomy Market Size by Type (2018-2023)
7.2.2 EMEA Ostomy Market Size by Type (2024-2029)
7.2.3 EMEA Ostomy Market Share by Type (2018-2029)
7.3 EMEA Ostomy Market Size by Application
7.3.1 EMEA Ostomy Market Size by Application (2018-2023)
7.3.2 EMEA Ostomy Market Size by Application (2024-2029)
7.3.3 EMEA Ostomy Market Share by Application (2018-2029)
7.4 EMEA Ostomy Market Facts & Figures by Country (2018, 2022 & 2029)
7.4.1 Europe
7.4.2 Middle East
7.4.3 Africa
8 China
8.1 China Ostomy Market Size YoY Growth 2018-2029
8.2 China Ostomy Market Size by Type
8.2.1 China Ostomy Market Size by Type (2018-2023)
8.2.2 China Ostomy Market Size by Type (2024-2029)
8.2.3 China Ostomy Market Share by Type (2018-2029)
8.3 China Ostomy Market Size by Application
8.3.1 China Ostomy Market Size by Application (2018-2023)
8.3.2 China Ostomy Market Size by Application (2024-2029)
8.3.3 China Ostomy Market Share by Application (2018-2029)
9 APAC (excluding China)
9.1 APAC Ostomy Market Size YoY Growth 2018-2029
9.2 APAC Ostomy Market Size by Type
9.2.1 APAC Ostomy Market Size by Type (2018-2023)
9.2.2 APAC Ostomy Market Size by Type (2024-2029)
9.2.3 APAC Ostomy Market Share by Type (2018-2029)
9.3 APAC Ostomy Market Size by Application
9.3.1 APAC Ostomy Market Size by Application (2018-2023)
9.3.2 APAC Ostomy Market Size by Application (2024-2029)
9.3.3 APAC Ostomy Market Share by Application (2018-2029)
9.4 APAC Ostomy Market Facts & Figures by Country (2018, 2022 & 2029)
9.4.1 Japan
9.4.2 South Korea
9.4.3 China Taiwan
9.4.4 Southeast Asia
9.4.5 India
10 Key Players Profiles
10.1 Coloplast
10.1.1 Coloplast Company Details
10.1.2 Coloplast Business Overview
10.1.3 Coloplast Ostomy Introduction
10.1.4 Coloplast Revenue in Ostomy Business (2018-2023)
10.1.5 Coloplast Recent Development
10.2 Hollister
10.2.1 Hollister Company Details
10.2.2 Hollister Business Overview
10.2.3 Hollister Ostomy Introduction
10.2.4 Hollister Revenue in Ostomy Business (2018-2023)
10.2.5 Hollister Recent Development
10.3 ConvaTec
10.3.1 ConvaTec Company Details
10.3.2 ConvaTec Business Overview
10.3.3 ConvaTec Ostomy Introduction
10.3.4 ConvaTec Revenue in Ostomy Business (2018-2023)
10.3.5 ConvaTec Recent Development
10.4 B. Braun
10.4.1 B. Braun Company Details
10.4.2 B. Braun Business Overview
10.4.3 B. Braun Ostomy Introduction
10.4.4 B. Braun Revenue in Ostomy Business (2018-2023)
10.4.5 B. Braun Recent Development
11 Research Findings and Conclusion
12 Appendix
12.1 Research Methodology
12.1.1 Methodology/Research Approach
12.1.2 Data Source
12.2 Disclaimer
12.3 Author Details
List of Tables
    Table 1. Ostomy Market Size India VS Global, CAGR (2018 VS 2022 VS 2029)
    Table 2. Ostomy Market Trends
    Table 3. Ostomy Market Drivers
    Table 4. Ostomy Market Challenges
    Table 5. Ostomy Market Restraints
    Table 6. Global Ostomy Market Size by Type: 2018 VS 2022 VS 2029 (US$ Million)
    Table 7. India Ostomy Market Size by Type: 2018 VS 2022 VS 2029 (US$ Million)
    Table 8. Global Ostomy Market Size by Application: 2018 VS 2022 VS 2029 (US$ Million)
    Table 9. India Ostomy Market Size by Application: 2018 VS 2022 VS 2029 (US$ Million)
    Table 10. Global Key Companies of Ostomy, Ranked by Revenue (2022) & (US$ Million)
    Table 11. Global Ostomy Revenue by Player, (US$ Million), 2018-2023
    Table 12. Global Ostomy Revenue Share by Player, 2018-2023
    Table 13. Global Ostomy Companies Market Concentration Ratio (CR5 and HHI)
    Table 14. Global Ostomy by Company Type (Tier 1, Tier 2, and Tier 3) & (based on the Revenue in Ostomy as of 2022)
    Table 15. Global Key Players of Ostomy, Headquarters and Area Served
    Table 16. Global Key Players of Ostomy, Product and Application
    Table 17. Global Key Players of Ostomy, Date of Enter into This Industry
    Table 18. Companies Mergers & Acquisitions, Expansion Plans
    Table 19. Key Players of Ostomy in India, Ranked by Revenue (2022) & (US$ Million)
    Table 20. India Ostomy Revenue by Players, (US$ Million), 2021, 2022 & 2023
    Table 21. India Ostomy Revenue Share by Players, 2021, 2022 & 2023
    Table 22. Global Ostomy Market Size Growth Rate (CAGR) by Region (US$ Million): 2018 VS 2022 VS 2029
    Table 23. Global Ostomy Market Size by Region (2018-2023) & (US$ Million)
    Table 24. Global Ostomy Market Size Forecast by Region (2024-2029) & (US$ Million)
    Table 25. Americas Ostomy Market Size by Type (2018-2023) & (US$ Million)
    Table 26. Americas Ostomy Market Size by Type (2024-2029) & (US$ Million)
    Table 27. Americas Ostomy Market Size by Application (2018-2023) & (US$ Million)
    Table 28. Americas Ostomy Market Size by Application (2024-2029) & (US$ Million)
    Table 29. Americas Ostomy Market Size Growth Rate (CAGR) by Country (US$ Million): 2018 VS 2022 VS 2029
    Table 30. Americas Ostomy Market Size by Country (2018-2023) & (US$ Million)
    Table 31. Americas Ostomy Market Size by Country (2024-2029) & (US$ Million)
    Table 32. EMEA Ostomy Market Size by Type (2018-2023) & (US$ Million)
    Table 33. EMEA Ostomy Market Size by Type (2024-2029) & (US$ Million)
    Table 34. EMEA Ostomy Market Size by Application (2018-2023) & (US$ Million)
    Table 35. EMEA Ostomy Market Size by Application (2024-2029) & (US$ Million)
    Table 36. EMEA Ostomy Market Size Growth Rate (CAGR) by Country (US$ Million): 2018 VS 2022 VS 2029
    Table 37. EMEA Ostomy Market Size by Country (2018-2023) & (US$ Million)
    Table 38. EMEA Ostomy Market Size by Country (2024-2029) & (US$ Million)
    Table 39. China Ostomy Market Size by Type (2018-2023) & (US$ Million)
    Table 40. China Ostomy Market Size by Type (2024-2029) & (US$ Million)
    Table 41. China Ostomy Market Size by Application (2018-2023) & (US$ Million)
    Table 42. China Ostomy Market Size by Application (2024-2029) & (US$ Million)
    Table 43. China Ostomy Market Size Growth Rate (CAGR) by Country (US$ Million): 2018 VS 2022 VS 2029
    Table 44. APAC Ostomy Market Size by Type (2018-2023) & (US$ Million)
    Table 45. APAC Ostomy Market Size by Type (2024-2029) & (US$ Million)
    Table 46. APAC Ostomy Market Size by Application (2018-2023) & (US$ Million)
    Table 47. APAC Ostomy Market Size by Application (2024-2029) & (US$ Million)
    Table 48. APAC Ostomy Market Size Growth Rate (CAGR) by Country (US$ Million): 2018 VS 2022 VS 2029
    Table 49. APAC Ostomy Market Size by Region (2018-2023) & (US$ Million)
    Table 50. APAC Ostomy Market Size by Region (2024-2029) & (US$ Million)
    Table 51. Coloplast Company Details
    Table 52. Coloplast Business Overview
    Table 53. Coloplast Ostomy Product
    Table 54. Coloplast Revenue in Ostomy Business (2018-2023) & (US$ Million)
    Table 55. Coloplast Recent Development
    Table 56. Hollister Company Details
    Table 57. Hollister Business Overview
    Table 58. Hollister Ostomy Product
    Table 59. Hollister Revenue in Ostomy Business (2018-2023) & (US$ Million)
    Table 60. Hollister Recent Development
    Table 61. ConvaTec Company Details
    Table 62. ConvaTec Business Overview
    Table 63. ConvaTec Ostomy Product
    Table 64. ConvaTec Revenue in Ostomy Business (2018-2023) & (US$ Million)
    Table 65. ConvaTec Recent Development
    Table 66. B. Braun Company Details
    Table 67. B. Braun Business Overview
    Table 68. B. Braun Ostomy Product
    Table 69. B. Braun Revenue in Ostomy Business (2018-2023) & (US$ Million)
    Table 70. B. Braun Recent Development
    Table 71. Research Programs/Design for This Report
    Table 72. Key Data Information from Secondary Sources
    Table 73. Key Data Information from Primary Sources
List of Figures
    Figure 1. Ostomy Product Picture
    Figure 2. Global Ostomy Market Size, (US$ Million), 2018 VS 2022 VS 2029
    Figure 3. Global Ostomy Market Size 2018-2029 (US$ Million)
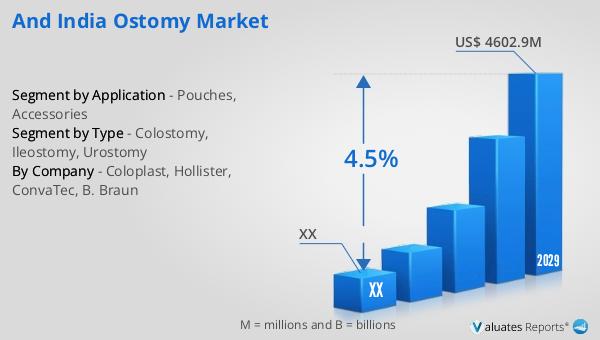
    Figure 4. India Ostomy Market Size, (US$ Million), 2018 VS 2022 VS 2029
    Figure 5. India Ostomy Market Size 2018-2029 (US$ Million)
    Figure 6. India Ostomy Market Share in Global 2018-2029
    Figure 7. Ostomy Report Years Considered
    Figure 8. Product Picture of Colostomy
    Figure 9. Product Picture of Ileostomy
    Figure 10. Product Picture of Urostomy
    Figure 11. Global Ostomy Market Share by Type in 2022 & 2029
    Figure 12. Global Ostomy Market Size by Type (2018-2029) & (US$ Million)
    Figure 13. Global Ostomy Market Share by Type (2018-2029)
    Figure 14. India Ostomy Market Share by Type in 2022 & 2029
    Figure 15. India Ostomy Market Size by Type (2018-2029) & (US$ Million)
    Figure 16. India Ostomy Market Share by Type (2018-2029)
    Figure 17. Product Picture of Pouches
    Figure 18. Product Picture of Accessories
    Figure 19. Global Ostomy Market Share by Application in 2022 & 2029
    Figure 20. Global Ostomy Market Size by Application (2018-2029) & (US$ Million)
    Figure 21. Global Ostomy Market Share by Application (2018-2029)
    Figure 22. India Ostomy Market Share by Application in 2022 & 2029
    Figure 23. India Ostomy Market Size by Application (2018-2029) & (US$ Million)
    Figure 24. India Ostomy Market Share by Application (2018-2029)
    Figure 25. The Top 5 and 10 Largest Companies of Ostomy in the World: Market Share by Ostomy Revenue in 2022
    Figure 26. Global Ostomy Market Size Market Share by Region: 2018 VS 2022 VS 2029
    Figure 27. Global Ostomy Market Share by Region (2018-2029)
    Figure 28. Americas Ostomy Market Size Growth Rate 2018-2029 (US$ Million)
    Figure 29. Americas Ostomy Market Share by Type (2018-2029)
    Figure 30. Americas Ostomy Market Share by Application (2018-2029)
    Figure 31. United States Ostomy Market Size Growth Rate (2018-2029) & (US$ Million)
    Figure 32. Canada Ostomy Market Size Growth Rate (2018-2029) & (US$ Million)
    Figure 33. Mexico Ostomy Market Size Growth Rate (2018-2029) & (US$ Million)
    Figure 34. Brazil Ostomy Market Size Growth Rate (2018-2029) & (US$ Million)
    Figure 35. EMEA Ostomy Market Size Growth Rate 2018-2029 (US$ Million)
    Figure 36. EMEA Ostomy Market Share by Type (2018-2029)
    Figure 37. EMEA Ostomy Market Share by Application (2018-2029)
    Figure 38. Europe Ostomy Market Size Growth Rate (2018-2029) & (US$ Million)
    Figure 39. Middle East Ostomy Market Size Growth Rate (2018-2029) & (US$ Million)
    Figure 40. Africa Ostomy Market Size Growth Rate (2018-2029) & (US$ Million)
    Figure 41. China Ostomy Market Size Growth Rate 2018-2029 (US$ Million)
    Figure 42. China Ostomy Market Share by Type (2018-2029)
    Figure 43. China Ostomy Market Share by Application (2018-2029)
    Figure 44. APAC Ostomy Market Size Growth Rate 2018-2029 (US$ Million)
    Figure 45. APAC Ostomy Market Share by Type (2018-2029)
    Figure 46. APAC Ostomy Market Share by Application (2018-2029)
    Figure 47. Japan Ostomy Market Size Growth Rate (2018-2029) & (US$ Million)
    Figure 48. South Korea Ostomy Market Size Growth Rate (2018-2029) & (US$ Million)
    Figure 49. China Taiwan Ostomy Market Size Growth Rate (2018-2029) & (US$ Million)
    Figure 50. Southeast Asia Ostomy Market Size Growth Rate (2018-2029) & (US$ Million)
    Figure 51. India Ostomy Market Size Growth Rate (2018-2029) & (US$ Million)
    Figure 52. Coloplast Revenue Growth Rate in Ostomy Business (2018-2023)
    Figure 53. Hollister Revenue Growth Rate in Ostomy Business (2018-2023)
    Figure 54. ConvaTec Revenue Growth Rate in Ostomy Business (2018-2023)
    Figure 55. B. Braun Revenue Growth Rate in Ostomy Business (2018-2023)
    Figure 56. Bottom-up and Top-down Approaches for This Report
    Figure 57. Data Triangulation
    Figure 58. Key Executives Interviewed
SELECT A FORMAT
Added to Cart
Electronic (PDF)

$4350

This license allows only one user to access the PDF.
Electronic (PDF)

$6525

This license allows 1 - 5 user to access the PDF, license is suitable for small groups of 5 users working together
Electronic (PDF)

$8700

This license allows users/teams in a same Enterprise to use this report, various departments within an enterpise can use this report
Add to Cart
Buy Now (15% Discount)

OUR CUSTOMER

Samsung SD

SIMILAR REPORTS


RELATED REPORTS

Global Spinal Needle for Surgery Market Research Report 2025

120 Pages
Type: Report
Code: QYRE-Auto-37D12504
Wed Dec 03 00:00:00 UTC 2025

Add to Cart

Global Autonomous Ultrasound Guidance Market Research Report 2025

120 Pages
Type: Report
Code: QYRE-Auto-9D20268
Fri Nov 28 00:00:00 UTC 2025

Add to Cart

Global Radiation Therapy Contouring Software Market Research Report 2025

120 Pages
Type: Report
Code: QYRE-Auto-29Q19843
Thu Nov 27 00:00:00 UTC 2025

Add to Cart

Global Biliary and Pancreatic Drainage Stent Market Research Report 2025

120 Pages
Type: Report
Code: QYRE-Auto-27T19786
Wed Nov 19 00:00:00 UTC 2025

Add to Cart