List of Tables
Table 1. Global Healthcare and Hospital Furniture Market Size Growth Rate by Type (US$ Million): 2020 VS 2024 VS 2031
Table 2. Key Players of Patient Room Furniture
Table 3. Key Players of Treatment & Surgery Furniture
Table 4. Key Players of Public Area Furniture
Table 5. Key Players of Rehabilitation & Therapy Furniture
Table 6. Key Players of Others
Table 7. Global Healthcare and Hospital Furniture Market Size Growth Rate by Material (US$ Million): 2020 VS 2024 VS 2031
Table 8. Key Players of Wooden Furniture
Table 9. Key Players of Metal Furniture
Table 10. Key Players of Other
Table 11. Global Healthcare and Hospital Furniture Market Size Growth Rate by Distribution Channel (US$ Million): 2020 VS 2024 VS 2031
Table 12. Key Players of Direct Sales
Table 13. Key Players of Retail Stores
Table 14. Key Players of E-commerce
Table 15. Key Players of Dealership & Distributors
Table 16. Global Healthcare and Hospital Furniture Market Size Growth by Application (US$ Million): 2020 VS 2024 VS 2031
Table 17. Global Healthcare and Hospital Furniture Market Size by Region (US$ Million): 2020 VS 2024 VS 2031
Table 18. Global Healthcare and Hospital Furniture Market Size by Region (2020-2025) & (US$ Million)
Table 19. Global Healthcare and Hospital Furniture Market Share by Region (2020-2025)
Table 20. Global Healthcare and Hospital Furniture Forecasted Market Size by Region (2026-2031) & (US$ Million)
Table 21. Global Healthcare and Hospital Furniture Market Share by Region (2026-2031)
Table 22. Healthcare and Hospital Furniture Market Trends
Table 23. Healthcare and Hospital Furniture Market Drivers
Table 24. Healthcare and Hospital Furniture Market Challenges
Table 25. Healthcare and Hospital Furniture Market Restraints
Table 26. Global Healthcare and Hospital Furniture Revenue by Players (2020-2025) & (US$ Million)
Table 27. Global Healthcare and Hospital Furniture Market Share by Players (2020-2025)
Table 28. Global Top Healthcare and Hospital Furniture Players by Company Type (Tier 1, Tier 2, and Tier 3) & (based on the Revenue in Healthcare and Hospital Furniture as of 2024)
Table 29. Ranking of Global Top Healthcare and Hospital Furniture Companies by Revenue (US$ Million) in 2024
Table 30. Global 5 Largest Players Market Share by Healthcare and Hospital Furniture Revenue (CR5 and HHI) & (2020-2025)
Table 31. Global Key Players of Healthcare and Hospital Furniture, Headquarters and Area Served
Table 32. Global Key Players of Healthcare and Hospital Furniture, Product and Application
Table 33. Global Key Players of Healthcare and Hospital Furniture, Date of Enter into This Industry
Table 34. Mergers & Acquisitions, Expansion Plans
Table 35. Global Healthcare and Hospital Furniture Market Size by Type (2020-2025) & (US$ Million)
Table 36. Global Healthcare and Hospital Furniture Revenue Market Share by Type (2020-2025)
Table 37. Global Healthcare and Hospital Furniture Forecasted Market Size by Type (2026-2031) & (US$ Million)
Table 38. Global Healthcare and Hospital Furniture Revenue Market Share by Type (2026-2031)
Table 39. Global Healthcare and Hospital Furniture Market Size by Application (2020-2025) & (US$ Million)
Table 40. Global Healthcare and Hospital Furniture Revenue Market Share by Application (2020-2025)
Table 41. Global Healthcare and Hospital Furniture Forecasted Market Size by Application (2026-2031) & (US$ Million)
Table 42. Global Healthcare and Hospital Furniture Revenue Market Share by Application (2026-2031)
Table 43. North America Healthcare and Hospital Furniture Market Size Growth Rate by Country (US$ Million): 2020 VS 2024 VS 2031
Table 44. North America Healthcare and Hospital Furniture Market Size by Country (2020-2025) & (US$ Million)
Table 45. North America Healthcare and Hospital Furniture Market Size by Country (2026-2031) & (US$ Million)
Table 46. Europe Healthcare and Hospital Furniture Market Size Growth Rate by Country (US$ Million): 2020 VS 2024 VS 2031
Table 47. Europe Healthcare and Hospital Furniture Market Size by Country (2020-2025) & (US$ Million)
Table 48. Europe Healthcare and Hospital Furniture Market Size by Country (2026-2031) & (US$ Million)
Table 49. Asia-Pacific Healthcare and Hospital Furniture Market Size Growth Rate by Region (US$ Million): 2020 VS 2024 VS 2031
Table 50. Asia-Pacific Healthcare and Hospital Furniture Market Size by Region (2020-2025) & (US$ Million)
Table 51. Asia-Pacific Healthcare and Hospital Furniture Market Size by Region (2026-2031) & (US$ Million)
Table 52. Latin America Healthcare and Hospital Furniture Market Size Growth Rate by Country (US$ Million): 2020 VS 2024 VS 2031
Table 53. Latin America Healthcare and Hospital Furniture Market Size by Country (2020-2025) & (US$ Million)
Table 54. Latin America Healthcare and Hospital Furniture Market Size by Country (2026-2031) & (US$ Million)
Table 55. Middle East & Africa Healthcare and Hospital Furniture Market Size Growth Rate by Country (US$ Million): 2020 VS 2024 VS 2031
Table 56. Middle East & Africa Healthcare and Hospital Furniture Market Size by Country (2020-2025) & (US$ Million)
Table 57. Middle East & Africa Healthcare and Hospital Furniture Market Size by Country (2026-2031) & (US$ Million)
Table 58. Hill-Rom Company Details
Table 59. Hill-Rom Business Overview
Table 60. Hill-Rom Healthcare and Hospital Furniture Product
Table 61. Hill-Rom Revenue in Healthcare and Hospital Furniture Business (2020-2025) & (US$ Million)
Table 62. Hill-Rom Recent Development
Table 63. Paramount Bed Holdings Company Details
Table 64. Paramount Bed Holdings Business Overview
Table 65. Paramount Bed Holdings Healthcare and Hospital Furniture Product
Table 66. Paramount Bed Holdings Revenue in Healthcare and Hospital Furniture Business (2020-2025) & (US$ Million)
Table 67. Paramount Bed Holdings Recent Development
Table 68. Stryker Company Details
Table 69. Stryker Business Overview
Table 70. Stryker Healthcare and Hospital Furniture Product
Table 71. Stryker Revenue in Healthcare and Hospital Furniture Business (2020-2025) & (US$ Million)
Table 72. Stryker Recent Development
Table 73. Linet Group Company Details
Table 74. Linet Group Business Overview
Table 75. Linet Group Healthcare and Hospital Furniture Product
Table 76. Linet Group Revenue in Healthcare and Hospital Furniture Business (2020-2025) & (US$ Million)
Table 77. Linet Group Recent Development
Table 78. Stiegelmeyer Company Details
Table 79. Stiegelmeyer Business Overview
Table 80. Stiegelmeyer Healthcare and Hospital Furniture Product
Table 81. Stiegelmeyer Revenue in Healthcare and Hospital Furniture Business (2020-2025) & (US$ Million)
Table 82. Stiegelmeyer Recent Development
Table 83. ArjoHuntleigh Company Details
Table 84. ArjoHuntleigh Business Overview
Table 85. ArjoHuntleigh Healthcare and Hospital Furniture Product
Table 86. ArjoHuntleigh Revenue in Healthcare and Hospital Furniture Business (2020-2025) & (US$ Million)
Table 87. ArjoHuntleigh Recent Development
Table 88. Pardo Company Details
Table 89. Pardo Business Overview
Table 90. Pardo Healthcare and Hospital Furniture Product
Table 91. Pardo Revenue in Healthcare and Hospital Furniture Business (2020-2025) & (US$ Million)
Table 92. Pardo Recent Development
Table 93. France Bed Company Details
Table 94. France Bed Business Overview
Table 95. France Bed Healthcare and Hospital Furniture Product
Table 96. France Bed Revenue in Healthcare and Hospital Furniture Business (2020-2025) & (US$ Million)
Table 97. France Bed Recent Development
Table 98. Bazhou Greatwall Company Details
Table 99. Bazhou Greatwall Business Overview
Table 100. Bazhou Greatwall Healthcare and Hospital Furniture Product
Table 101. Bazhou Greatwall Revenue in Healthcare and Hospital Furniture Business (2020-2025) & (US$ Million)
Table 102. Bazhou Greatwall Recent Development
Table 103. Malvestio Company Details
Table 104. Malvestio Business Overview
Table 105. Malvestio Healthcare and Hospital Furniture Product
Table 106. Malvestio Revenue in Healthcare and Hospital Furniture Business (2020-2025) & (US$ Million)
Table 107. Malvestio Recent Development
Table 108. Steelcase Company Details
Table 109. Steelcase Business Overview
Table 110. Steelcase Healthcare and Hospital Furniture Product
Table 111. Steelcase Revenue in Healthcare and Hospital Furniture Business (2020-2025) & (US$ Million)
Table 112. Steelcase Recent Development
Table 113. AGA Sanitätsartikel Company Details
Table 114. AGA Sanitätsartikel Business Overview
Table 115. AGA Sanitätsartikel Healthcare and Hospital Furniture Product
Table 116. AGA Sanitätsartikel Revenue in Healthcare and Hospital Furniture Business (2020-2025) & (US$ Million)
Table 117. AGA Sanitätsartikel Recent Development
Table 118. Silentia Company Details
Table 119. Silentia Business Overview
Table 120. Silentia Healthcare and Hospital Furniture Product
Table 121. Silentia Revenue in Healthcare and Hospital Furniture Business (2020-2025) & (US$ Million)
Table 122. Silentia Recent Development
Table 123. Merivaara Company Details
Table 124. Merivaara Business Overview
Table 125. Merivaara Healthcare and Hospital Furniture Product
Table 126. Merivaara Revenue in Healthcare and Hospital Furniture Business (2020-2025) & (US$ Million)
Table 127. Merivaara Recent Development
Table 128. MillerKnoll Company Details
Table 129. MillerKnoll Business Overview
Table 130. MillerKnoll Healthcare and Hospital Furniture Product
Table 131. MillerKnoll Revenue in Healthcare and Hospital Furniture Business (2020-2025) & (US$ Million)
Table 132. MillerKnoll Recent Development
Table 133. Haelvoet Company Details
Table 134. Haelvoet Business Overview
Table 135. Haelvoet Healthcare and Hospital Furniture Product
Table 136. Haelvoet Revenue in Healthcare and Hospital Furniture Business (2020-2025) & (US$ Million)
Table 137. Haelvoet Recent Development
Table 138. Mespa Company Details
Table 139. Mespa Business Overview
Table 140. Mespa Healthcare and Hospital Furniture Product
Table 141. Mespa Revenue in Healthcare and Hospital Furniture Business (2020-2025) & (US$ Million)
Table 142. Mespa Recent Development
Table 143. EME Furniture Company Details
Table 144. EME Furniture Business Overview
Table 145. EME Furniture Healthcare and Hospital Furniture Product
Table 146. EME Furniture Revenue in Healthcare and Hospital Furniture Business (2020-2025) & (US$ Million)
Table 147. EME Furniture Recent Development
Table 148. ONLEAD Company Details
Table 149. ONLEAD Business Overview
Table 150. ONLEAD Healthcare and Hospital Furniture Product
Table 151. ONLEAD Revenue in Healthcare and Hospital Furniture Business (2020-2025) & (US$ Million)
Table 152. ONLEAD Recent Development
Table 153. Huachan Medical Company Details
Table 154. Huachan Medical Business Overview
Table 155. Huachan Medical Healthcare and Hospital Furniture Product
Table 156. Huachan Medical Revenue in Healthcare and Hospital Furniture Business (2020-2025) & (US$ Million)
Table 157. Huachan Medical Recent Development
Table 158. Haworth Company Details
Table 159. Haworth Business Overview
Table 160. Haworth Healthcare and Hospital Furniture Product
Table 161. Haworth Revenue in Healthcare and Hospital Furniture Business (2020-2025) & (US$ Million)
Table 162. Haworth Recent Development
Table 163. Wieland Healthcare Company Details
Table 164. Wieland Healthcare Business Overview
Table 165. Wieland Healthcare Healthcare and Hospital Furniture Product
Table 166. Wieland Healthcare Revenue in Healthcare and Hospital Furniture Business (2020-2025) & (US$ Million)
Table 167. Wieland Healthcare Recent Development
Table 168. Research Programs/Design for This Report
Table 169. Key Data Information from Secondary Sources
Table 170. Key Data Information from Primary Sources
Table 171. Authors List of This Report
List of Figures
Figure 1. Healthcare and Hospital Furniture Picture
Figure 2. Global Healthcare and Hospital Furniture Market Size Comparison by Type (2020-2031) & (US$ Million)
Figure 3. Global Healthcare and Hospital Furniture Market Share by Type: 2024 VS 2031
Figure 4. Patient Room Furniture Features
Figure 5. Treatment & Surgery Furniture Features
Figure 6. Public Area Furniture Features
Figure 7. Rehabilitation & Therapy Furniture Features
Figure 8. Others Features
Figure 9. Global Healthcare and Hospital Furniture Market Size Comparison by Material (2020-2031) & (US$ Million)
Figure 10. Wooden Furniture Features
Figure 11. Metal Furniture Features
Figure 12. Other Features
Figure 13. Global Healthcare and Hospital Furniture Market Size Comparison by Distribution Channel (2020-2031) & (US$ Million)
Figure 14. Direct Sales Features
Figure 15. Retail Stores Features
Figure 16. E-commerce Features
Figure 17. Dealership & Distributors Features
Figure 18. Global Healthcare and Hospital Furniture Market Size by Application (2020-2031) & (US$ Million)
Figure 19. Global Healthcare and Hospital Furniture Market Share by Application: 2024 VS 2031
Figure 20. Hospital Case Studies
Figure 21. Clinic Case Studies
Figure 22. Others Case Studies
Figure 23. Healthcare and Hospital Furniture Report Years Considered
Figure 24. Global Healthcare and Hospital Furniture Market Size (US$ Million), Year-over-Year: 2020-2031
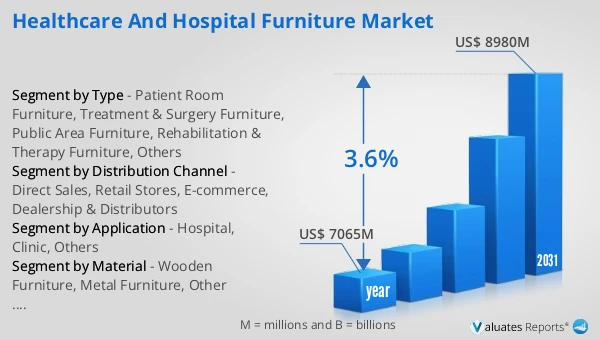
Figure 25. Global Healthcare and Hospital Furniture Market Size, (US$ Million), 2020 VS 2024 VS 2031
Figure 26. Global Healthcare and Hospital Furniture Market Share by Region: 2024 VS 2031
Figure 27. Global Healthcare and Hospital Furniture Market Share by Players in 2024
Figure 28. Global Healthcare and Hospital Furniture Market Share by Company Type (Tier 1, Tier 2, and Tier 3)
Figure 29. The Top 10 and 5 Players Market Share by Healthcare and Hospital Furniture Revenue in 2024
Figure 30. North America Healthcare and Hospital Furniture Market Size YoY Growth (2020-2031) & (US$ Million)
Figure 31. North America Healthcare and Hospital Furniture Market Share by Country (2020-2031)
Figure 32. United States Healthcare and Hospital Furniture Market Size YoY Growth (2020-2031) & (US$ Million)
Figure 33. Canada Healthcare and Hospital Furniture Market Size YoY Growth (2020-2031) & (US$ Million)
Figure 34. Europe Healthcare and Hospital Furniture Market Size YoY Growth (2020-2031) & (US$ Million)
Figure 35. Europe Healthcare and Hospital Furniture Market Share by Country (2020-2031)
Figure 36. Germany Healthcare and Hospital Furniture Market Size YoY Growth (2020-2031) & (US$ Million)
Figure 37. France Healthcare and Hospital Furniture Market Size YoY Growth (2020-2031) & (US$ Million)
Figure 38. U.K. Healthcare and Hospital Furniture Market Size YoY Growth (2020-2031) & (US$ Million)
Figure 39. Italy Healthcare and Hospital Furniture Market Size YoY Growth (2020-2031) & (US$ Million)
Figure 40. Russia Healthcare and Hospital Furniture Market Size YoY Growth (2020-2031) & (US$ Million)
Figure 41. Ireland Healthcare and Hospital Furniture Market Size YoY Growth (2020-2031) & (US$ Million)
Figure 42. Asia-Pacific Healthcare and Hospital Furniture Market Size YoY Growth (2020-2031) & (US$ Million)
Figure 43. Asia-Pacific Healthcare and Hospital Furniture Market Share by Region (2020-2031)
Figure 44. China Healthcare and Hospital Furniture Market Size YoY Growth (2020-2031) & (US$ Million)
Figure 45. Japan Healthcare and Hospital Furniture Market Size YoY Growth (2020-2031) & (US$ Million)
Figure 46. South Korea Healthcare and Hospital Furniture Market Size YoY Growth (2020-2031) & (US$ Million)
Figure 47. Southeast Asia Healthcare and Hospital Furniture Market Size YoY Growth (2020-2031) & (US$ Million)
Figure 48. India Healthcare and Hospital Furniture Market Size YoY Growth (2020-2031) & (US$ Million)
Figure 49. Australia & New Zealand Healthcare and Hospital Furniture Market Size YoY Growth (2020-2031) & (US$ Million)
Figure 50. Latin America Healthcare and Hospital Furniture Market Size YoY Growth (2020-2031) & (US$ Million)
Figure 51. Latin America Healthcare and Hospital Furniture Market Share by Country (2020-2031)
Figure 52. Mexico Healthcare and Hospital Furniture Market Size YoY Growth (2020-2031) & (US$ Million)
Figure 53. Brazil Healthcare and Hospital Furniture Market Size YoY Growth (2020-2031) & (US$ Million)
Figure 54. Middle East & Africa Healthcare and Hospital Furniture Market Size YoY Growth (2020-2031) & (US$ Million)
Figure 55. Middle East & Africa Healthcare and Hospital Furniture Market Share by Country (2020-2031)
Figure 56. Israel Healthcare and Hospital Furniture Market Size YoY Growth (2020-2031) & (US$ Million)
Figure 57. Saudi Arabia Healthcare and Hospital Furniture Market Size YoY Growth (2020-2031) & (US$ Million)
Figure 58. UAE Healthcare and Hospital Furniture Market Size YoY Growth (2020-2031) & (US$ Million)
Figure 59. Hill-Rom Revenue Growth Rate in Healthcare and Hospital Furniture Business (2020-2025)
Figure 60. Paramount Bed Holdings Revenue Growth Rate in Healthcare and Hospital Furniture Business (2020-2025)
Figure 61. Stryker Revenue Growth Rate in Healthcare and Hospital Furniture Business (2020-2025)
Figure 62. Linet Group Revenue Growth Rate in Healthcare and Hospital Furniture Business (2020-2025)
Figure 63. Stiegelmeyer Revenue Growth Rate in Healthcare and Hospital Furniture Business (2020-2025)
Figure 64. ArjoHuntleigh Revenue Growth Rate in Healthcare and Hospital Furniture Business (2020-2025)
Figure 65. Pardo Revenue Growth Rate in Healthcare and Hospital Furniture Business (2020-2025)
Figure 66. France Bed Revenue Growth Rate in Healthcare and Hospital Furniture Business (2020-2025)
Figure 67. Bazhou Greatwall Revenue Growth Rate in Healthcare and Hospital Furniture Business (2020-2025)
Figure 68. Malvestio Revenue Growth Rate in Healthcare and Hospital Furniture Business (2020-2025)
Figure 69. Steelcase Revenue Growth Rate in Healthcare and Hospital Furniture Business (2020-2025)
Figure 70. AGA Sanitätsartikel Revenue Growth Rate in Healthcare and Hospital Furniture Business (2020-2025)
Figure 71. Silentia Revenue Growth Rate in Healthcare and Hospital Furniture Business (2020-2025)
Figure 72. Merivaara Revenue Growth Rate in Healthcare and Hospital Furniture Business (2020-2025)
Figure 73. MillerKnoll Revenue Growth Rate in Healthcare and Hospital Furniture Business (2020-2025)
Figure 74. Haelvoet Revenue Growth Rate in Healthcare and Hospital Furniture Business (2020-2025)
Figure 75. Mespa Revenue Growth Rate in Healthcare and Hospital Furniture Business (2020-2025)
Figure 76. EME Furniture Revenue Growth Rate in Healthcare and Hospital Furniture Business (2020-2025)
Figure 77. ONLEAD Revenue Growth Rate in Healthcare and Hospital Furniture Business (2020-2025)
Figure 78. Huachan Medical Revenue Growth Rate in Healthcare and Hospital Furniture Business (2020-2025)
Figure 79. Haworth Revenue Growth Rate in Healthcare and Hospital Furniture Business (2020-2025)
Figure 80. Wieland Healthcare Revenue Growth Rate in Healthcare and Hospital Furniture Business (2020-2025)
Figure 81. Bottom-up and Top-down Approaches for This Report
Figure 82. Data Triangulation
Figure 83. Key Executives Interviewed