List of Tables
Table 1. Global Urban Farming Market Size Growth Rate by Type (US$ Million): 2020 VS 2024 VS 2031
Table 2. Key Players of Animal Husbandry
Table 3. Key Players of Aquaculture
Table 4. Key Players of Agroforestry
Table 5. Key Players of Urban Beekeeping
Table 6. Key Players of Horticulture
Table 7. Global Urban Farming Market Size Growth by Application (US$ Million): 2020 VS 2024 VS 2031
Table 8. Global Urban Farming Market Size by Region (US$ Million): 2020 VS 2024 VS 2031
Table 9. Global Urban Farming Market Size by Region (2020-2025) & (US$ Million)
Table 10. Global Urban Farming Market Share by Region (2020-2025)
Table 11. Global Urban Farming Forecasted Market Size by Region (2026-2031) & (US$ Million)
Table 12. Global Urban Farming Market Share by Region (2026-2031)
Table 13. Urban Farming Market Trends
Table 14. Urban Farming Market Drivers
Table 15. Urban Farming Market Challenges
Table 16. Urban Farming Market Restraints
Table 17. Global Urban Farming Revenue by Players (2020-2025) & (US$ Million)
Table 18. Global Urban Farming Market Share by Players (2020-2025)
Table 19. Global Top Urban Farming Players by Company Type (Tier 1, Tier 2, and Tier 3) & (based on the Revenue in Urban Farming as of 2024)
Table 20. Ranking of Global Top Urban Farming Companies by Revenue (US$ Million) in 2024
Table 21. Global 5 Largest Players Market Share by Urban Farming Revenue (CR5 and HHI) & (2020-2025)
Table 22. Global Key Players of Urban Farming, Headquarters and Area Served
Table 23. Global Key Players of Urban Farming, Product and Application
Table 24. Global Key Players of Urban Farming, Date of Enter into This Industry
Table 25. Mergers & Acquisitions, Expansion Plans
Table 26. Global Urban Farming Market Size by Type (2020-2025) & (US$ Million)
Table 27. Global Urban Farming Revenue Market Share by Type (2020-2025)
Table 28. Global Urban Farming Forecasted Market Size by Type (2026-2031) & (US$ Million)
Table 29. Global Urban Farming Revenue Market Share by Type (2026-2031)
Table 30. Global Urban Farming Market Size by Application (2020-2025) & (US$ Million)
Table 31. Global Urban Farming Revenue Market Share by Application (2020-2025)
Table 32. Global Urban Farming Forecasted Market Size by Application (2026-2031) & (US$ Million)
Table 33. Global Urban Farming Revenue Market Share by Application (2026-2031)
Table 34. North America Urban Farming Market Size Growth Rate by Country (US$ Million): 2020 VS 2024 VS 2031
Table 35. North America Urban Farming Market Size by Country (2020-2025) & (US$ Million)
Table 36. North America Urban Farming Market Size by Country (2026-2031) & (US$ Million)
Table 37. Europe Urban Farming Market Size Growth Rate by Country (US$ Million): 2020 VS 2024 VS 2031
Table 38. Europe Urban Farming Market Size by Country (2020-2025) & (US$ Million)
Table 39. Europe Urban Farming Market Size by Country (2026-2031) & (US$ Million)
Table 40. Asia-Pacific Urban Farming Market Size Growth Rate by Region (US$ Million): 2020 VS 2024 VS 2031
Table 41. Asia-Pacific Urban Farming Market Size by Region (2020-2025) & (US$ Million)
Table 42. Asia-Pacific Urban Farming Market Size by Region (2026-2031) & (US$ Million)
Table 43. Latin America Urban Farming Market Size Growth Rate by Country (US$ Million): 2020 VS 2024 VS 2031
Table 44. Latin America Urban Farming Market Size by Country (2020-2025) & (US$ Million)
Table 45. Latin America Urban Farming Market Size by Country (2026-2031) & (US$ Million)
Table 46. Middle East & Africa Urban Farming Market Size Growth Rate by Country (US$ Million): 2020 VS 2024 VS 2031
Table 47. Middle East & Africa Urban Farming Market Size by Country (2020-2025) & (US$ Million)
Table 48. Middle East & Africa Urban Farming Market Size by Country (2026-2031) & (US$ Million)
Table 49. Gotham Greens Company Details
Table 50. Gotham Greens Business Overview
Table 51. Gotham Greens Urban Farming Product
Table 52. Gotham Greens Revenue in Urban Farming Business (2020-2025) & (US$ Million)
Table 53. Gotham Greens Recent Development
Table 54. Brooklyn Grange Farm Company Details
Table 55. Brooklyn Grange Farm Business Overview
Table 56. Brooklyn Grange Farm Urban Farming Product
Table 57. Brooklyn Grange Farm Revenue in Urban Farming Business (2020-2025) & (US$ Million)
Table 58. Brooklyn Grange Farm Recent Development
Table 59. UrbanFarmers AG Company Details
Table 60. UrbanFarmers AG Business Overview
Table 61. UrbanFarmers AG Urban Farming Product
Table 62. UrbanFarmers AG Revenue in Urban Farming Business (2020-2025) & (US$ Million)
Table 63. UrbanFarmers AG Recent Development
Table 64. BrightFarms Company Details
Table 65. BrightFarms Business Overview
Table 66. BrightFarms Urban Farming Product
Table 67. BrightFarms Revenue in Urban Farming Business (2020-2025) & (US$ Million)
Table 68. BrightFarms Recent Development
Table 69. GrowUP Urban Farms Company Details
Table 70. GrowUP Urban Farms Business Overview
Table 71. GrowUP Urban Farms Urban Farming Product
Table 72. GrowUP Urban Farms Revenue in Urban Farming Business (2020-2025) & (US$ Million)
Table 73. GrowUP Urban Farms Recent Development
Table 74. Garden Fresh Farms Company Details
Table 75. Garden Fresh Farms Business Overview
Table 76. Garden Fresh Farms Urban Farming Product
Table 77. Garden Fresh Farms Revenue in Urban Farming Business (2020-2025) & (US$ Million)
Table 78. Garden Fresh Farms Recent Development
Table 79. Edenworks Company Details
Table 80. Edenworks Business Overview
Table 81. Edenworks Urban Farming Product
Table 82. Edenworks Revenue in Urban Farming Business (2020-2025) & (US$ Million)
Table 83. Edenworks Recent Development
Table 84. Pasona Company Details
Table 85. Pasona Business Overview
Table 86. Pasona Urban Farming Product
Table 87. Pasona Revenue in Urban Farming Business (2020-2025) & (US$ Million)
Table 88. Pasona Recent Development
Table 89. Sky Green Company Details
Table 90. Sky Green Business Overview
Table 91. Sky Green Urban Farming Product
Table 92. Sky Green Revenue in Urban Farming Business (2020-2025) & (US$ Million)
Table 93. Sky Green Recent Development
Table 94. Green Sense Farms Company Details
Table 95. Green Sense Farms Business Overview
Table 96. Green Sense Farms Urban Farming Product
Table 97. Green Sense Farms Revenue in Urban Farming Business (2020-2025) & (US$ Million)
Table 98. Green Sense Farms Recent Development
Table 99. American Hydroponics Company Details
Table 100. American Hydroponics Business Overview
Table 101. American Hydroponics Urban Farming Product
Table 102. American Hydroponics Revenue in Urban Farming Business (2020-2025) & (US$ Million)
Table 103. American Hydroponics Recent Development
Table 104. Agrilution Company Details
Table 105. Agrilution Business Overview
Table 106. Agrilution Urban Farming Product
Table 107. Agrilution Revenue in Urban Farming Business (2020-2025) & (US$ Million)
Table 108. Agrilution Recent Development
Table 109. Certhon Company Details
Table 110. Certhon Business Overview
Table 111. Certhon Urban Farming Product
Table 112. Certhon Revenue in Urban Farming Business (2020-2025) & (US$ Million)
Table 113. Certhon Recent Development
Table 114. Dalsem Company Details
Table 115. Dalsem Business Overview
Table 116. Dalsem Urban Farming Product
Table 117. Dalsem Revenue in Urban Farming Business (2020-2025) & (US$ Million)
Table 118. Dalsem Recent Development
Table 119. Harnois Greenhouses Company Details
Table 120. Harnois Greenhouses Business Overview
Table 121. Harnois Greenhouses Urban Farming Product
Table 122. Harnois Greenhouses Revenue in Urban Farming Business (2020-2025) & (US$ Million)
Table 123. Harnois Greenhouses Recent Development
Table 124. Richel Group Company Details
Table 125. Richel Group Business Overview
Table 126. Richel Group Urban Farming Product
Table 127. Richel Group Revenue in Urban Farming Business (2020-2025) & (US$ Million)
Table 128. Richel Group Recent Development
Table 129. Urban Crop Solutions Company Details
Table 130. Urban Crop Solutions Business Overview
Table 131. Urban Crop Solutions Urban Farming Product
Table 132. Urban Crop Solutions Revenue in Urban Farming Business (2020-2025) & (US$ Million)
Table 133. Urban Crop Solutions Recent Development
Table 134. Vertical Farm Systems Company Details
Table 135. Vertical Farm Systems Business Overview
Table 136. Vertical Farm Systems Urban Farming Product
Table 137. Vertical Farm Systems Revenue in Urban Farming Business (2020-2025) & (US$ Million)
Table 138. Vertical Farm Systems Recent Development
Table 139. Philips Lighting Company Details
Table 140. Philips Lighting Business Overview
Table 141. Philips Lighting Urban Farming Product
Table 142. Philips Lighting Revenue in Urban Farming Business (2020-2025) & (US$ Million)
Table 143. Philips Lighting Recent Development
Table 144. Everlight Electronics Company Details
Table 145. Everlight Electronics Business Overview
Table 146. Everlight Electronics Urban Farming Product
Table 147. Everlight Electronics Revenue in Urban Farming Business (2020-2025) & (US$ Million)
Table 148. Everlight Electronics Recent Development
Table 149. Argus Controls Systems Company Details
Table 150. Argus Controls Systems Business Overview
Table 151. Argus Controls Systems Urban Farming Product
Table 152. Argus Controls Systems Revenue in Urban Farming Business (2020-2025) & (US$ Million)
Table 153. Argus Controls Systems Recent Development
Table 154. Netafim Company Details
Table 155. Netafim Business Overview
Table 156. Netafim Urban Farming Product
Table 157. Netafim Revenue in Urban Farming Business (2020-2025) & (US$ Million)
Table 158. Netafim Recent Development
Table 159. Hydrodynamics Company Details
Table 160. Hydrodynamics Business Overview
Table 161. Hydrodynamics Urban Farming Product
Table 162. Hydrodynamics Revenue in Urban Farming Business (2020-2025) & (US$ Million)
Table 163. Hydrodynamics Recent Development
Table 164. Research Programs/Design for This Report
Table 165. Key Data Information from Secondary Sources
Table 166. Key Data Information from Primary Sources
Table 167. Authors List of This Report
List of Figures
Figure 1. Urban Farming Picture
Figure 2. Global Urban Farming Market Size Comparison by Type (2020-2031) & (US$ Million)
Figure 3. Global Urban Farming Market Share by Type: 2024 VS 2031
Figure 4. Animal Husbandry Features
Figure 5. Aquaculture Features
Figure 6. Agroforestry Features
Figure 7. Urban Beekeeping Features
Figure 8. Horticulture Features
Figure 9. Global Urban Farming Market Size by Application (2020-2031) & (US$ Million)
Figure 10. Global Urban Farming Market Share by Application: 2024 VS 2031
Figure 11. Commercial Case Studies
Figure 12. Community Case Studies
Figure 13. Home Gardens Case Studies
Figure 14. Corporate Case Studies
Figure 15. Others Case Studies
Figure 16. Urban Farming Report Years Considered
Figure 17. Global Urban Farming Market Size (US$ Million), Year-over-Year: 2020-2031
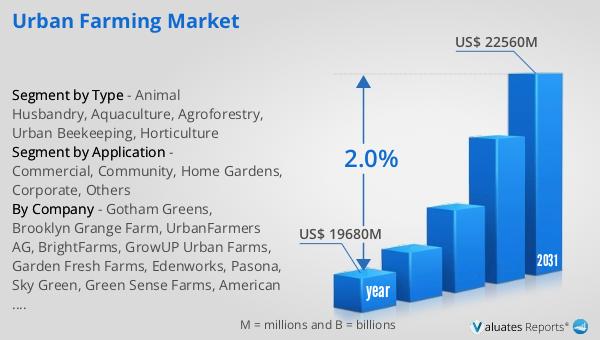
Figure 18. Global Urban Farming Market Size, (US$ Million), 2020 VS 2024 VS 2031
Figure 19. Global Urban Farming Market Share by Region: 2024 VS 2031
Figure 20. Global Urban Farming Market Share by Players in 2024
Figure 21. Global Top Urban Farming Players by Company Type (Tier 1, Tier 2, and Tier 3) & (based on the Revenue in Urban Farming as of 2024)
Figure 22. The Top 10 and 5 Players Market Share by Urban Farming Revenue in 2024
Figure 23. North America Urban Farming Market Size YoY Growth (2020-2031) & (US$ Million)
Figure 24. North America Urban Farming Market Share by Country (2020-2031)
Figure 25. United States Urban Farming Market Size YoY Growth (2020-2031) & (US$ Million)
Figure 26. Canada Urban Farming Market Size YoY Growth (2020-2031) & (US$ Million)
Figure 27. Europe Urban Farming Market Size YoY Growth (2020-2031) & (US$ Million)
Figure 28. Europe Urban Farming Market Share by Country (2020-2031)
Figure 29. Germany Urban Farming Market Size YoY Growth (2020-2031) & (US$ Million)
Figure 30. France Urban Farming Market Size YoY Growth (2020-2031) & (US$ Million)
Figure 31. U.K. Urban Farming Market Size YoY Growth (2020-2031) & (US$ Million)
Figure 32. Italy Urban Farming Market Size YoY Growth (2020-2031) & (US$ Million)
Figure 33. Russia Urban Farming Market Size YoY Growth (2020-2031) & (US$ Million)
Figure 34. Nordic Countries Urban Farming Market Size YoY Growth (2020-2031) & (US$ Million)
Figure 35. Asia-Pacific Urban Farming Market Size YoY Growth (2020-2031) & (US$ Million)
Figure 36. Asia-Pacific Urban Farming Market Share by Region (2020-2031)
Figure 37. China Urban Farming Market Size YoY Growth (2020-2031) & (US$ Million)
Figure 38. Japan Urban Farming Market Size YoY Growth (2020-2031) & (US$ Million)
Figure 39. South Korea Urban Farming Market Size YoY Growth (2020-2031) & (US$ Million)
Figure 40. Southeast Asia Urban Farming Market Size YoY Growth (2020-2031) & (US$ Million)
Figure 41. India Urban Farming Market Size YoY Growth (2020-2031) & (US$ Million)
Figure 42. Australia Urban Farming Market Size YoY Growth (2020-2031) & (US$ Million)
Figure 43. Latin America Urban Farming Market Size YoY Growth (2020-2031) & (US$ Million)
Figure 44. Latin America Urban Farming Market Share by Country (2020-2031)
Figure 45. Mexico Urban Farming Market Size YoY Growth (2020-2031) & (US$ Million)
Figure 46. Brazil Urban Farming Market Size YoY Growth (2020-2031) & (US$ Million)
Figure 47. Middle East & Africa Urban Farming Market Size YoY Growth (2020-2031) & (US$ Million)
Figure 48. Middle East & Africa Urban Farming Market Share by Country (2020-2031)
Figure 49. Turkey Urban Farming Market Size YoY Growth (2020-2031) & (US$ Million)
Figure 50. Saudi Arabia Urban Farming Market Size YoY Growth (2020-2031) & (US$ Million)
Figure 51. UAE Urban Farming Market Size YoY Growth (2020-2031) & (US$ Million)
Figure 52. Gotham Greens Revenue Growth Rate in Urban Farming Business (2020-2025)
Figure 53. Brooklyn Grange Farm Revenue Growth Rate in Urban Farming Business (2020-2025)
Figure 54. UrbanFarmers AG Revenue Growth Rate in Urban Farming Business (2020-2025)
Figure 55. BrightFarms Revenue Growth Rate in Urban Farming Business (2020-2025)
Figure 56. GrowUP Urban Farms Revenue Growth Rate in Urban Farming Business (2020-2025)
Figure 57. Garden Fresh Farms Revenue Growth Rate in Urban Farming Business (2020-2025)
Figure 58. Edenworks Revenue Growth Rate in Urban Farming Business (2020-2025)
Figure 59. Pasona Revenue Growth Rate in Urban Farming Business (2020-2025)
Figure 60. Sky Green Revenue Growth Rate in Urban Farming Business (2020-2025)
Figure 61. Green Sense Farms Revenue Growth Rate in Urban Farming Business (2020-2025)
Figure 62. American Hydroponics Revenue Growth Rate in Urban Farming Business (2020-2025)
Figure 63. Agrilution Revenue Growth Rate in Urban Farming Business (2020-2025)
Figure 64. Certhon Revenue Growth Rate in Urban Farming Business (2020-2025)
Figure 65. Dalsem Revenue Growth Rate in Urban Farming Business (2020-2025)
Figure 66. Harnois Greenhouses Revenue Growth Rate in Urban Farming Business (2020-2025)
Figure 67. Richel Group Revenue Growth Rate in Urban Farming Business (2020-2025)
Figure 68. Urban Crop Solutions Revenue Growth Rate in Urban Farming Business (2020-2025)
Figure 69. Vertical Farm Systems Revenue Growth Rate in Urban Farming Business (2020-2025)
Figure 70. Philips Lighting Revenue Growth Rate in Urban Farming Business (2020-2025)
Figure 71. Everlight Electronics Revenue Growth Rate in Urban Farming Business (2020-2025)
Figure 72. Argus Controls Systems Revenue Growth Rate in Urban Farming Business (2020-2025)
Figure 73. Netafim Revenue Growth Rate in Urban Farming Business (2020-2025)
Figure 74. Hydrodynamics Revenue Growth Rate in Urban Farming Business (2020-2025)
Figure 75. Bottom-up and Top-down Approaches for This Report
Figure 76. Data Triangulation
Figure 77. Key Executives Interviewed